al-brooks-course
48H - Trading the Middle of the Day
Readable self-study lecture notes for 48H - Trading the Middle of the Day.
Source Media
中段后期常测试支撑阻力
Time: 00:11
交易日走过大约三分之二、还剩最后两小时左右时,市场经常会测试某个支撑或阻力。这个测试后的反应,常常引出尾盘向上或向下的趋势。
同时要记住 80% 规则:如果市场处在趋势中,大约 80% 的反转尝试会失败;如果市场处在震荡区间中,大约 80% 的突破尝试会失败。中段后期的交易既要关注测试位置,也要判断当前市场是在趋势还是震荡区间,因为失败概率取决于环境。
开盘价是震荡日尾盘磁力
Time: 00:37
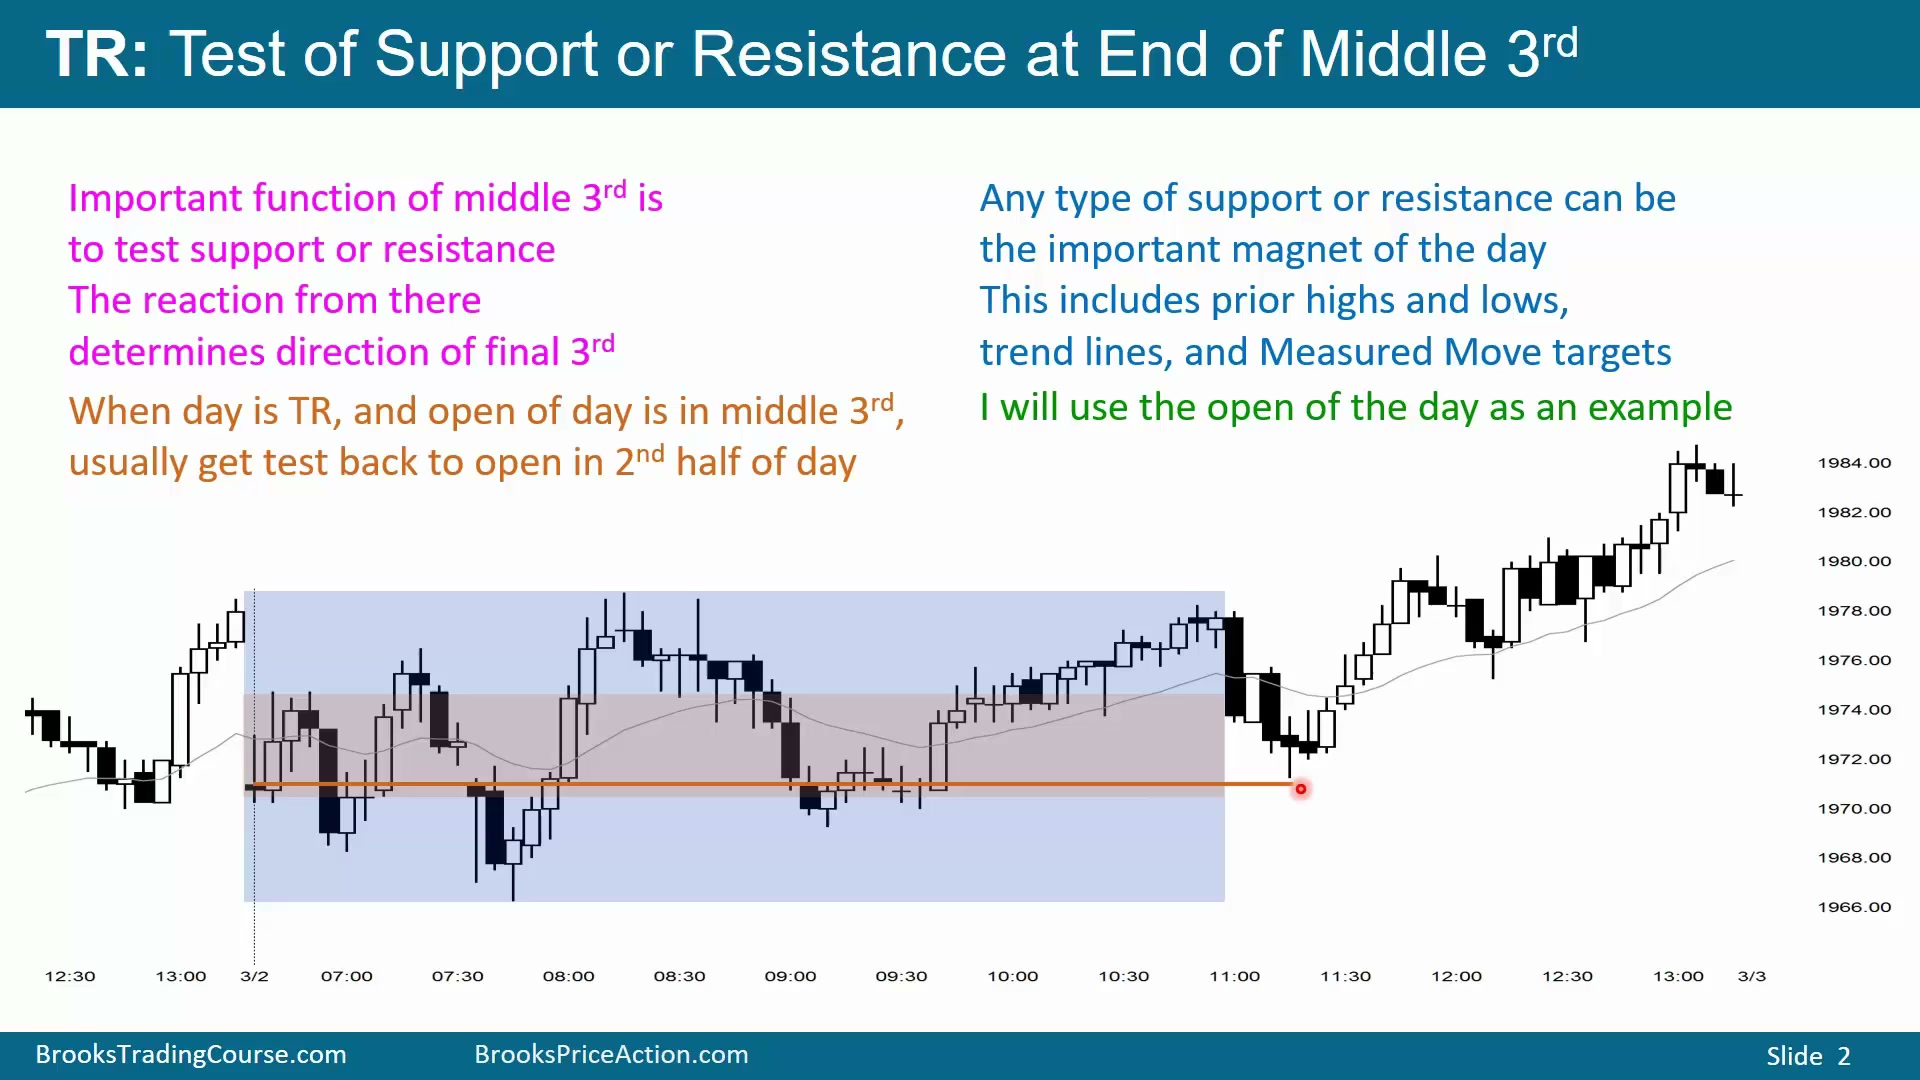
图中的交易日先形成震荡区间,并持续大约五个半小时。中段的重要功能之一,是测试某个支撑或阻力;测试后的反应常常引出最后一段上涨或下跌。这里说的“三分之一”不是严格等分 K 线数量,而是交易日的功能分段:开盘一两小时交易者寻找第一段波段,尾盘一两小时又寻找最后一段波段,中间部分就是中段。
任何支撑阻力都可能在中段末端被测试:前一日高低点、上周高低点、趋势线、measured move 目标等。图中用当天开盘价作为重要支撑阻力的例子。震荡区间日如果既低于开盘价交易,也高于开盘价交易,那么开盘价常在尾盘成为磁力。市场在开盘价上方时,经常会下跌测试开盘价;在开盘价下方时,经常会反弹测试开盘价。
这种开盘价磁力在开盘价位于前一日区间中段时更常见,但即使开盘价接近当天低点或高点,也经常发生。图中多头先向上突破,并形成较高低点,试图走出上涨趋势;当价格接近当天高点时,交易者卖出,预期再测试开盘价。虽然下跌没有完全触及开盘价,但仍属于对当天开盘价的测试。
测试开盘价后的三种结果
Time: 02:45
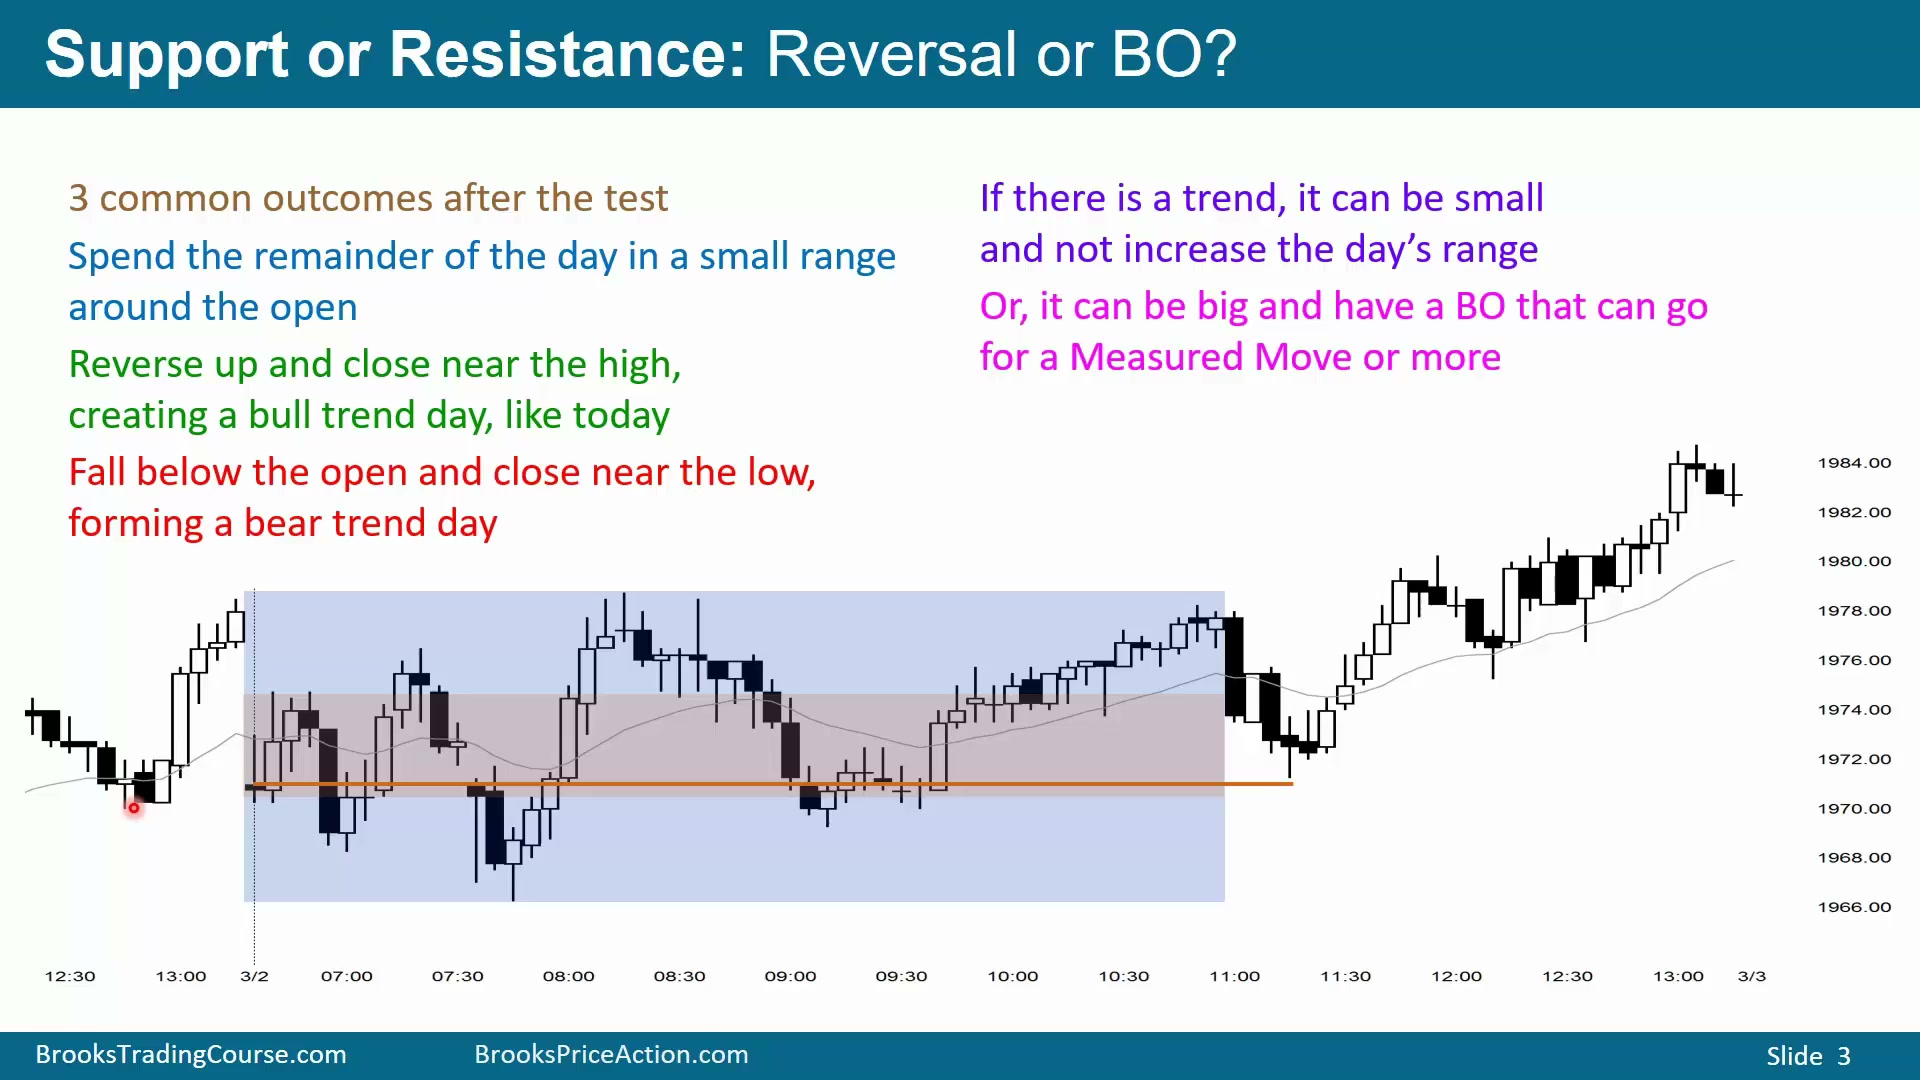
测试开盘价后通常有三种结果。第一,震荡区间继续到收盘。第二,市场从支撑反转上涨,收在高点附近,从日 K 看成为上涨趋势日;图中这一天就是这种情况。虽然 5 分钟图看起来不是很强的上涨趋势,但日 K 是接近低点开盘、接近高点收盘,仍可称为上涨趋势日。第三,市场跌破开盘价并收在当天低点附近,成为下降趋势日。
如果中段市场位于开盘价下方,逻辑相反:它通常会尝试反弹测试开盘价。测试后可能向上突破并收在高点,可能反转向下并收在低点,也可能继续横盘,使日 K 变成十字星。
图中市场在开盘价中段附近横盘,当价格反弹离开开盘价不远时,交易者卖出,寻找对开盘价的测试。测试之后,要准备三种路径:继续横盘;从开盘价支撑反转上涨并收高;或跌破开盘价支撑并收低,形成下降趋势日。有时即便收在高点、开盘在低点附近,也只是一个小上涨趋势日,不会明显扩大当天区间。只有少数情况下,前两段时间波动很小,尾盘才可能向上或向下大幅突破,并按区间高度走出 measured move。
卖压可能只是向支撑的真空测试
Time: 05:05
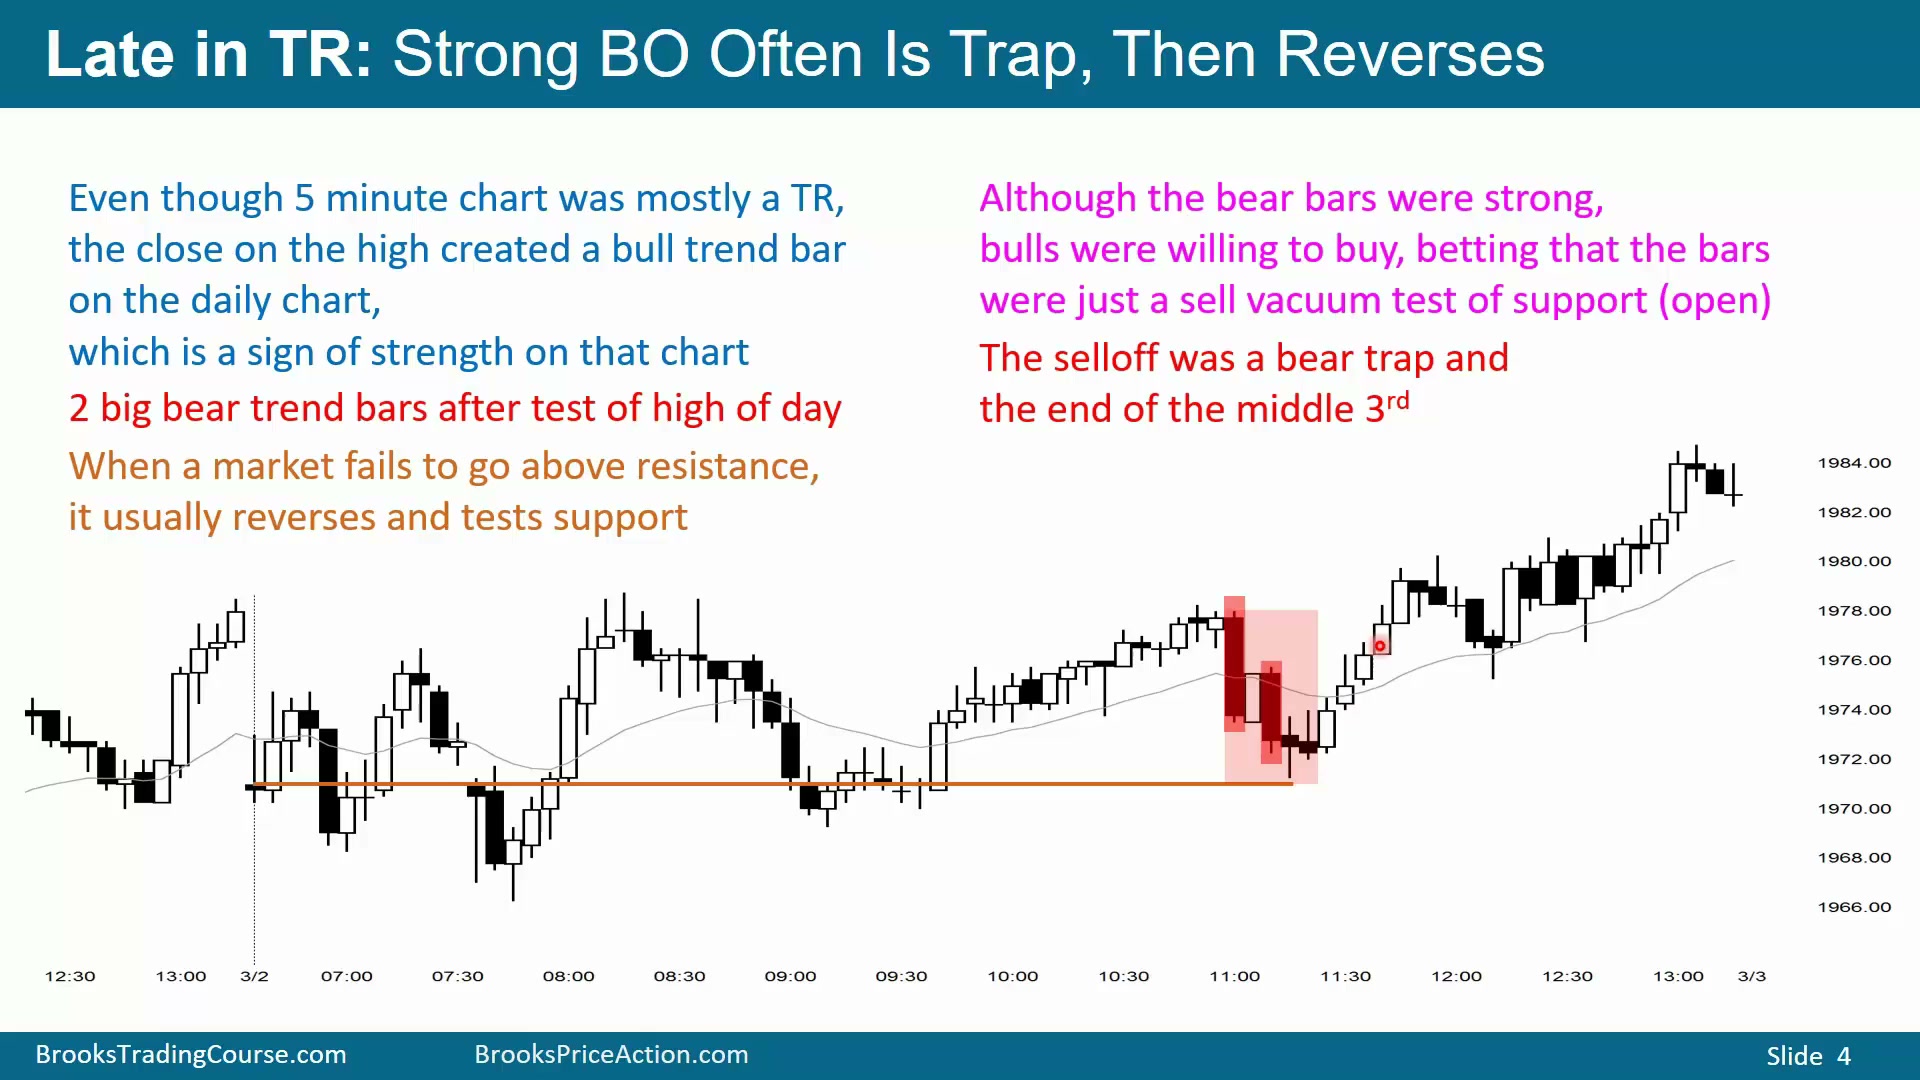
图中市场处在震荡区间日的高位,而开盘价位于全天中段。交易者预期会向下测试开盘价,所以当多头放弃、空头卖出时,出现了两根很大的阴线。它们看起来很强,但后面跟随很差,并且市场从开盘价上方不远处反转上涨。
当市场是小回调上涨趋势但迟迟无法突破当天高点时,即使价格只是略微高过高点,交易者也必须记住:开盘价仍是磁力,全天整体仍更像震荡区间日。多头最终经常放弃,导致大阴线出现。但这些大阴线也可能只是卖出真空,把价格快速拉向支撑,随后多头在支撑处重新买入。
图中多头甚至没有等到价格触及开盘价,而是在开盘价上方两三个 tick 就开始挂限价买单。下跌过程中无法事先知道这一点;但一旦价格从开盘价上方快速反转,就能看出多头买入非常积极。他们相信市场可能到不了开盘价或跌破开盘价,因此提前买入。结果,两根大阴线只是测试支撑的卖出真空,支撑守住后,空头放弃,多头重新控制。
这段下跌结束了中段。只有在反转上涨发生后,交易者才知道中段已经结束;到第三第四根反转阳线时,市场重新 Always In Long,说明尾盘正在尝试形成上涨趋势。空头曾试图让最后一段从大阴线开始并转为下降趋势,但失败了,最终尾盘段从反转上涨处开始。
支撑上方双底后的尾盘做多方式
Time: 07:45
一旦从开盘价附近强力反弹,交易者会判断市场可能收在开盘价上方,并在尾盘形成上涨趋势。趋势大小未知,但方向预期已经改变。一些多头会在开盘价或略高于开盘价挂限价买单,押注即使价格跌破,也只会跌破一两个 tick,并可能形成双底。尤其前面已经出现强反转,回测时形成双底的概率更高;图中后面确实形成了与前低相关的较高低点双底。
不同交易者有不同买法。有人看到反转上涨后买入;有人等三四根阳线后市价买入或买收盘;也有人切到 1 分钟、2 分钟或 3 分钟图,在小级别反转上涨时买入。用限价单在支撑附近买入的人,止损可以放在最近低点下方,押注如果尾盘真要上涨,就不应跌破该低点。更宽松的交易者会把止损放在最初多头反转低点下方,因为价格有时会略破较近低点后再涨。若紧止损被打,价格又反转上涨,交易者可以重新买入。
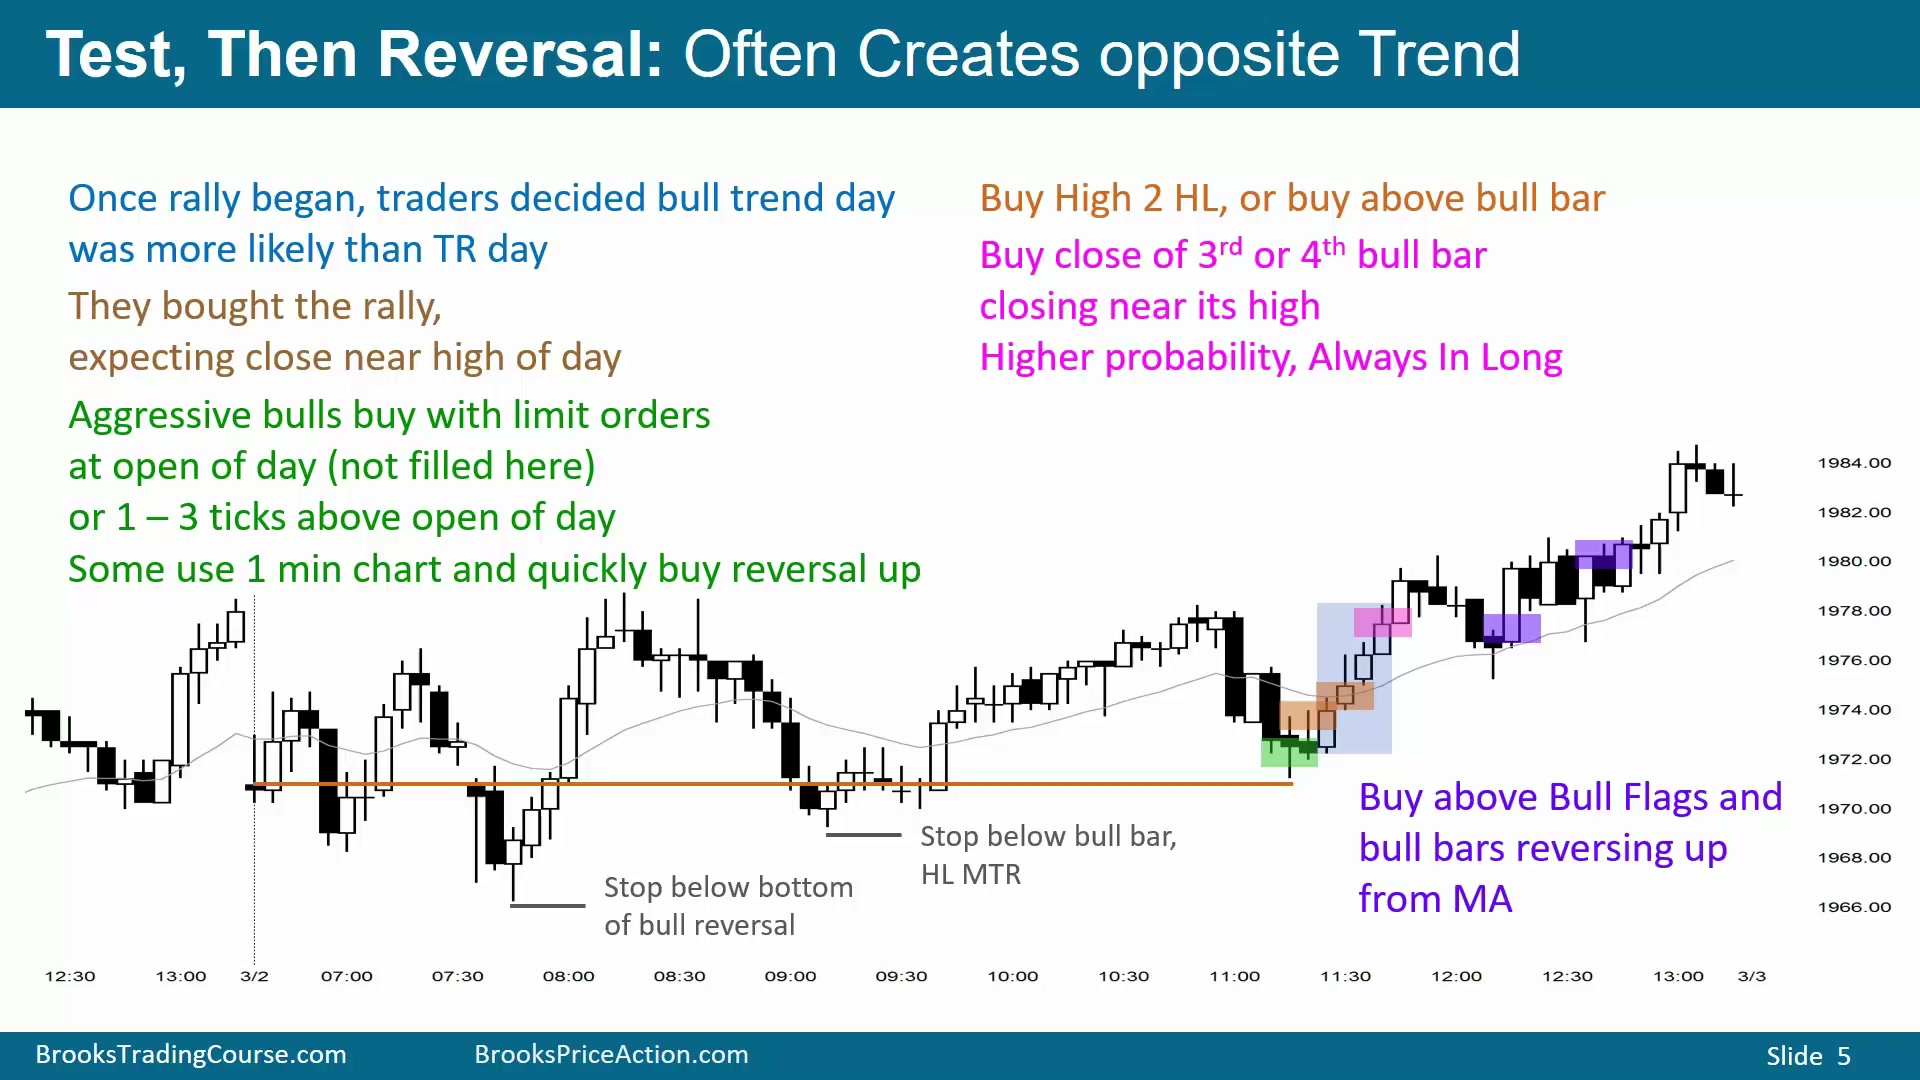
后面出现 High 2 牛旗:两段下跌,一、反弹、二。第一段反弹上方是 High 1,但信号前面有大阴线,多数多头不愿买;开盘价磁力仍在下方,大阴线也常有第二段小下跌。第二段后形成 High 2 买入信号,虽然信号 K 线是阴线、不理想,但位置好。偏好阳线信号的人会等后面的阳线高点上方买入;偏好买收盘的人会等三四根阳线收在高点附近,确认多头至少控制了 15 到 20 分钟。还有交易者会等强反转后的回调:这里约为上涨的 50% 回调,又测试 EMA20,并且两段小下跌,是在 Always In Long 状态下测试支撑的买点。
最终牛旗、整数位与回到开盘价
Time: 11:10
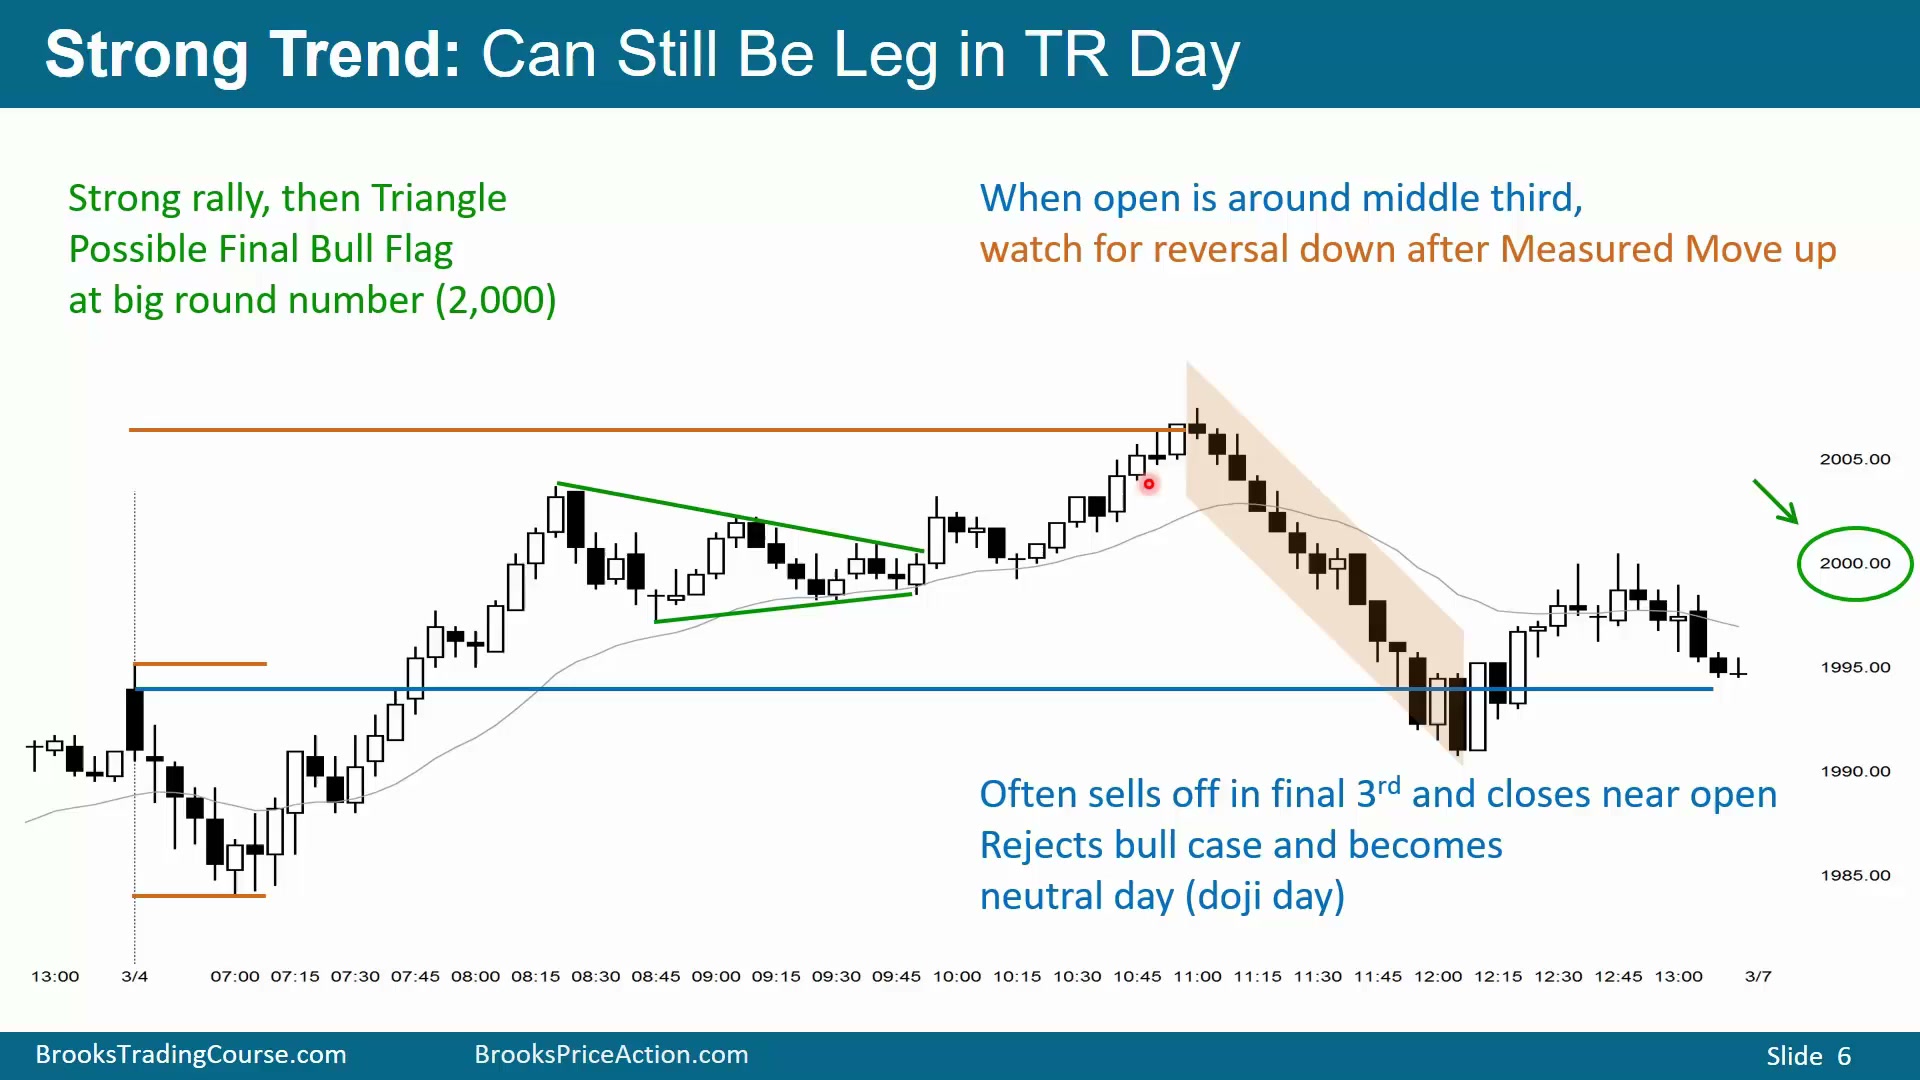
图中先是非常强的上涨趋势,K 线重叠很少,随后进入三角形。三角形中的阳线会吸引多头在其高点上方买入,寻找上涨趋势恢复:上涨趋势、震荡区间、再向上恢复趋势。也有人在突破后的回调、十字星上方或后面阳线上方买入。
但上涨趋势后期出现三角形,经常是最终牛旗。如果三角形向上强突破失败,市场会尝试回到三角形顶点。图中还有一个额外磁力:2000 这样的大整数位。价格在其上方时,若开始下跌,整数位会吸引价格回落;价格在其下方时,若开始上涨,整数位会吸引价格上行。
图中还可以用 measured move 理解高点。市场从开盘先下跌再上涨,日内高点大约位于以早盘下跌高度测算的向上 measured move 附近。如果价格突破这个目标,交易者还会看以低点到高点为基础的另一个 measured move。理论上,市场回到高点时,空头会尝试形成双顶并跌破颈线;如果价格反而突破高点,交易者会认为双顶失败,从而寻找向上 measured move。
当市场已经强力上涨、开盘价位于全天中段且是磁力,又出现趋势后期三角形、潜在最终牛旗和下方整数位时,交易者会寻找反转下跌的卖点。市场一旦下跌,说明尾盘段可能已经从高位开始。若交易者在阴线下方做空,目标可以是三角形顶点、整数位,甚至一路回到当天开盘价。
小风险做空与高概率做空的取舍
Time: 13:45
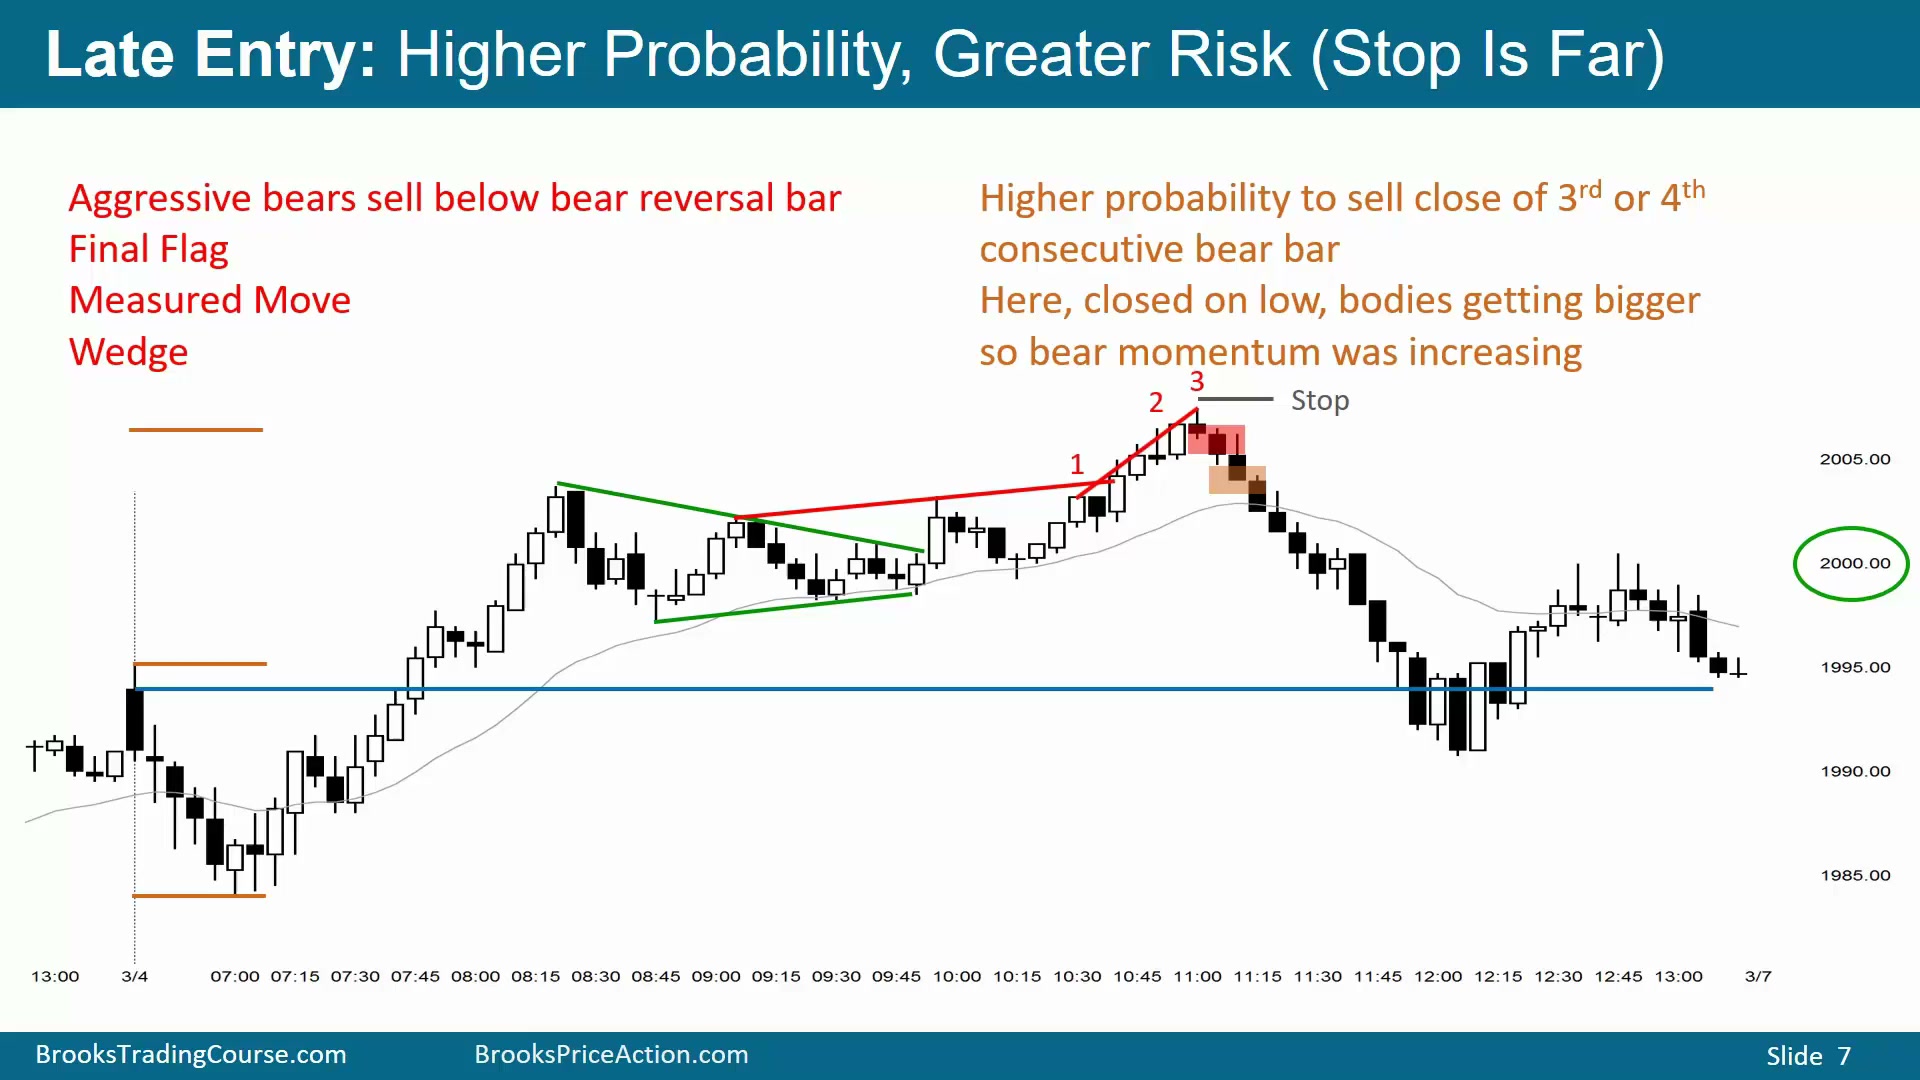
图中尾盘下跌最终把价格带回当天开盘价。虽然当天大部分时间像上涨趋势,但尾盘测试开盘价后,日 K 变成接近开盘价收盘的十字星,下方有下影线,上方也有从收盘到当天高点形成的上影线。
高位反转可以被多种程序识别为楔形或抛物线楔形:先上涨后阴线是第一腿,再上涨后十字星是第二腿,再上涨后反转是第三腿。它也可以看作最终旗形反转,且有一根不错的做空信号 K 线。交易者可以在信号 K 线低点下方做空,甚至用紧止损放在信号 K 线高点上方 1 个 tick,目标是回测当天开盘价。做空理由包括:价格接近 measured move,上方趋势后期有最终旗形,下方有大整数位和开盘价磁力。
但小风险通常意味着低概率。有些交易者不喜欢在第一根信号 K 线下方卖,因为虽然止损近,但反转确认不足。他们会等三四根阴线,尤其其中一两根收在低点附近,再卖收盘。卖收盘可以在该 K 线收盘前一秒下单,或市价卖出并在下一根开盘成交。这样概率更高,但止损更远、风险更大。高概率交易通常要用更差的风险收益比作为代价。
下方磁力强时可以宽止损加仓
Time: 15:55
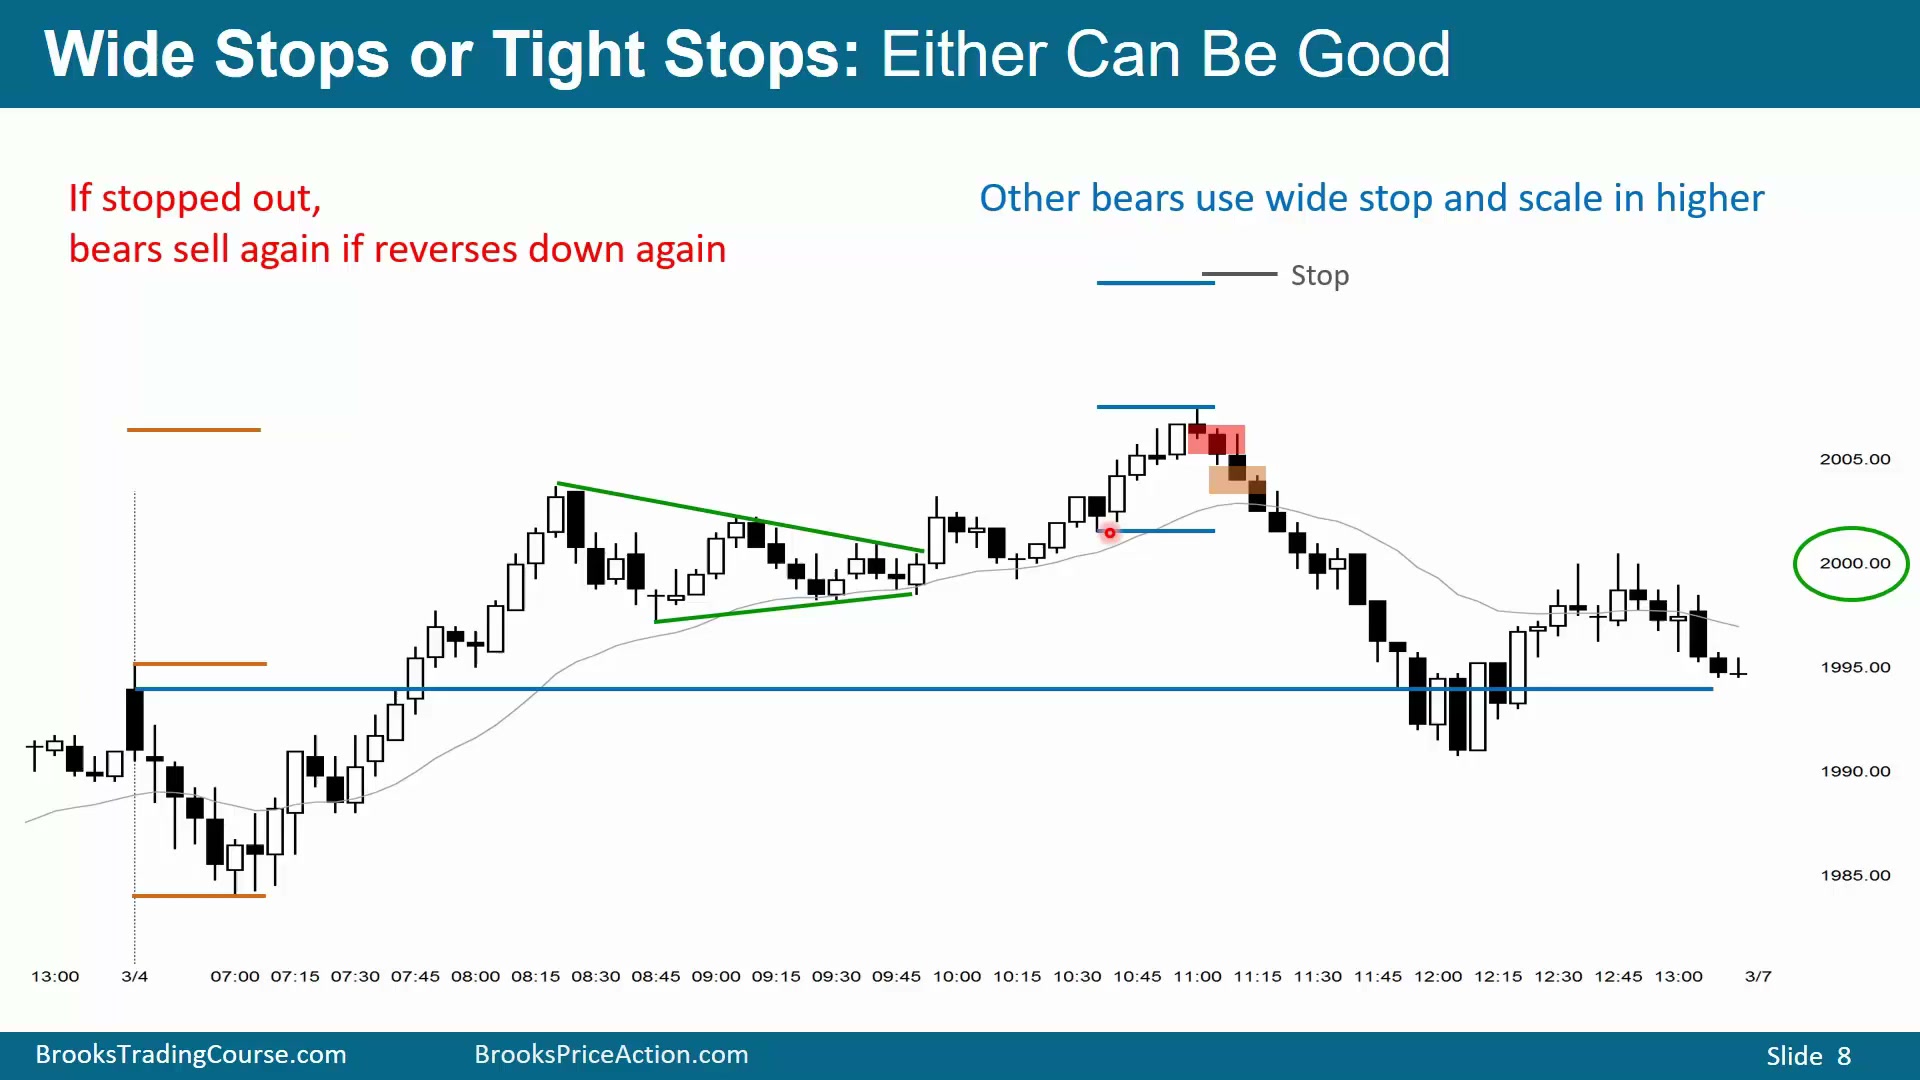
如果交易者在第一处做空后,市场反弹打掉紧止损,随后又第二次反转下跌,他会再次卖出。也有交易者因为下方磁力很多,对回测下方更有信心:当天开盘价、三角形顶点、大整数位,再加上价格处在 measured move 目标附近,都支持下跌测试。
这类交易者可能不使用很紧的止损,而是用更宽止损,例如根据最后一段上涨的 measured move 目标来设置。如果市场继续向上,他们会在更高位置加仓;止损则放在 measured move 目标上方一点。这样的做法承认第一处反转未必马上成功,但利用下方磁力和高位目标区,押注最终仍会向下测试。
80%规则说明市场抗拒改变
Time: 16:40
80% 规则的含义是市场倾向于延续当前状态。趋势中的反转尝试,大约 80% 会失败;震荡区间中的突破尝试,大约 80% 会失败。
因此,交易者首先要判断市场当前是什么状态。如果是趋势,不要过早押注反转;如果是震荡区间,不要轻易相信每一次突破。这个规则不是机械数字,而是提醒交易者:市场通常抗拒改变,除非价格行为已经清楚证明环境发生转换。
趋势中反转多半失败但支撑会带来反弹
Time: 16:54
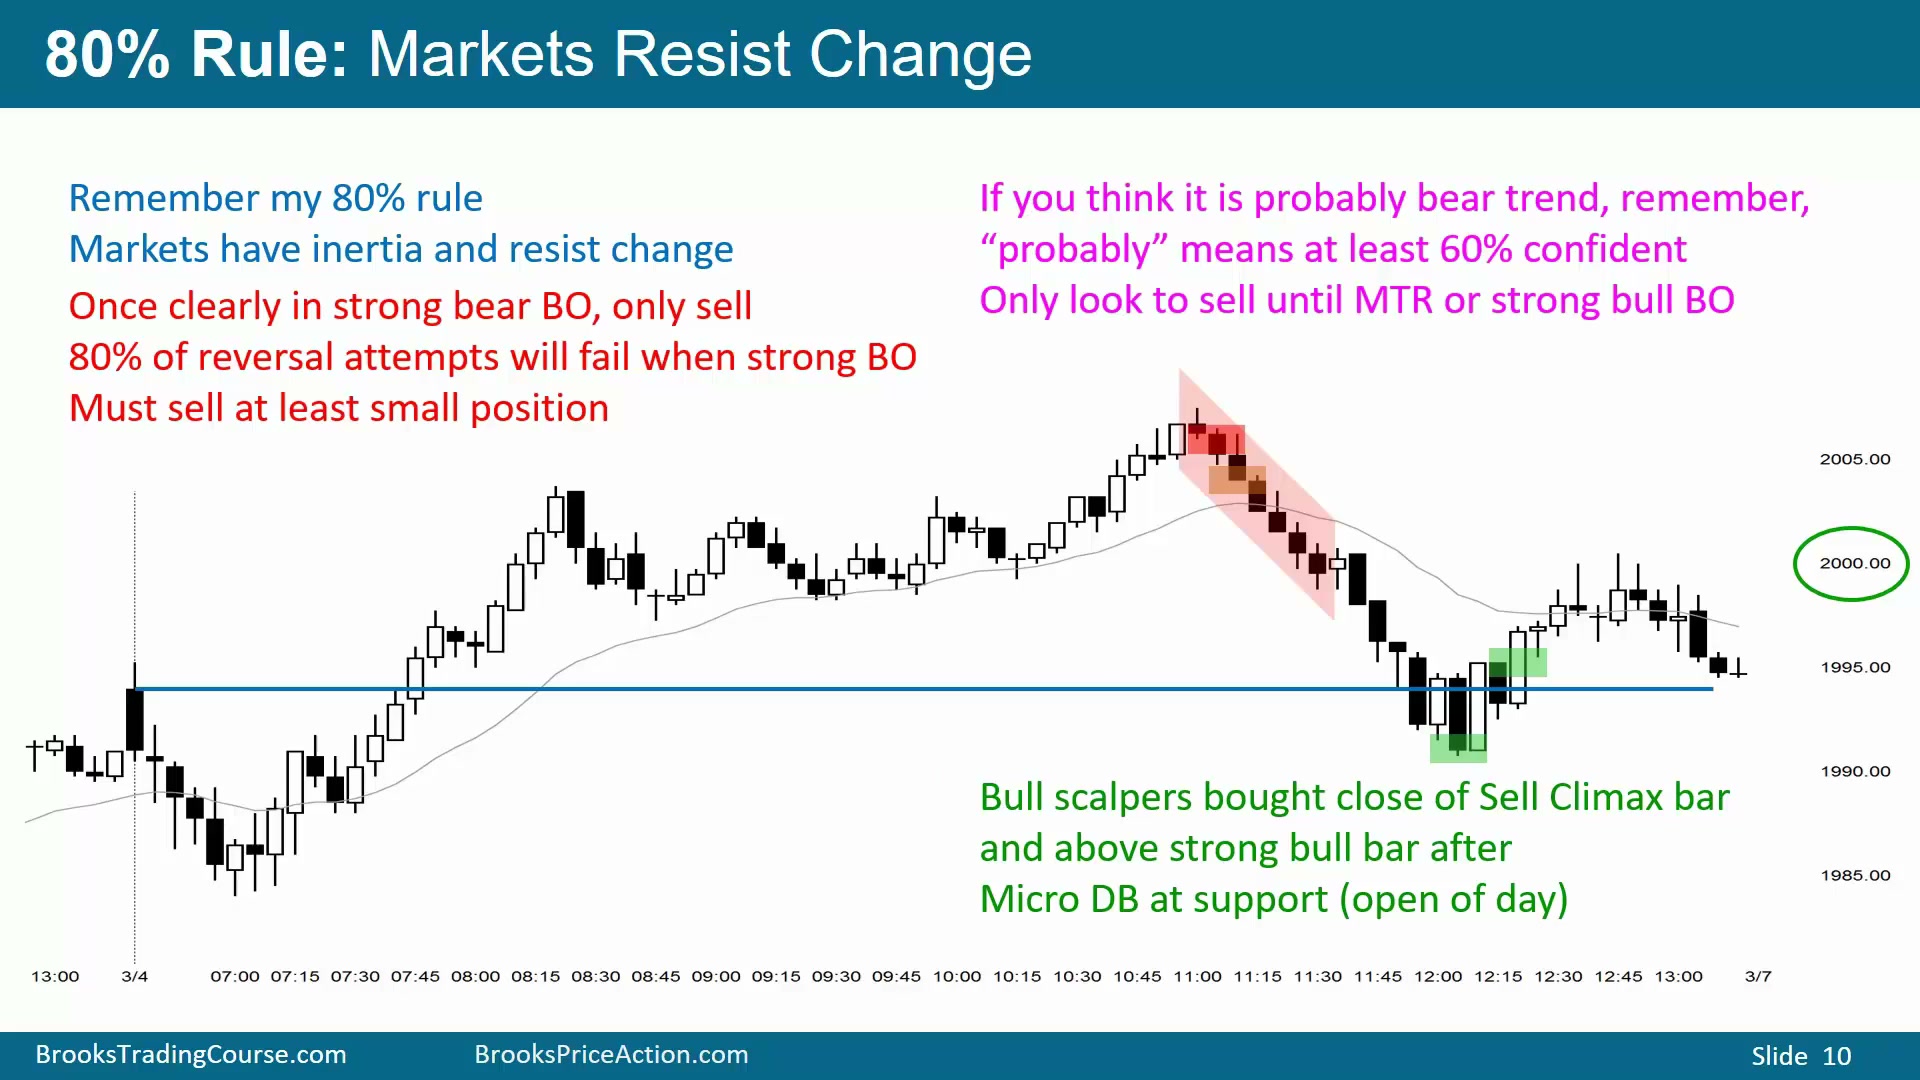
市场抗拒改变,会继续做它已经在做的事。清楚上涨趋势中,大多数反转会失败;清楚下降趋势中,大多数向上反转也会失败。因此一旦交易者认为市场 Always In Short,就至少应卖出一小部分。能说“市场大概率下跌”,就意味着至少有约 60% 把握价格还会再低一点;在这种情况下,应继续寻找卖出,直到出现某种向上反转或强多头突破。
但趋势中的支撑仍可能带来反弹。图中虽然有强抛售,但当天开盘价位于中段,是重要支撑。空头在支撑附近会获利了结;多头看到一根不错阳线后,会考虑开盘价是否会支撑市场并引发反弹。
图中形成小双底。虽然未特别标出,但此前有一根较大的阴线跌破紧通道,是高潮行为,会增加反弹概率。随后两根好阳线收在高点附近,许多多头会在小双底上方买入,目标可能是回到当天高点。由于前面紧通道中阴线很多,回到高点的概率不高,但至少足以反弹一段供剥头皮。
另一些交易者会从信号 K 线质量判断。阳线本身也可以看作下降趋势中的回调,但它位于支撑处,而前一根大阴线是约十五根 K 线中最大的阴线,属于抛售高潮;因此把这根阳线低点下方当作做空信号并不好。更多交易者会在阳线低点用限价单买入,而不是卖出。
较高低点大反转的概率与入场代价
Time: 19:14
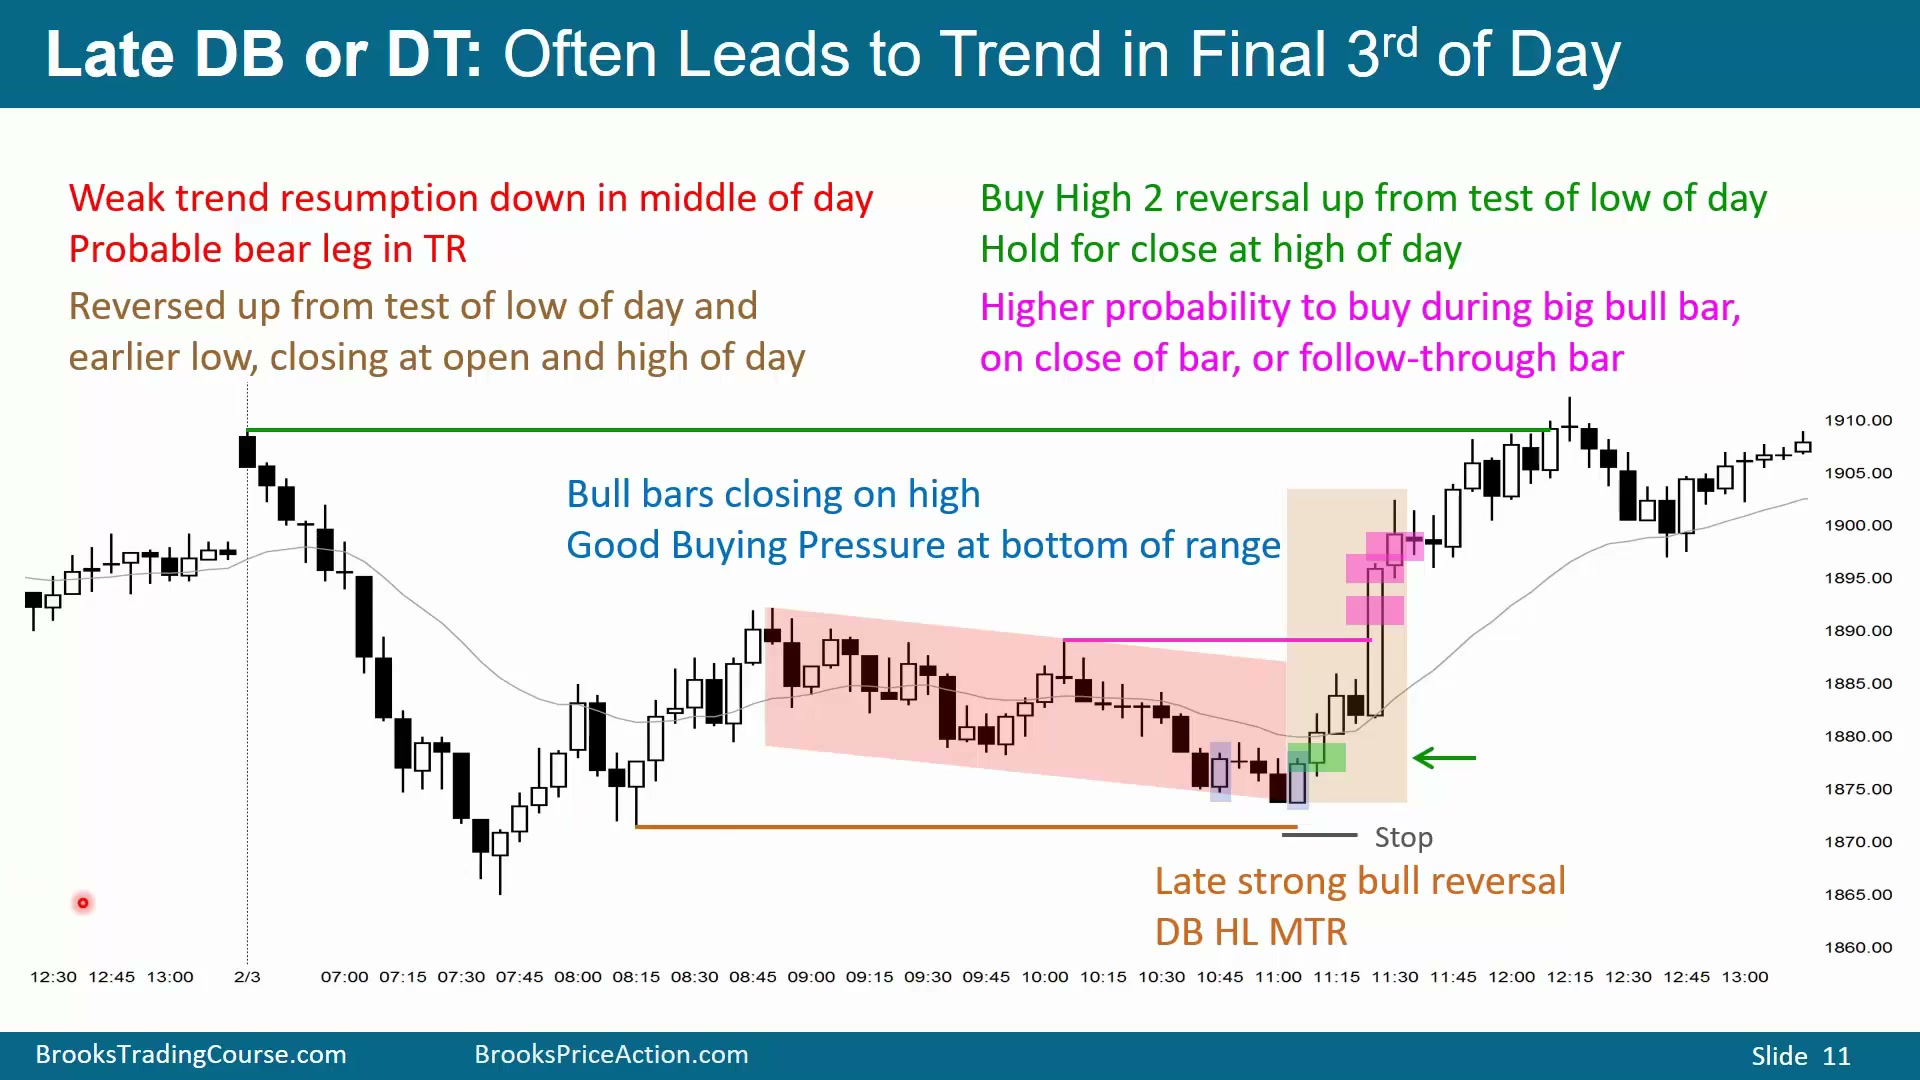
图中空头先有强抛售,随后反弹约 50%,并出现均线缺口 K 线。空头预期下降趋势恢复,但恢复下跌的表现令人失望:阴线不大、下影线明显、跟随差,连续阴线虽有但实体偏小。这更像未来震荡区间中的空头腿,而不是新的强下降趋势。
随后市场尝试反转上涨。这个结构可以叫楔形牛旗:三推下跌,一、反弹、二、反弹、三;也可以叫小双底、双底较高低点大反转,或者简单称为较高低点大反转。结构是空头趋势、向上突破、较高低点,位置在发展中区间底部,且有不错买入信号 K 线和小双底,因此买入合理。
一旦价格开始上涨,交易者会判断中段可能结束,市场正在尝试尾盘上涨趋势。它测试的是当天低点附近,更重要的是测试前面的较高低点,形成双底较高低点大反转,并有不错多头 K 线。大反转买入通常很难达到 60% 概率,但这个结构接近 50% 可以测试区间顶部,因此属于不错买点。若想要更高概率,可以等三根连续阳线,或者等向上突破和跟随 K 线。
早入场时,可以把止损放在最近低点下方,甚至放在更早的小双底低点下方,因为市场常会回测那个低点,可能刚好到达、略高或略低。若已经出现一两根阳线,重新跌破该低点的概率下降,紧止损也可以接受。等强突破出现后,交易者可以买正在形成的突破、买收盘,或买跟随 K 线收盘;但止损至少要放在突破前低点下方,甚至更远。概率提高的代价,是风险收益比变差。
中段测试后的尾盘趋势与80%规则
Time: 22:50
中段市场常会测试支撑或阻力。测试之后,市场要么反转,要么继续;随后的方向往往成为交易日最后一段,也就是尾盘的趋势段。
同时,80% 规则始终适用。市场大多数时候会继续做它已经在做的事:趋势中的反转多数失败,震荡区间中的突破多数失败。交易者要把支撑阻力测试、当前市场状态和失败概率放在一起判断,而不是孤立地交易某一根信号 K 线。