al-brooks-course
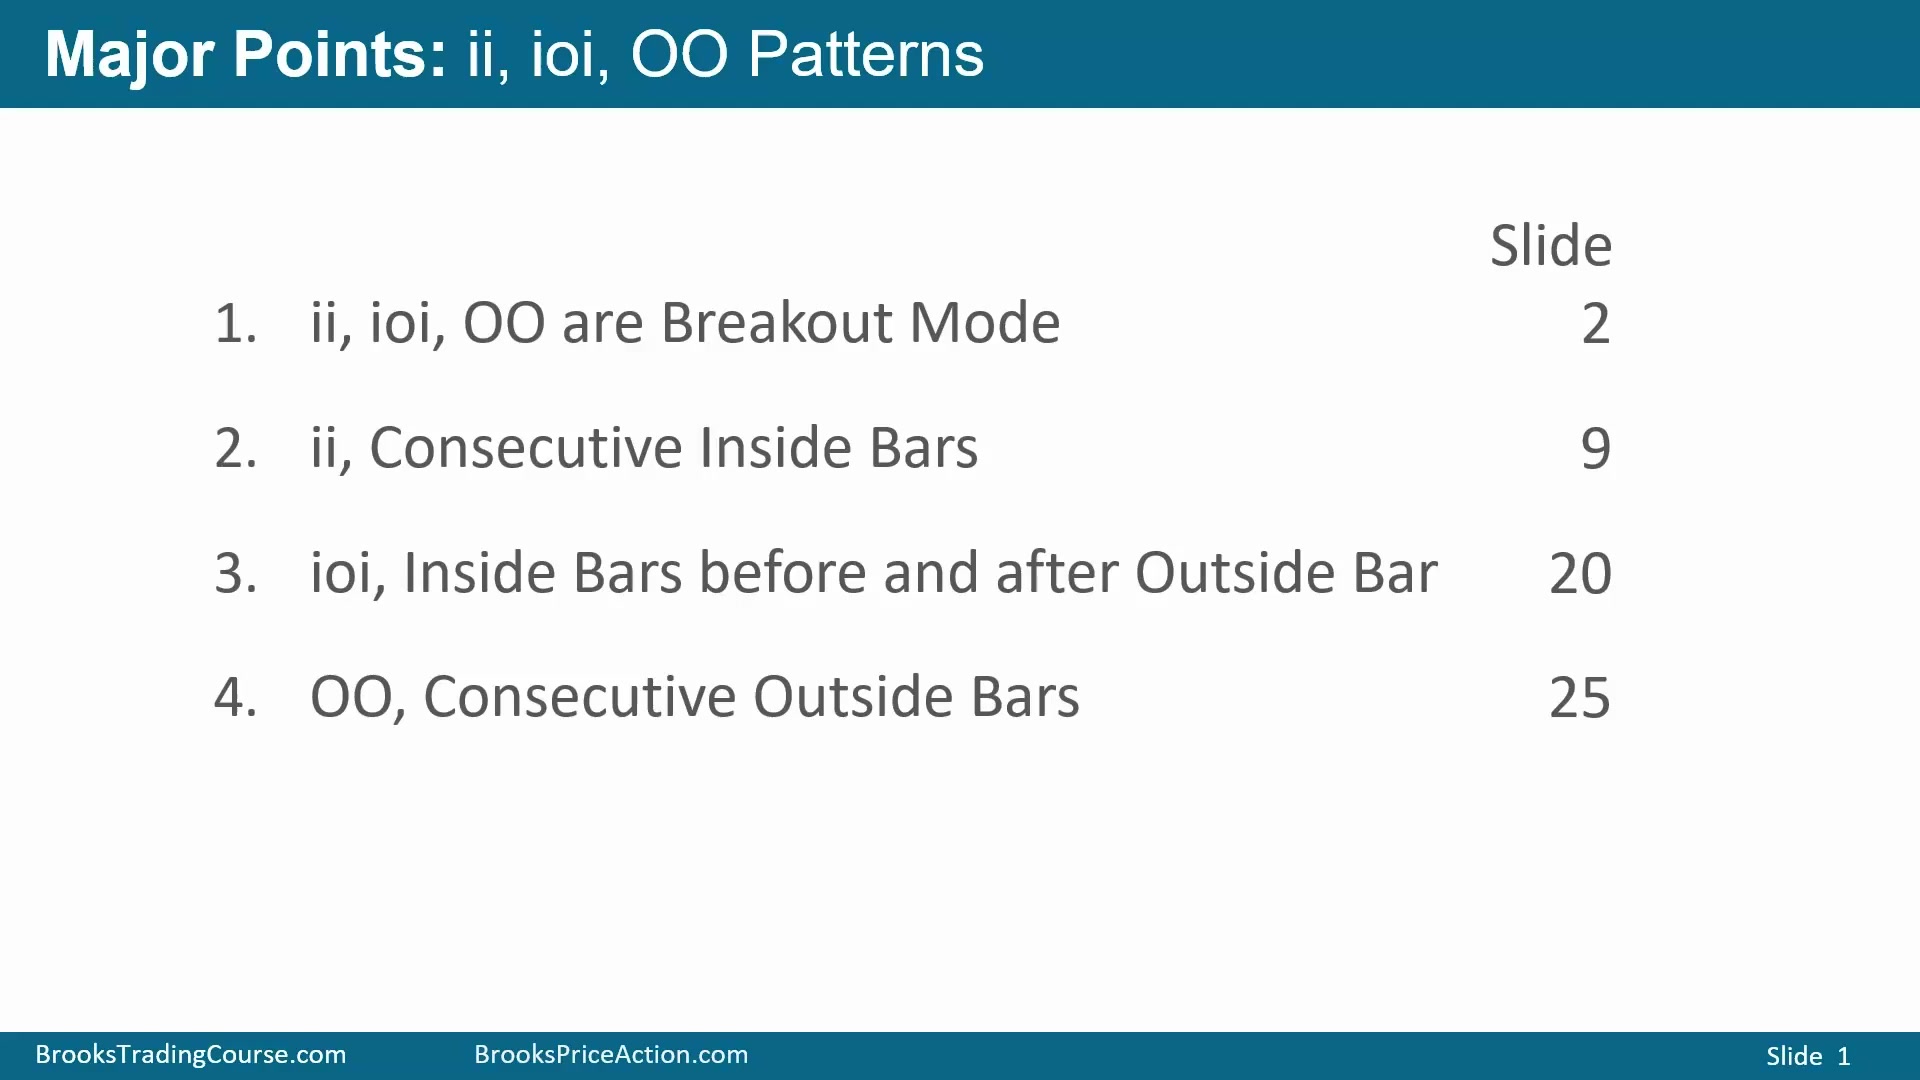
15 - ii, ioi, OO Patterns- Definitions
Readable self-study lecture notes for 15 - ii, ioi, OO Patterns- Definitions.
Source Media
ii、ioi、OO都是BreakOut Mode
Time: 00:22
ii、ioi 和 OO 都是常见的小型横盘模式,也都是 BreakOut Mode。它们的共同点是价格短暂进入 sideways 状态,交易者等待突破方向,用 stop 在上方买入或在下方卖出。如果先向一个方向突破后失败并反向突破,理论上可以先做一个方向,再反手做另一个方向。
ii 是 inside-inside,也就是连续 Inside Bar。Inside Bar 的高点在前一根 K 线高点之下或相等,低点在前一根 K 线低点之上或相等。ioi 是 inside-outside-inside:中间是一根 Outside Bar,而 Outside Bar 前一根天然在它范围内,之后又接一根 Inside Bar。OO 是 consecutive Outside Bars,即连续 Outside Bar。Outside Bar 的高点高于或等于前一根高点,低点低于或等于前一根低点。
这些模式之所以值得学,是因为交易者会在突破时尝试抓住趋势起点。它们不是预测方向的标签,而是告诉你:市场暂时压缩或扩张后,正在等待一个可交易的突破。
三种三根K线结构的基本形态
Time: 01:42
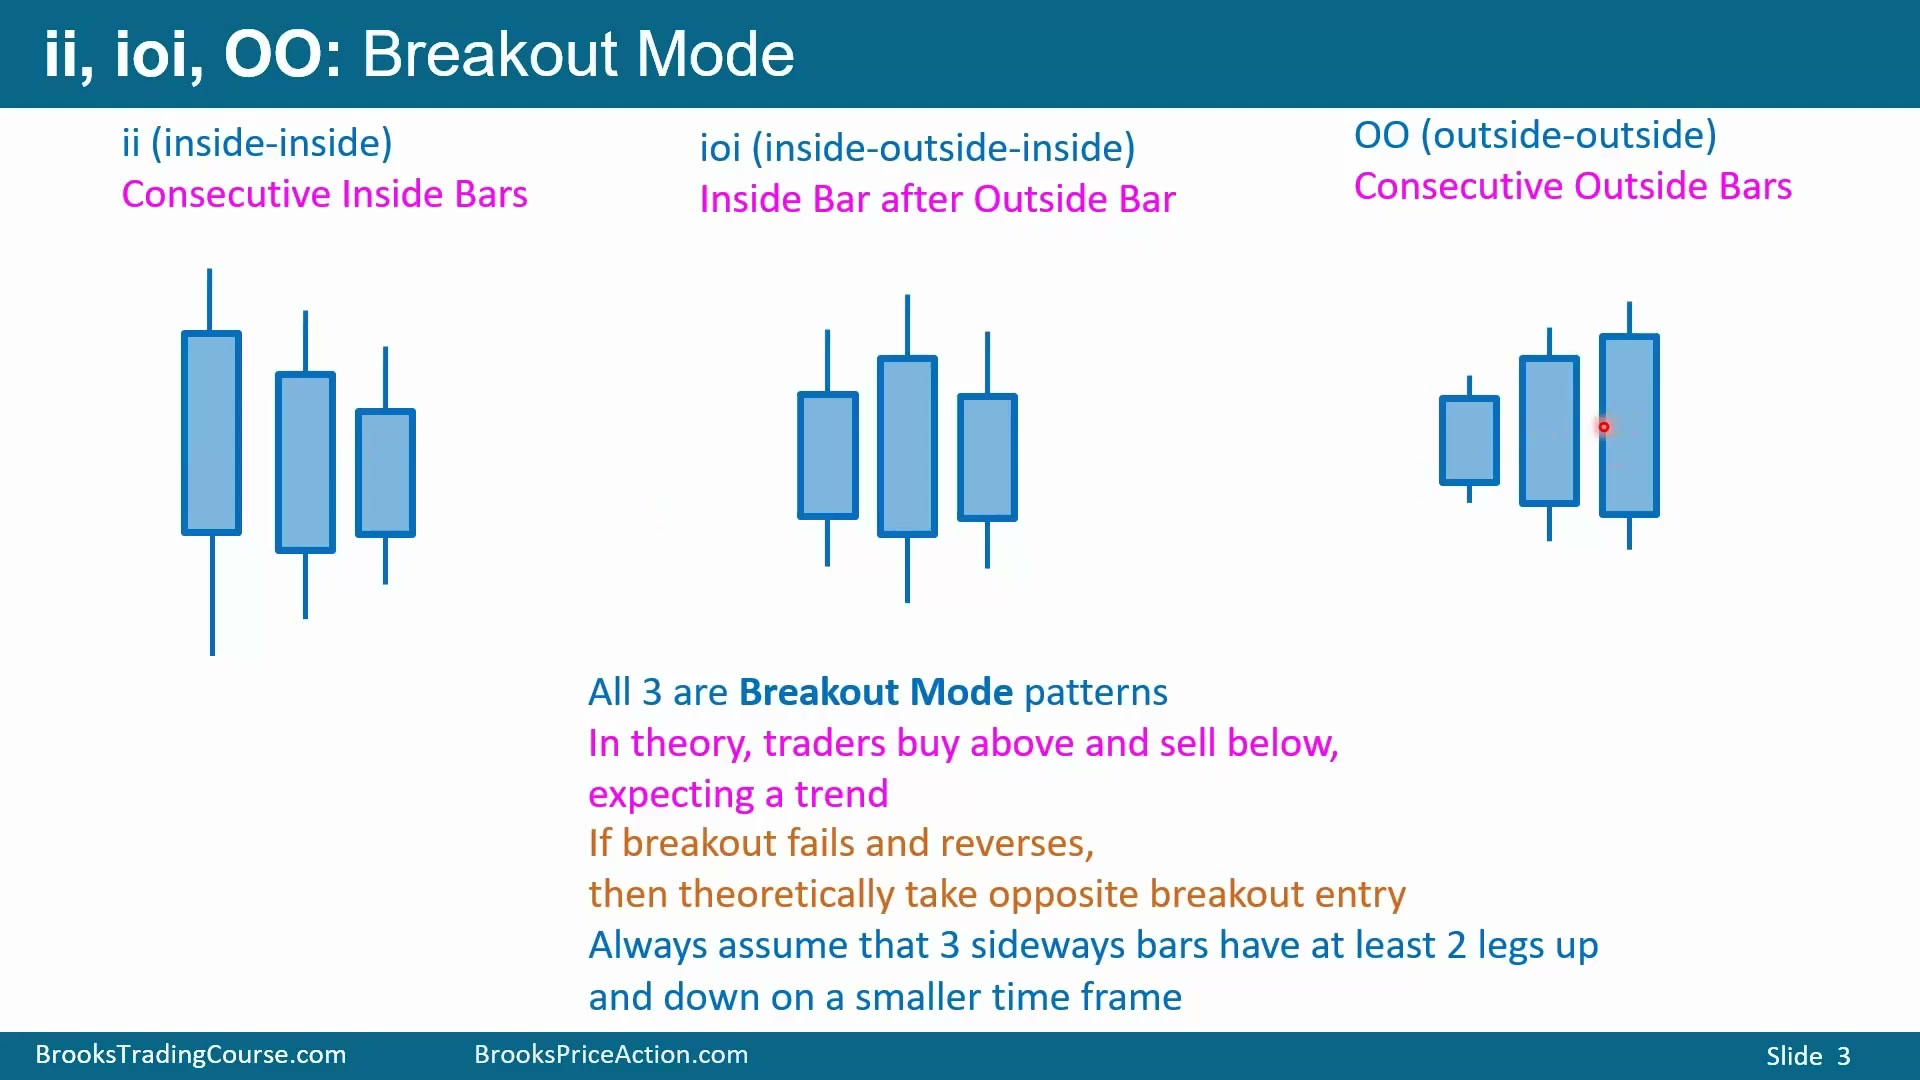
图左侧是 ii:第二根在第一根内部,第三根又在第二根内部,因此是连续 Inside Bar。中间是 ioi:Outside Bar 后面接 Inside Bar;由于 Outside Bar 前一根也在 Outside Bar 内部,所以完整结构是 Inside、Outside、Inside。右侧是 OO:三根 K 线越来越大,后两根都是 Outside Bar,后一根的高点和低点都扩展了前一根范围。
这些结构都属于 BreakOut Mode。理论上,交易者买在模式高点上方,卖在模式低点下方,期待突破发展成趋势。如果突破失败并反向穿越模式另一侧,则可以反手。例如,若在 ii 高点上方买入后市场反转跌破 ii 的低点,交易者可以退出多头并做空。
任何三根横向模式都可以假设在更小周期上至少有两腿向上和两腿向下。ii 通常是小周期 Triangle,OO 通常是小周期 Expanding Triangle。Triangle 有一边三推,另一边两推,本质上同样是 BreakOut Mode。
因此,当前周期上的三根 K 线不是孤立信号,而是更小周期多次尝试后的压缩结果。理解这一点后,交易者就会把突破、失败突破和反手都作为正常计划,而不是把第一次突破当成必然方向。
小风险和可观目标让Trader’s Equation有优势
Time: 03:28
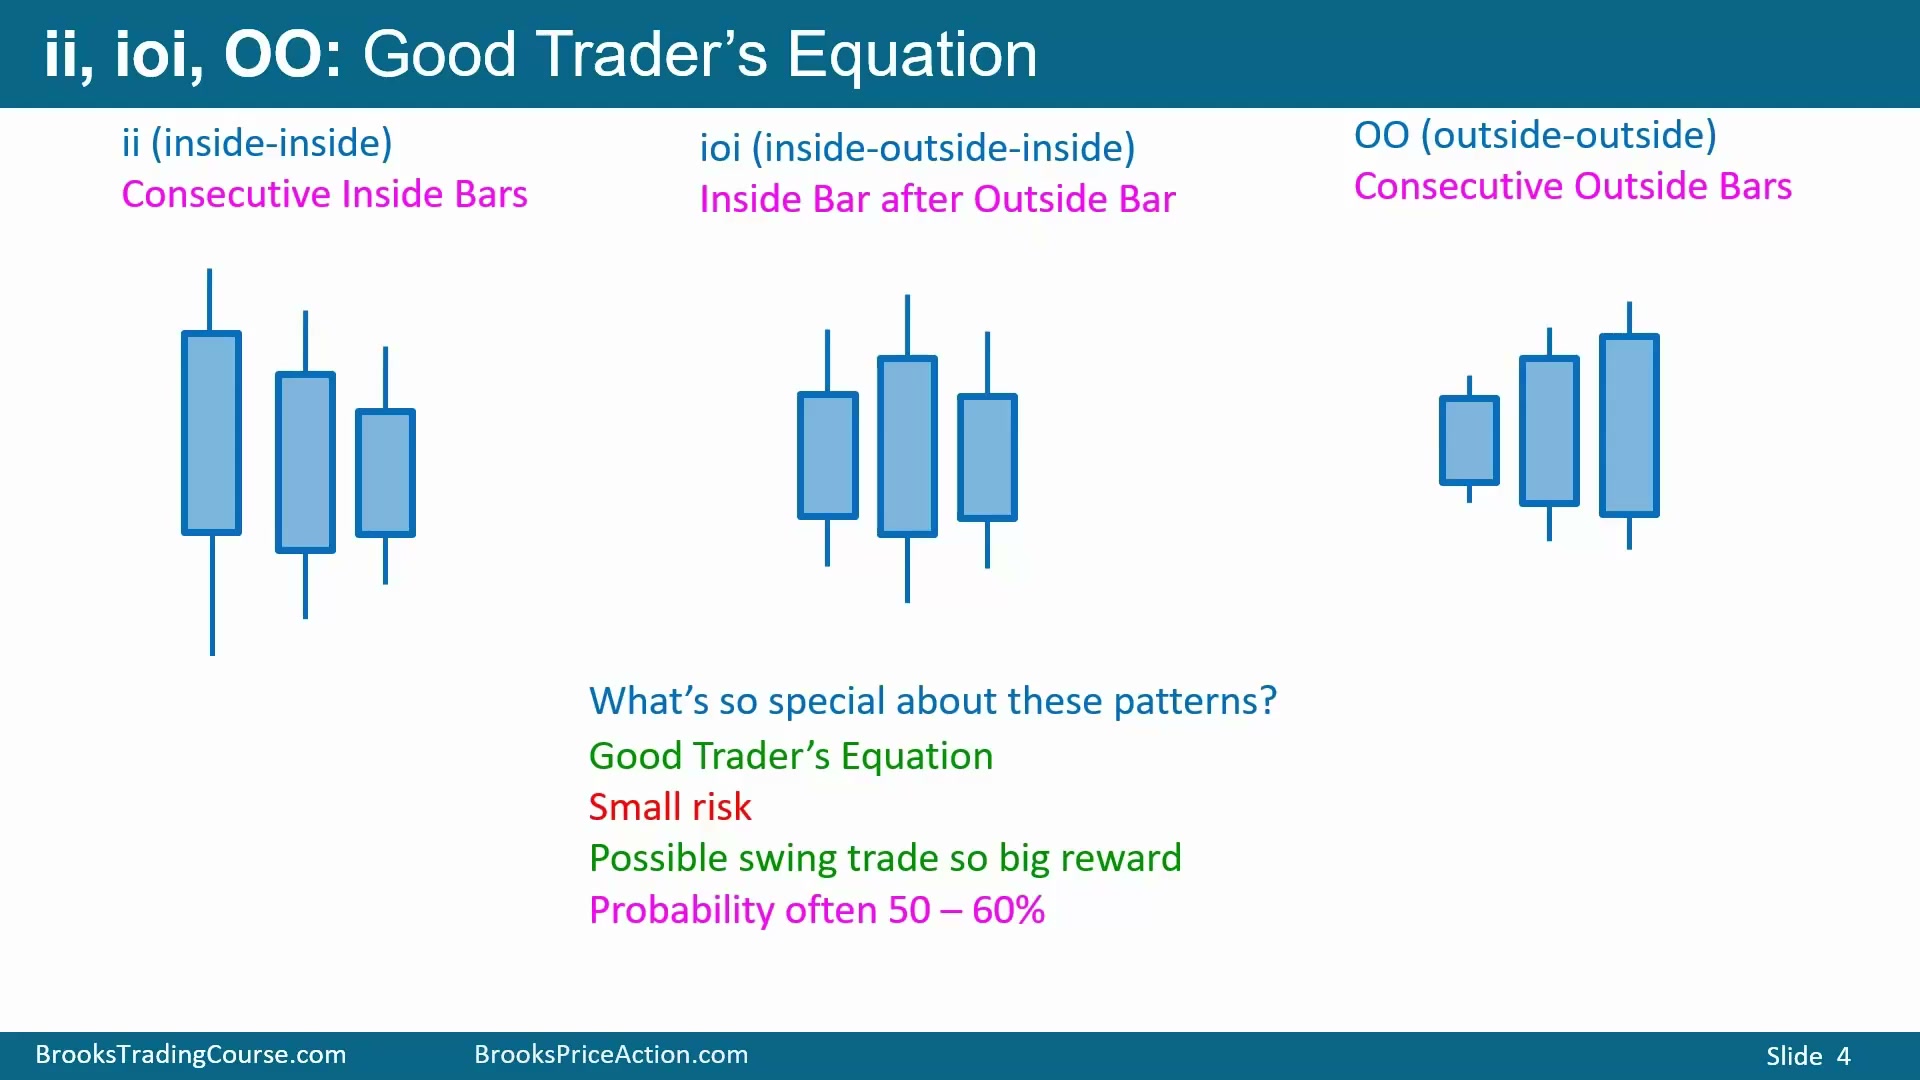
这些模式的优势在于 Trader’s Equation。若在 ii 高点上方买入,把止损放在 ii 低点下方,风险通常很小;如果随后出现 10 到 20 根 K 线的 swing,潜在 reward 会远大于 risk。BreakOut Mode 的第一方向大约有 50% 概率成功,也有约 50% 概率失败并反向突破;如果向下突破,同样约有 50% 概率形成向下 swing。
在更好的背景中,概率可以升到约 60%。例如 Sell Climax 后出现这些模式,第三根是收在高点的牛 K 线,就可能成为很好的买入;Buy Climax 末端、靠近 Double Top 等阻力处,第三根收在低点的熊 K 线,则可能成为较高概率卖出。关键不是模式名称本身,而是背景、信号 K 线质量和突破后的空间。
这些模式小,所以止损通常小;一旦突破后真的形成 swing,利润目标可以远大于风险。交易者不是因为 ii、ioi 或 OO 神秘地预测方向而交易,而是因为它们把市场压缩成一个清楚的突破区间,让 stop 入场、止损位置和失败后反手位置都变得明确。若背景支持,Trader’s Equation 会从“小风险加合理概率”中获得优势。
反转前通常先停止趋势推进
Time: 05:04
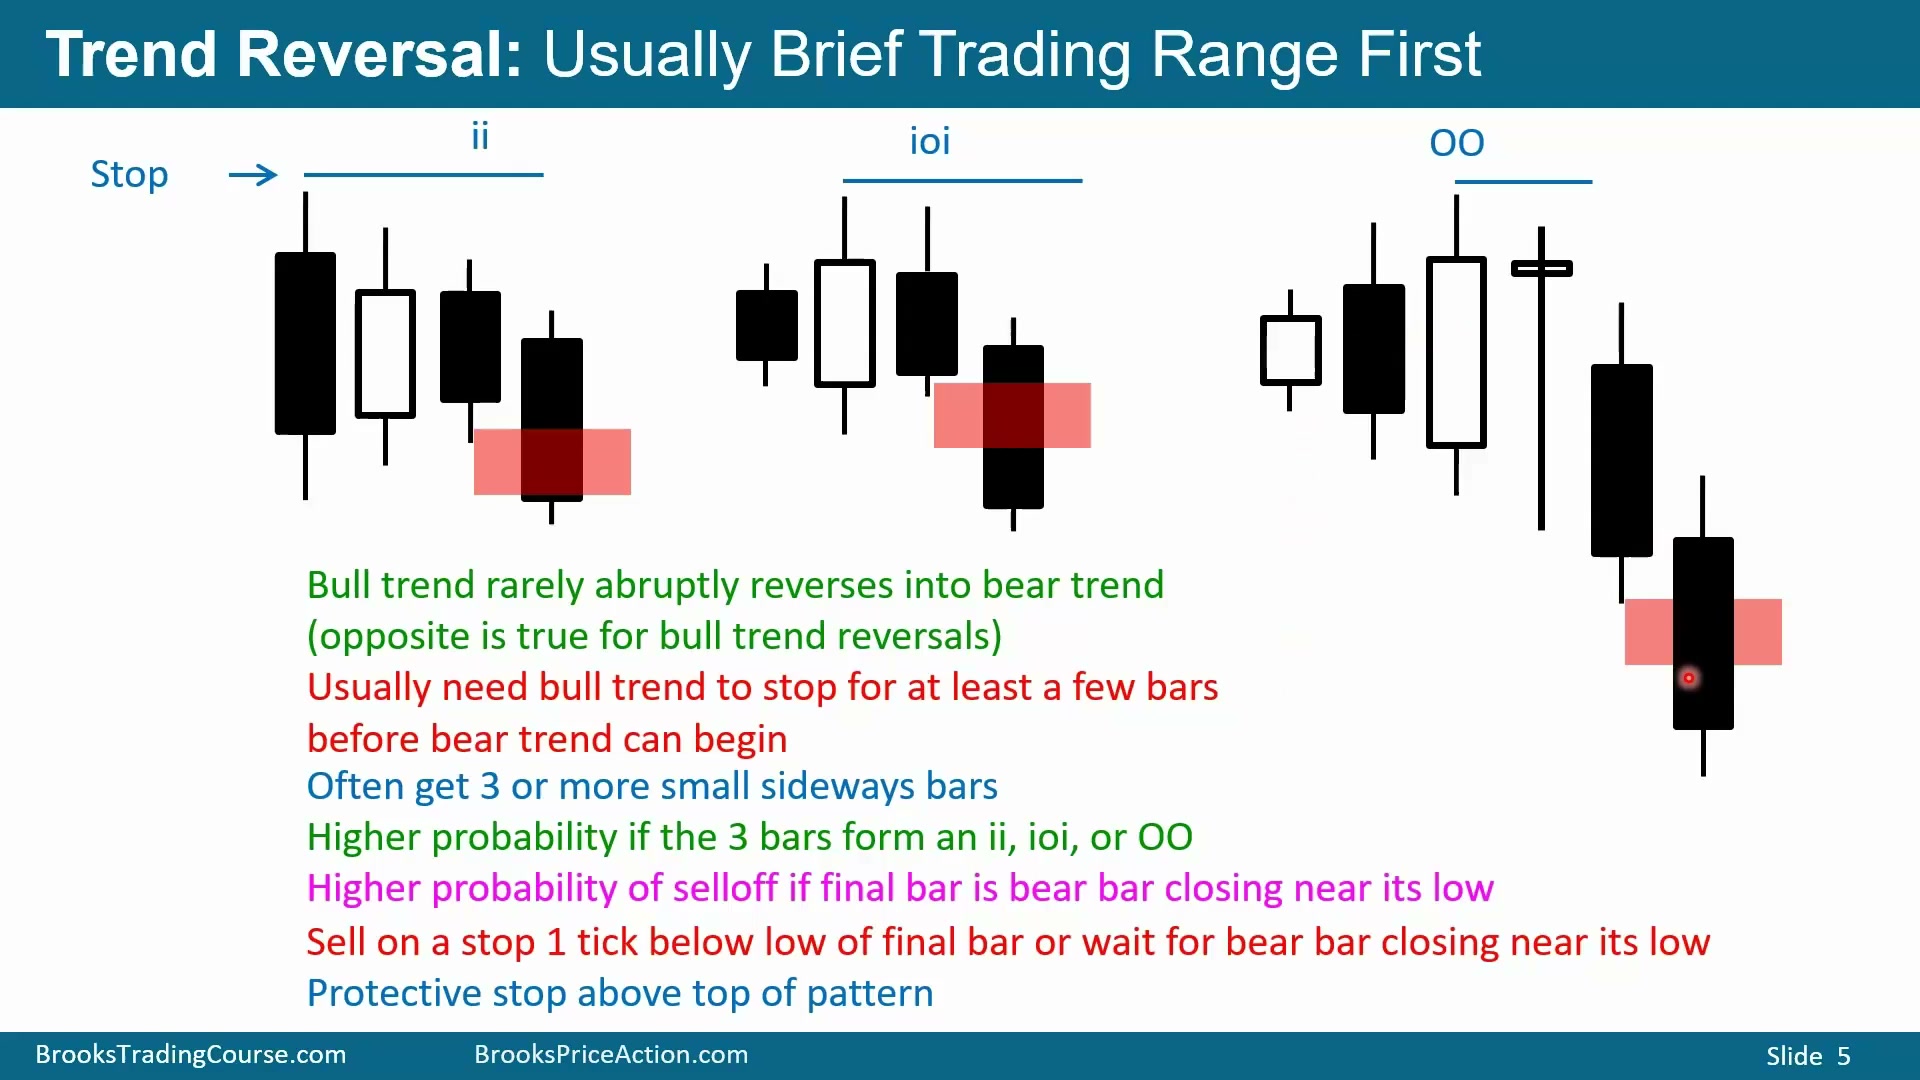
牛趋势很少突然直接变成熊趋势;熊趋势也很少瞬间直接变成牛趋势。通常趋势会先停止推进,横向走几根 K 线,有时就形成 ii、ioi 或 OO。若要在牛趋势末端寻找做空,最好看到收在低点附近的熊 K 线,再在其低点下方 1 tick 或 Forex 中 1 pip 用 stop 卖出。
图中的 ioi 是 Inside、Outside、Inside。若最后一根是强熊 K 线,可以在其低点下方卖出。OO 的情况更复杂:理论上可以卖在第二根 Outside Bar 低点下方,但如果那根是大牛 K 线,直接在大牛 K 线下方卖出概率并不高。更好的做法通常是等待后续出现收在低点附近的熊 K 线,再在其下方卖出。
止损可以放在模式高点上方,也可以放在整个趋势高点上方。如果模式出现在牛趋势末端,趋势高点离模式高点不远,止损稍远但概率更好。
这类反转交易必须先看到趋势失去推进力。若牛趋势仍在连续强牛 K 线中上涨,只因为出现一个小型横盘就卖出,概率通常不够。更好的结构是趋势末端先横向、买方无法继续推高、再出现强熊信号 K 线。熊趋势底部的买入逻辑相同:先停止下跌,再出现能显示买方接管的牛 K 线。
强信号 K 线能减少“过早逆势”的问题。卖出时希望熊 K 线实体清楚、收在低位;买入时希望牛 K 线实体清楚、收在高位。若信号只是 doji 或影线很大,趋势可能只是暂停,而不是反转。
ii向下突破的基础卖出方案
Time: 07:39
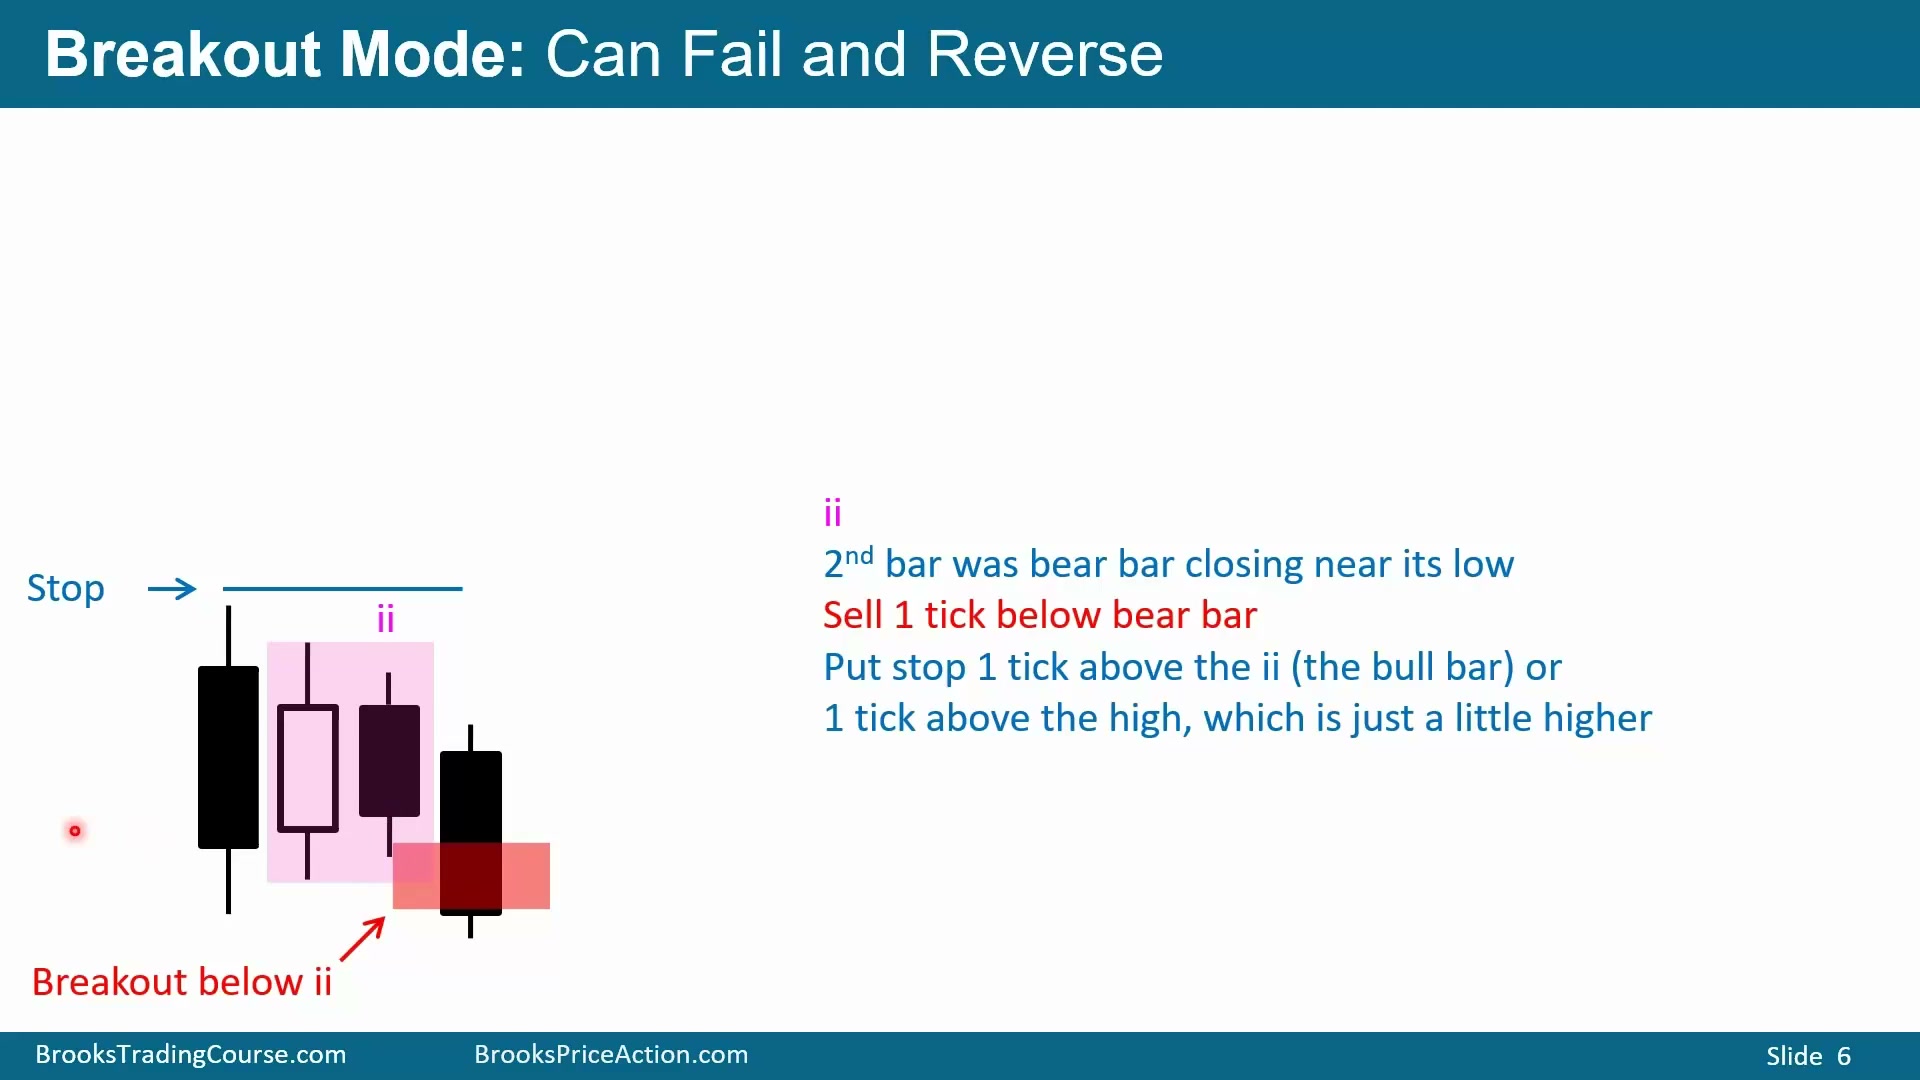
图中的 ii 以收在低点附近的熊 K 线结束,在趋势环境中可以考虑卖在其低点下方。这里假设它出现在牛趋势或熊趋势中,而不是紧密交易区间中;如果市场只是小实体、长影线、横向密集重叠,ii 的 stop 入场可靠性会明显降低。
卖出后,止损可以放在 ii 两根 Inside Bar 中较高的一根上方 1 tick,也可以放在整个上涨段高点上方。后一种止损更远,但如果模式确实是牛趋势末端的反转,概率会更高。
失败的熊突破可以反手买入
Time: 08:30
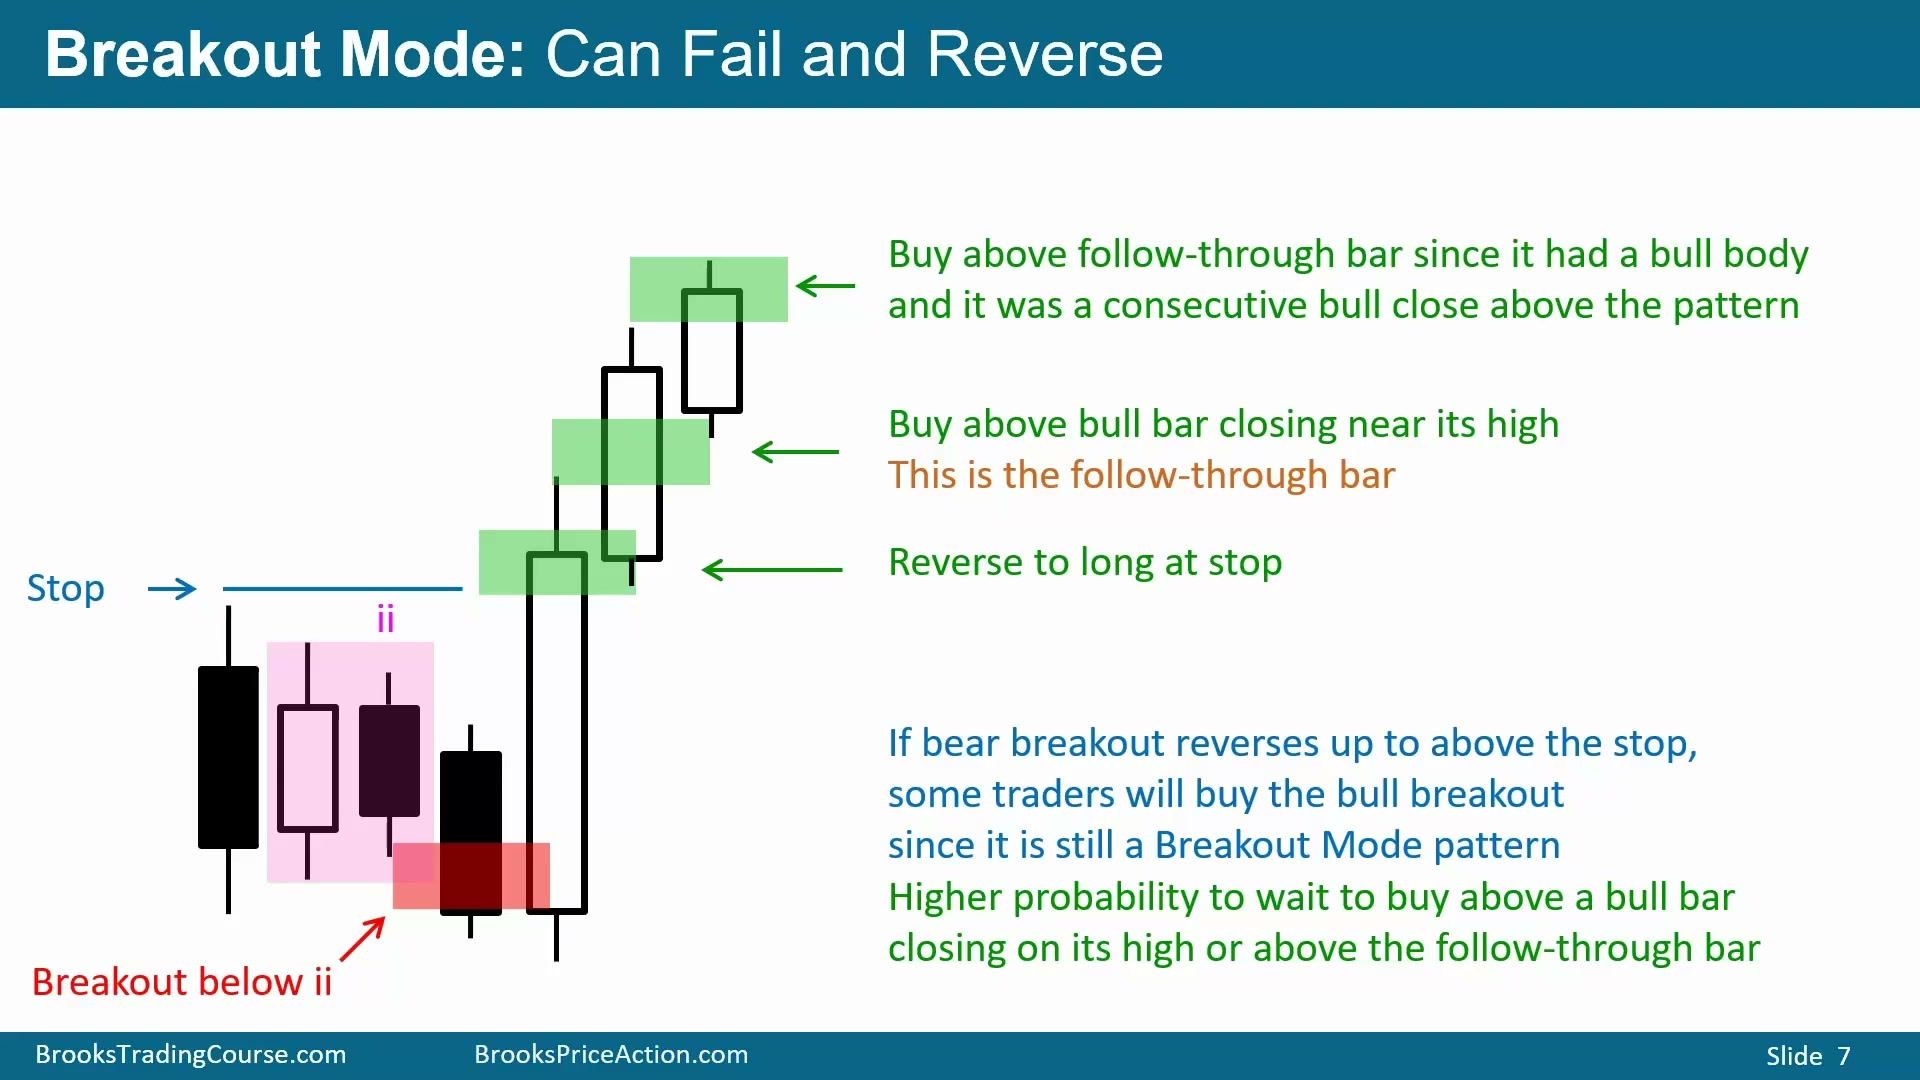
如果 ii 先向下突破,却立刻强势向上反转,空头会被止损打出,并需要考虑反手做多。它仍然是 BreakOut Mode:先是失败熊突破,随后是牛突破。买入可以在大牛 Outside Up bar 高点上方,也可以等后续 follow-through bar 高点上方;若连续两根不错的牛 K 线都收在高点附近,并且都收在模式上方,买入概率更高。
代价是风险回报变差。等待确认会让止损更远,利润空间被吃掉一部分;但更高概率本来就需要付出这个代价。概率越高,风险回报通常越差,这是交易选择中的基本取舍。
如果反手买入,交易者还要意识到空头正在被迫回补。先向下突破的卖家发现突破失败,会在模式上方买回空头;新的多头也会在同一区域进场。两股买盘叠加,才是失败突破后向上 move 可能加速的原因。
反手不要求交易者每次都立刻从空转多。保守者可以先退出空头,等牛 K 线收在高点附近、或等第二根牛 K 线确认后再买。区别只是更早反手有更好价格和更小风险,更晚确认有更高概率但风险更大。
这些模式要在趋势中寻找,而不是在限价单市场中乱做
Time: 10:20
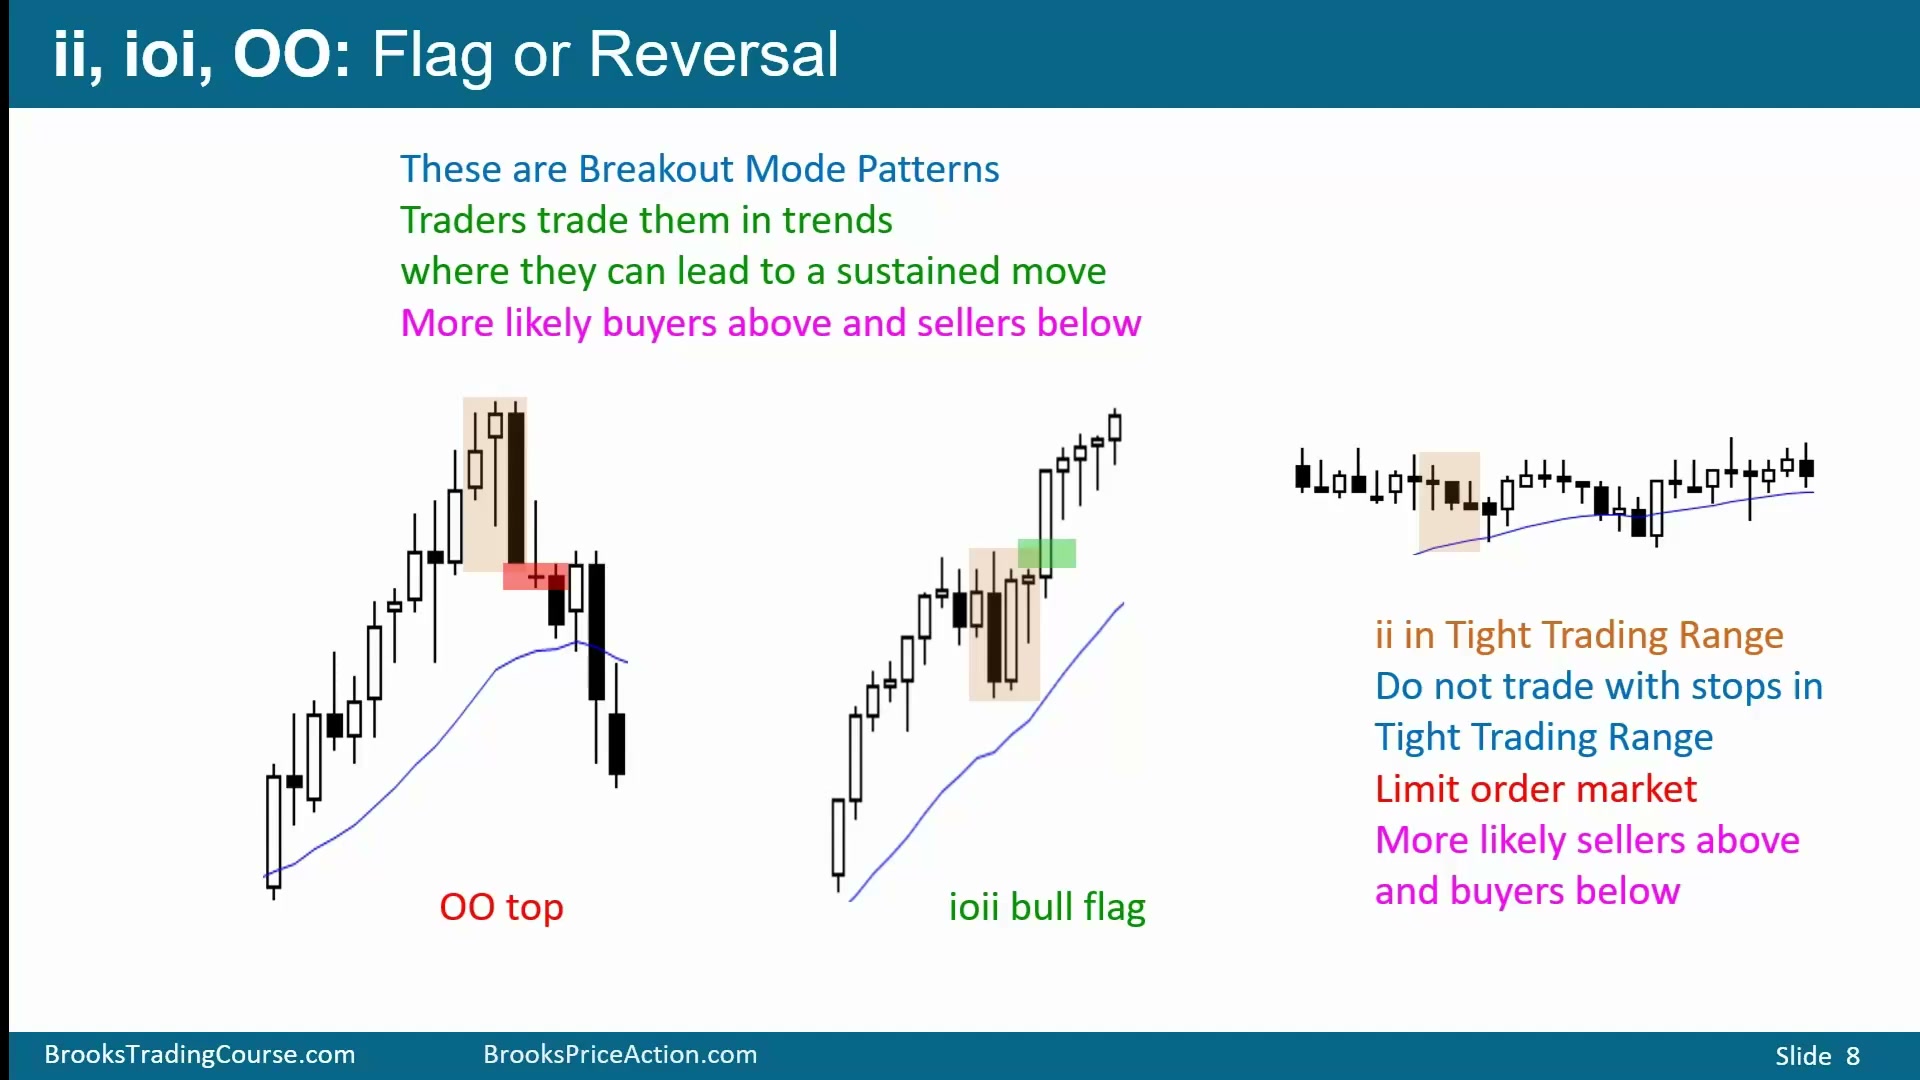
ii、ioi、OO 最适合在趋势中交易,因为交易者希望突破后出现 sustained move,并且希望市场中有足够多的 stop orders 在模式上方或下方。它们可以是反转模式,也可以是 flag。例如牛趋势中的 OO 既可能向上恢复牛趋势,成为 bull flag,也可能向下突破,成为顶部反转。本例向下突破,OO 变成顶部。
ioi 也一样。若趋势中出现 ioi,向上突破可能带来更多趋势;如果 ioi 后又接一根 Inside Bar,可以称为 ioii,同时具有 ioi 和 ii 的性质。若模式末端是收在高点附近的牛 K 线,交易者更倾向买上方;若第三根是强熊 K 线,则更倾向卖下方。
不要把这些模式当作紧密交易区间里的限价单模式。图中一组三根 Inside Bar 位于 Tight Trading Range,小实体、横向、重叠严重。这是 Limit Order Market,交易者更愿意在 K 线下方买、在 K 线上方卖,期待剥头皮回到区间,而不是用 stop 追突破。这样的 ii 或 iii 最好不做 stop 入场,等待强突破、突破失败反转,或市场真正进入牛趋势/熊趋势后再交易。
Limit Order Market 的行为和趋势市场相反。在趋势中,突破点附近有大量止损单,价格一旦触发可能继续推;在紧密交易区间中,买家喜欢在低点下方买,卖家喜欢在高点上方卖,突破常常立刻失败。若每个小 ii 都用 stop 入场,交易者会不断买高卖低,被区间里的限价单交易者反复剥头皮。
因此,先判断市场环境比先命名模式更重要。若图表是小实体、长影线、重叠 K 线、均线横向,ii、ioi 和 OO 多半只是噪音;若图表处于强趋势、突破阶段或趋势末端的清晰反转背景,同样的三根 K 线才值得用 stop 入场。
这也是为什么课程反复区分 stop order trader 和 limit order trader。stop trader 需要突破后有延续;limit order trader 则喜欢突破失败回到区间。若当前环境明显奖励限价单,stop trader 最好的选择通常是等待,而不是强迫自己交易每一个小模式。
完美ii的高低点逐步收缩
Time: 14:08
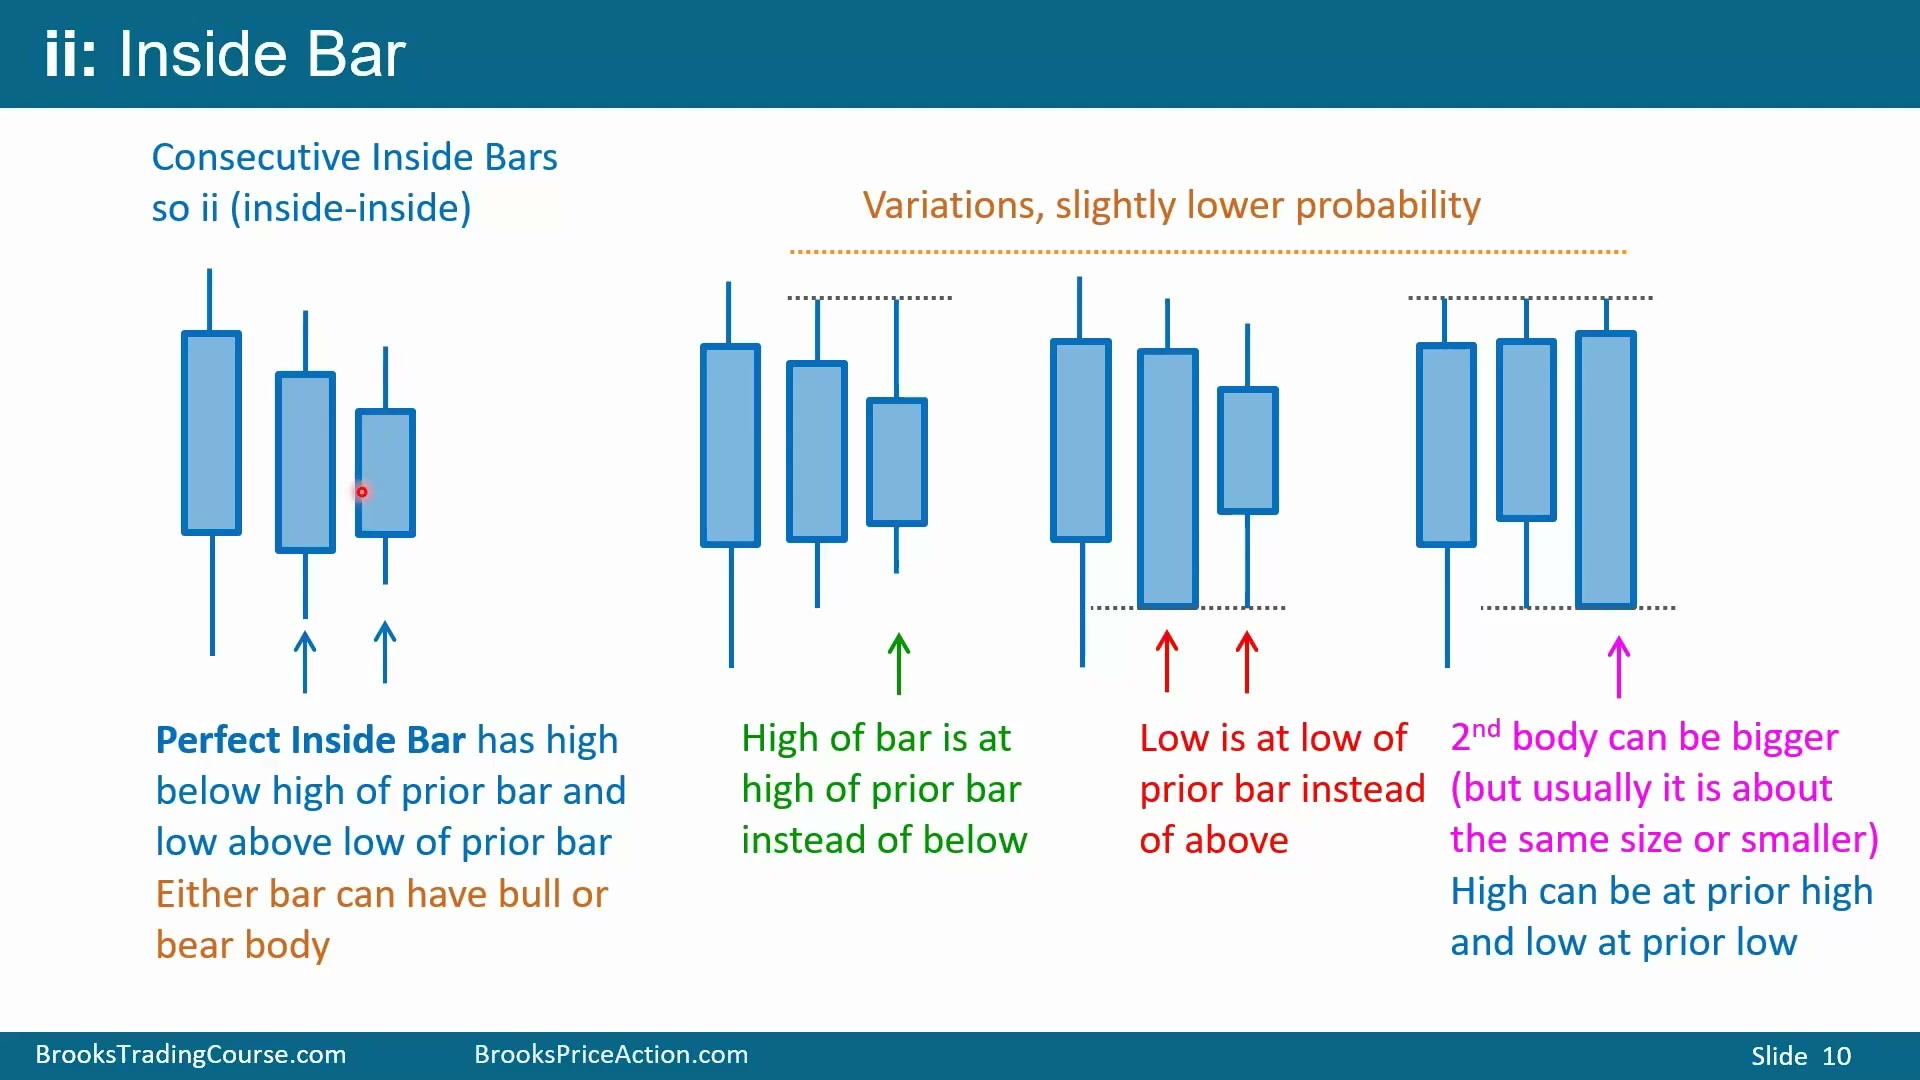
完美 Inside Bar 的低点高于前一根低点,高点低于前一根高点;连续两根完美 Inside Bar 就是完美 ii。图左侧的 ii 高点不断降低、低点不断抬高,收缩很清晰,成功交易概率相对更高。
ii 也有很多变体。Inside Bar 的高点可以等于前一根高点,或低点可以等于前一根低点;甚至三根 K 线有相同高点,两个 Inside Bar 有相同低点,仍然可以算 ii。实体大小不是定义关键,但收缩结构中实体通常也会变小。如果要买,第二根 Inside Bar 最好是收在高点附近的牛 K 线;如果要卖,最好是熊实体并收在低点附近。
完美 ii 之所以更好,是因为所有人都容易看见同一个收缩区间。高点降低、低点抬高,说明买卖双方都暂时无法推动价格,突破触发点也很清楚。电脑程序和人工交易者看到同样边界时,突破后的订单更容易集中,从而提高 follow-through 概率。
但不完美 ii 仍可交易。相等高点、相等低点或实体大小不规则,都不自动取消模式;只是概率会略降,交易者更需要背景和信号 K 线质量来补足。定义要灵活,执行要严格。
模式越明显,越容易吸引交易者和电脑
Time: 16:25
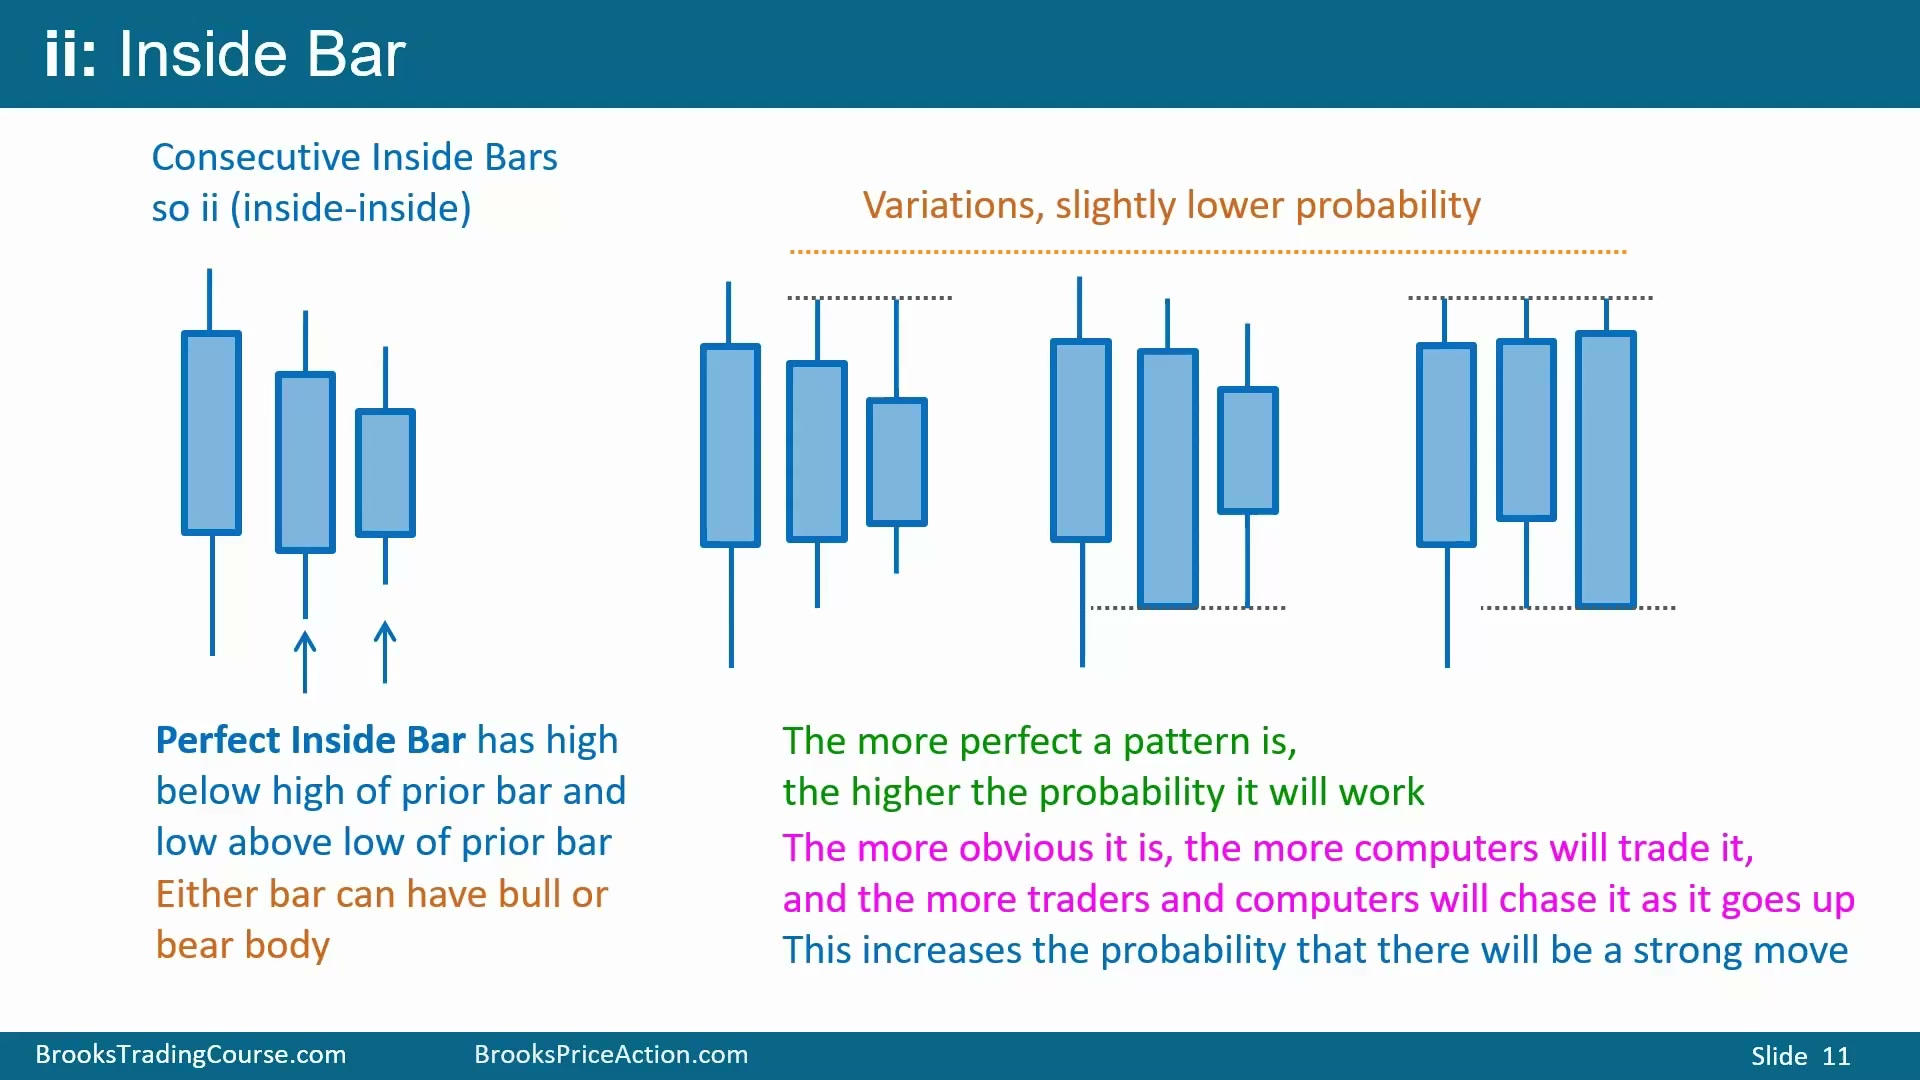
完美 ii、Lower Highs、Higher Lows,再加上适合方向的信号 K 线,会提高概率。若要卖,第二根 Inside Bar 收在低点附近,会比牛实体信号更好;若要买,收在高点附近的牛 K 线更好。
模式越明显、越完美,越容易被电脑识别,也越容易被交易者同时交易。一旦价格开始向预期方向突破,更多交易者和程序会追随。如果是买入,连续牛 K 线收在高点会吸引更多买家;如果是卖出,连续熊 K 线收在低点会吸引更多卖家,从而提高获得良好 swing 的概率。
ii向上突破时优先买强牛K线
Time: 17:25
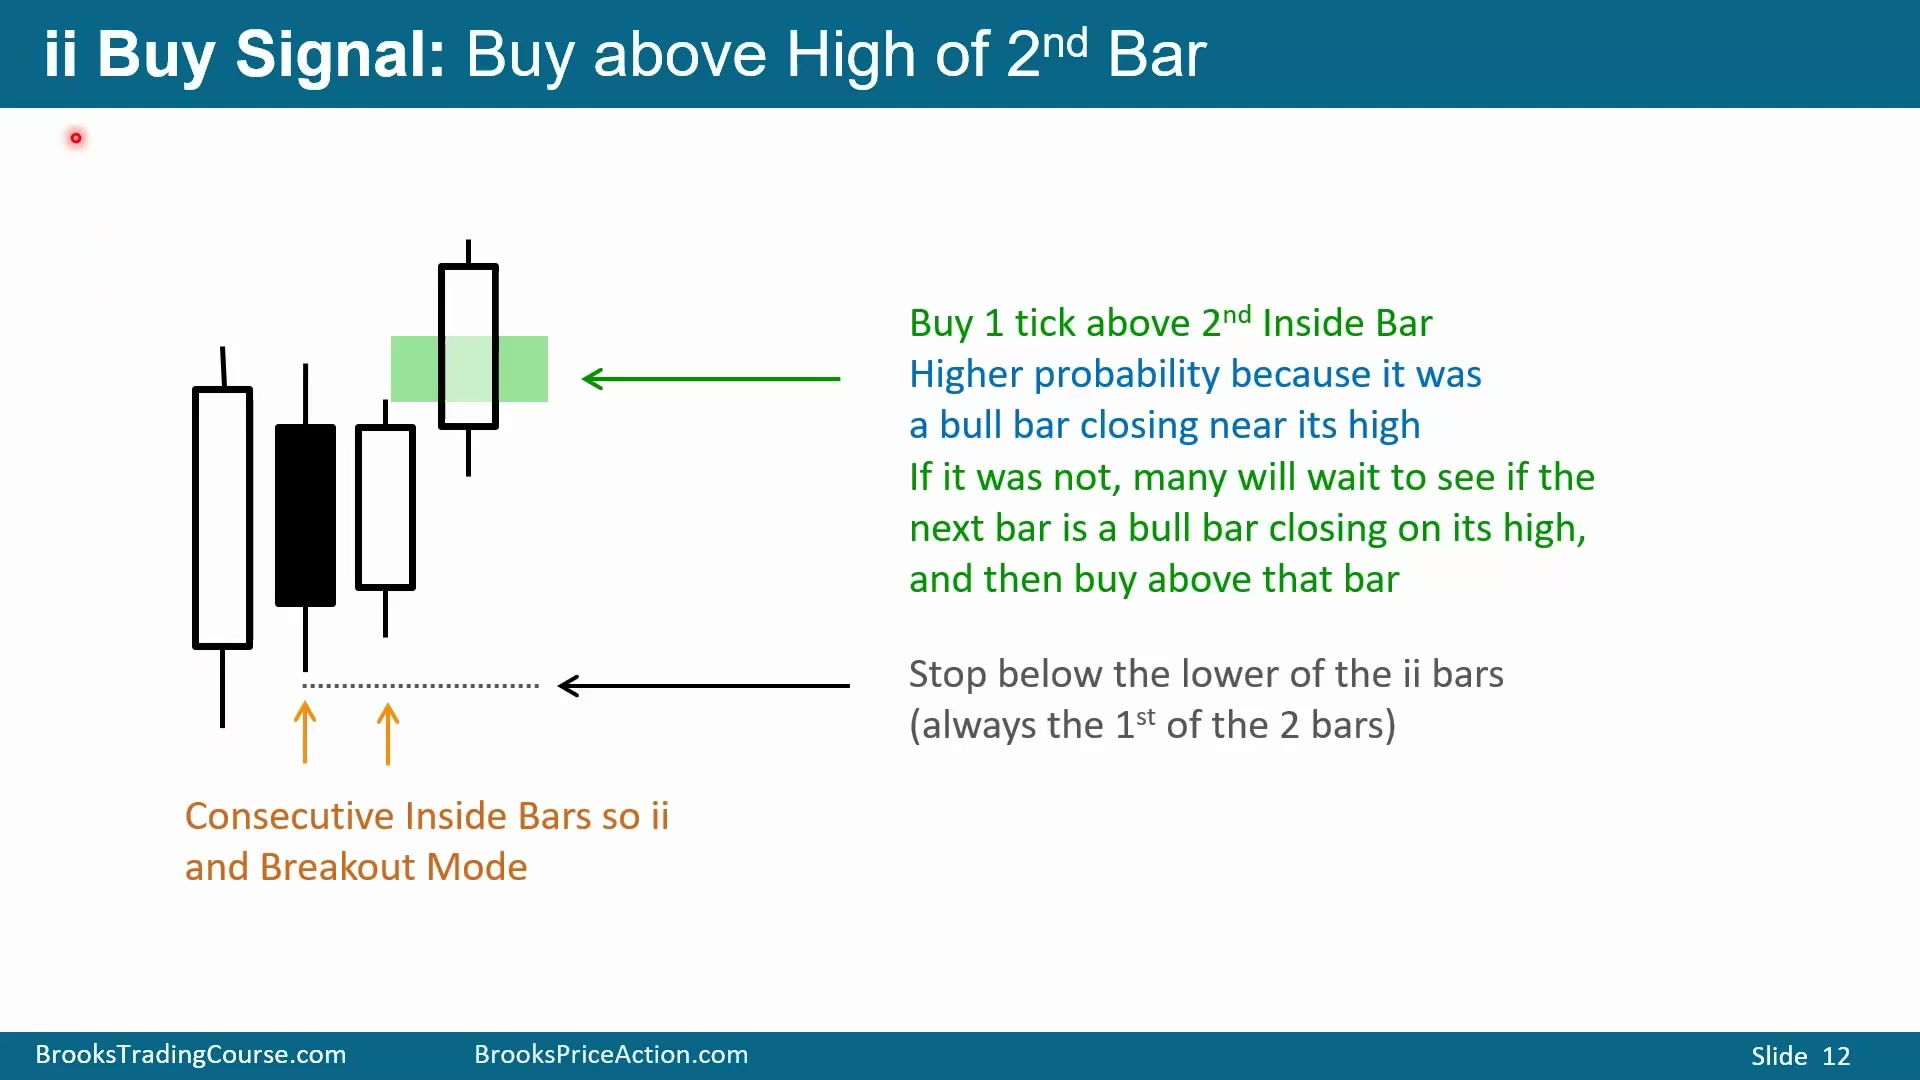
图中的连续 Inside Bar 很完美:低点逐步抬高,高点逐步降低,最后有一根收在高点附近的牛 K 线。若它出现在牛趋势中,可以是 bull flag;若出现在熊趋势末端,则可能是向上反转。买入位置是第二根 Inside Bar 高点上方 1 tick。
如果 ii 的第二根 Inside Bar 是熊实体,但价格向上突破,直接在熊 K 线上方买入的概率较低。更高概率的方式是观察 entry bar;若突破后的 entry bar 是收在高点的牛 K 线,再在 entry bar 高点上方买入。止损理论上放在 ii 低点下方;如果背景是熊趋势末端反转,也可以放在整个熊趋势低点下方。ii 向上突破是买,跌破低点是卖,BreakOut Mode 两个方向都要准备。
若 entry bar 很强,说明突破后有真实买盘进入;若 entry bar 是 doji 或收在中点下方,说明买方没有控制市场。交易者可以用这根突破后的 K 线来决定是否接受更差的价格换取更高概率。
等突破后的牛Entry Bar会提高概率但增加风险
Time: 18:50
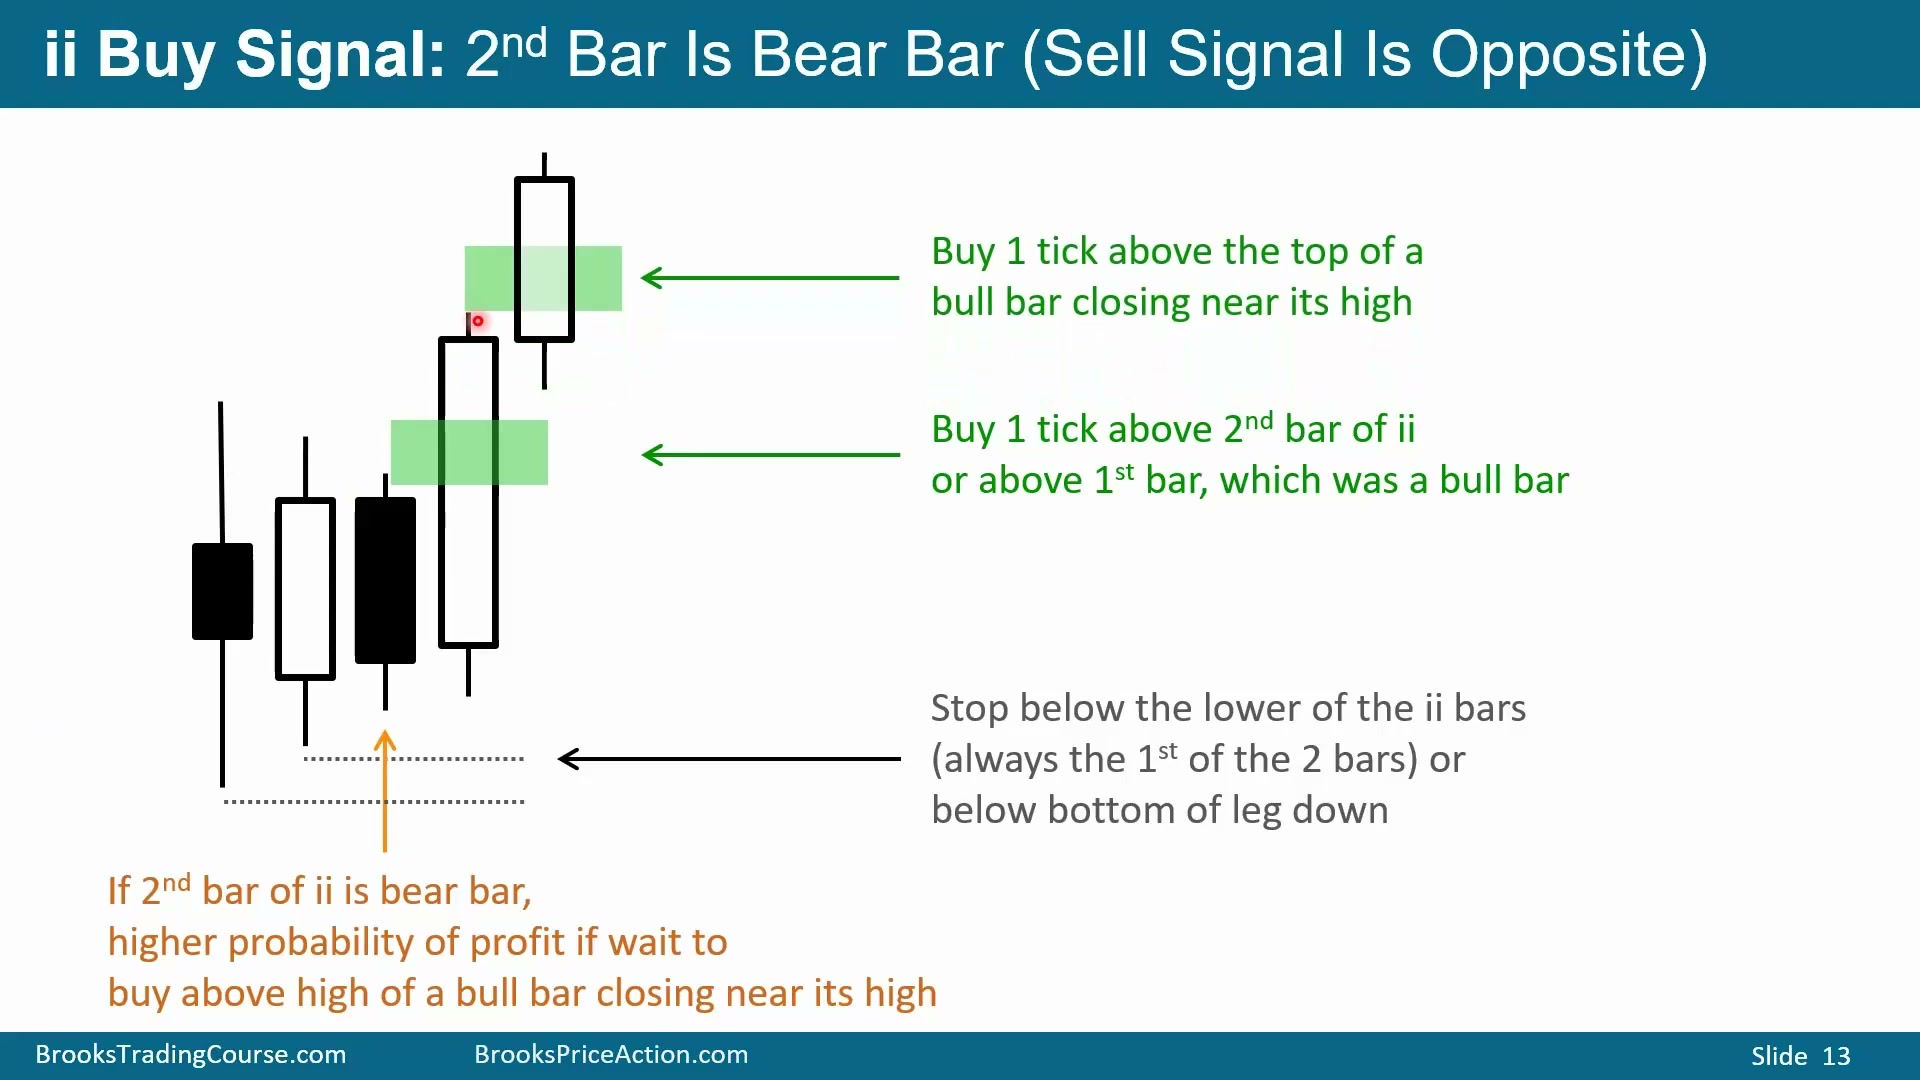
当 ii 第二根 Inside Bar 是熊 K 线但市场向上突破时,技术上仍可以买在这根 K 线上方。有些交易者会等到后面出现牛 K 线再买,或者等突破 K 线本身收在高点附近,再买在突破 K 线高点上方。这样做概率更高,因为买入信号由弱信号转换成强牛 K 线确认。
风险是止损更远。买得越晚,入场价离 ii 低点或熊趋势低点越远,初始风险越大。但这就是提高概率的代价。想要更高概率,可以在收在高点的牛 K 线上方 1 tick 或 1 pip 买入;想要更好风险回报,则可以更早买在 ii 上方。
ii向下突破时要避免弱熊信号
Time: 19:50
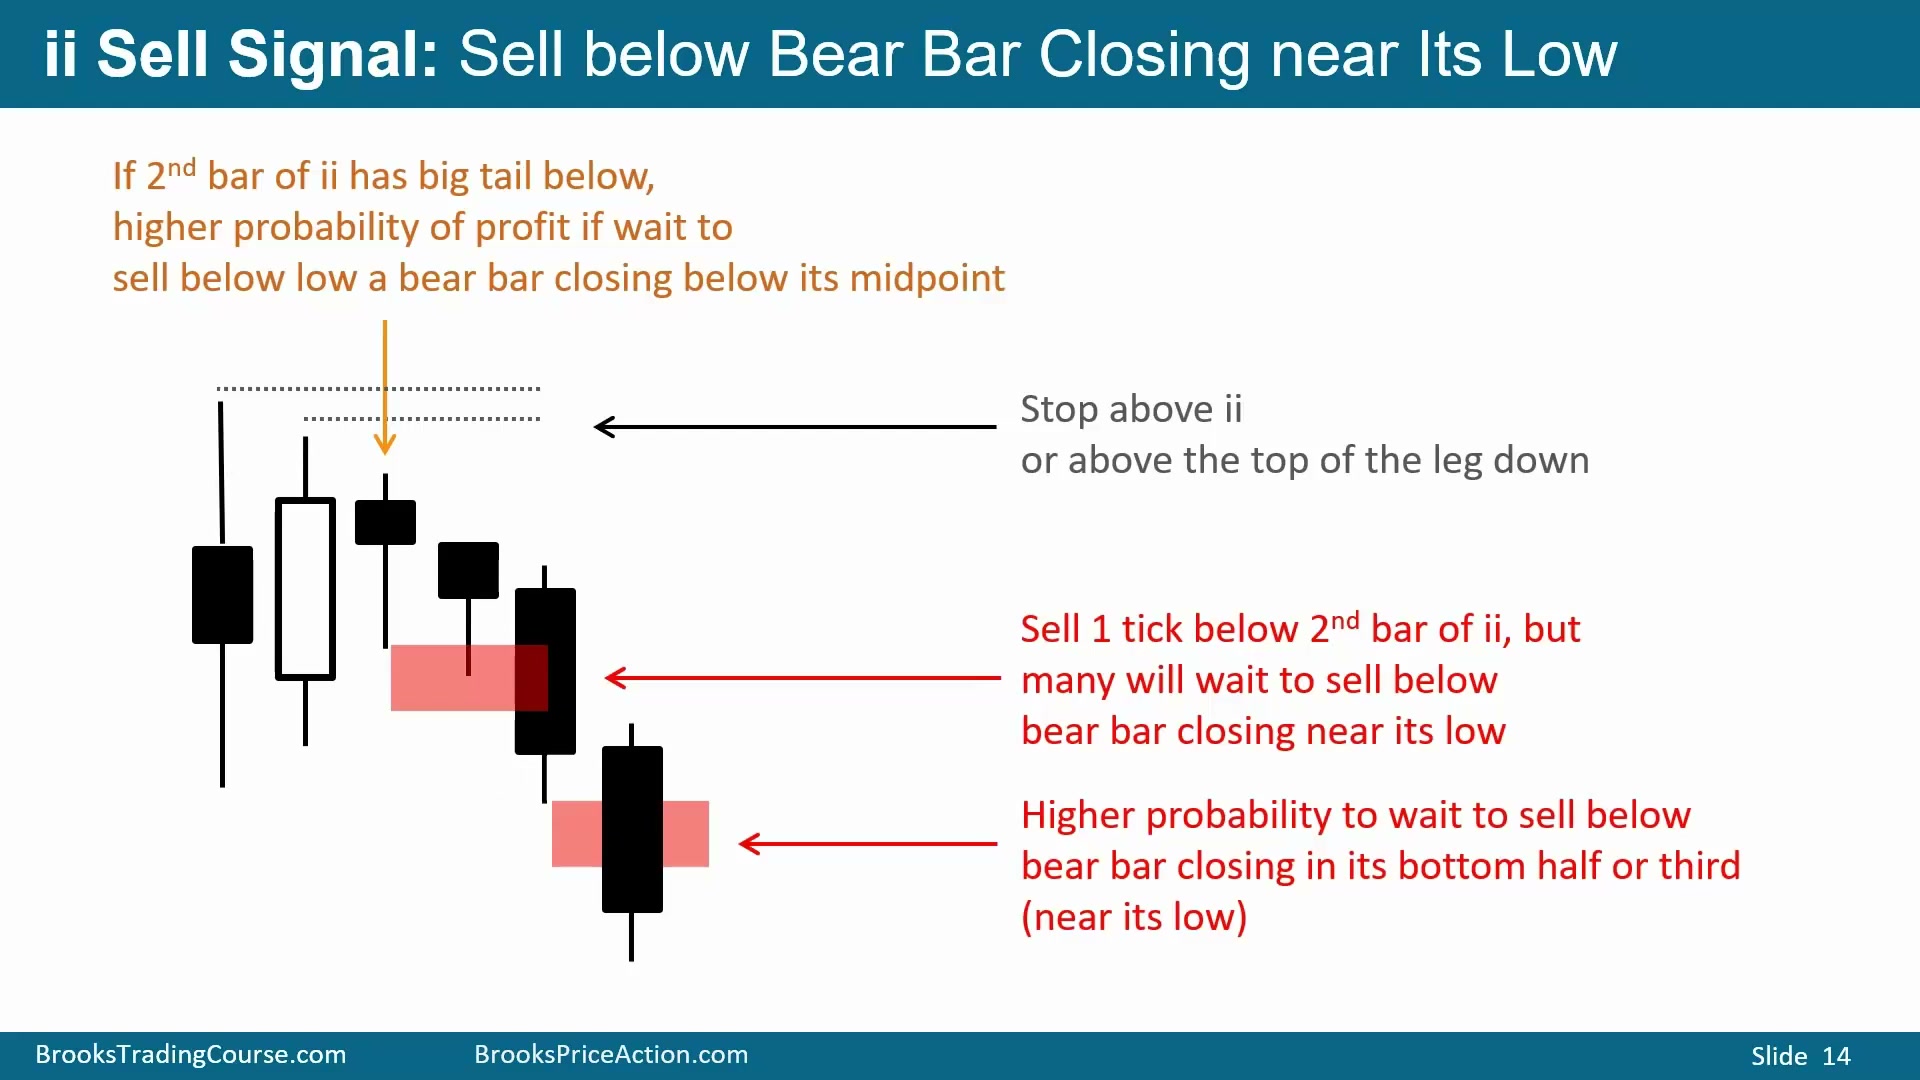
图中 ii 向下突破,但突破 K 线收盘在中点上方,低位有明显下影线。这说明价格跌到低位时有人买入,并把收盘拉回去,卖出信号不强。下一根也有较大下影线,因此许多交易者不会急着卖在这些 K 线低点下方。
更高概率的卖法是等待收在低点附近的熊 K 线,再在其低点下方 1 tick 或 1 pip 卖出。止损可以放在 ii 高点上方,或放在整个模式/趋势高点上方。若背景是牛趋势顶部反转,止损可放在牛趋势高点上方;若背景是熊趋势中的 bear flag,则放在 flag 高点上方。等待强熊 K 线会牺牲部分风险回报,但能过滤弱突破。
同一根K线内的突破失败可以立刻反手
Time: 21:03
图中 ii 先跌破低点触发卖出,同一根 K 线又立即上破 ii 高点。卖在牛 K 线下方本来就不是理想选择,但技术上可以;如果做空后同一根 K 线打到止损,也只是正常成本。随后可以在 ii 上方反手做多,或者等待收在高点附近的牛 K 线,再在其上方买入。
相反案例中,第二根 Inside Bar 是小牛实体,但市场转为向下。可以直接卖在这根牛 K 线低点下方,也可以等后续熊 K 线收在低点附近,再卖在其低点下方。关键是让入场方向与更强的 K 线行为配合。
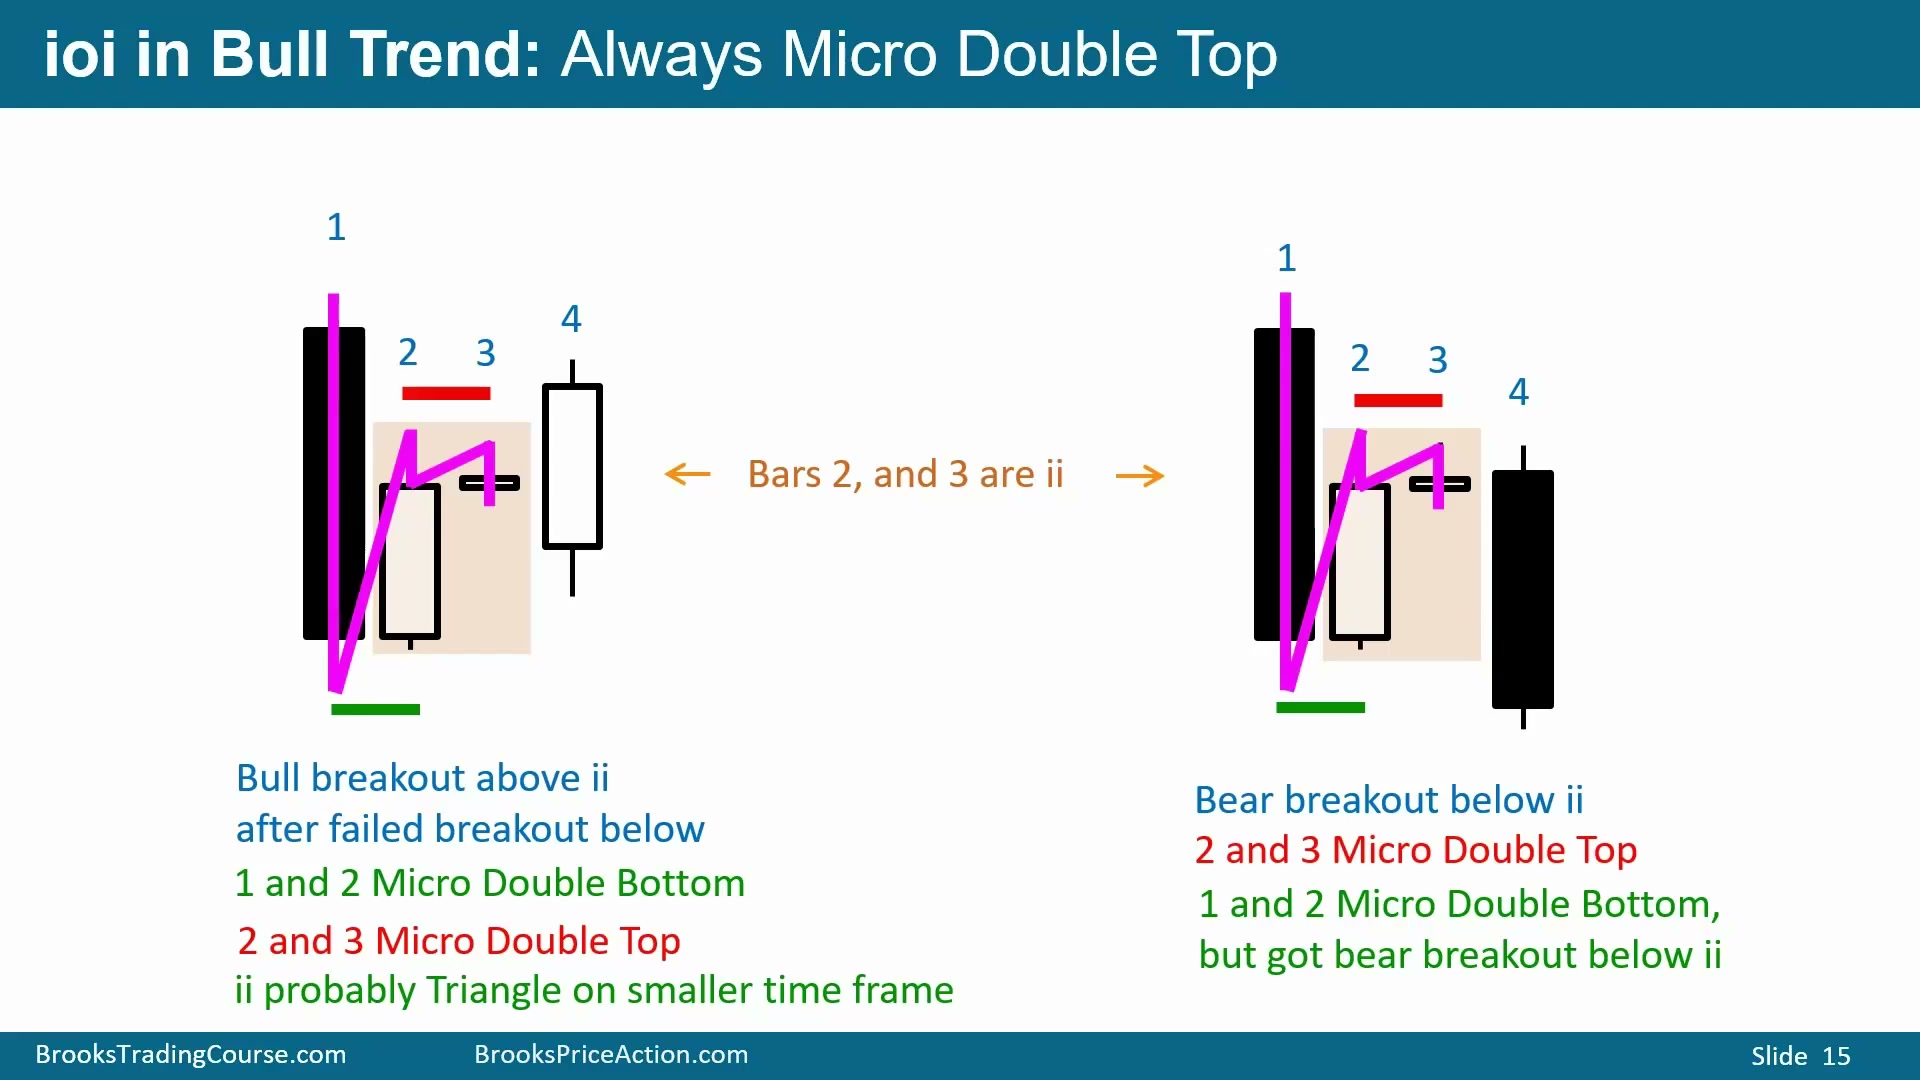
每个 ii、ioi 和 OO 在小结构里都至少包含某种 Micro Double Top 和 Micro Double Bottom。图中的四根 K 线里,第二、第三根构成 ii;价格先下后上,再从高点回到收盘,又再次上下波动,形成微型高点和微型低点。ii 在当前周期上看是小交易区间,在更小周期上通常就是 Triangle。因此它是 BreakOut Mode,而不是单向信号。
同一根 K 线内先触发一个方向、又反向触发另一个方向时,交易者不能固执于第一次判断。BreakOut Mode 的本质就是两个方向都有可能;若第一次突破没有 follow-through,另一侧突破反而可能更强,因为第一批交易者会被困住并被迫止损。
失败突破后的反向交易尤其要看 K 线收盘。如果反向突破只是短暂刺破后又回到中间,说明双方仍在区间内争夺;若反向 K 线收在高点或低点附近,就更像真正接管。ii、ioi 和 OO 的交易质量,最终都由突破后的 K 线行为确认。
ii在小周期上通常是Triangle
Time: 24:04
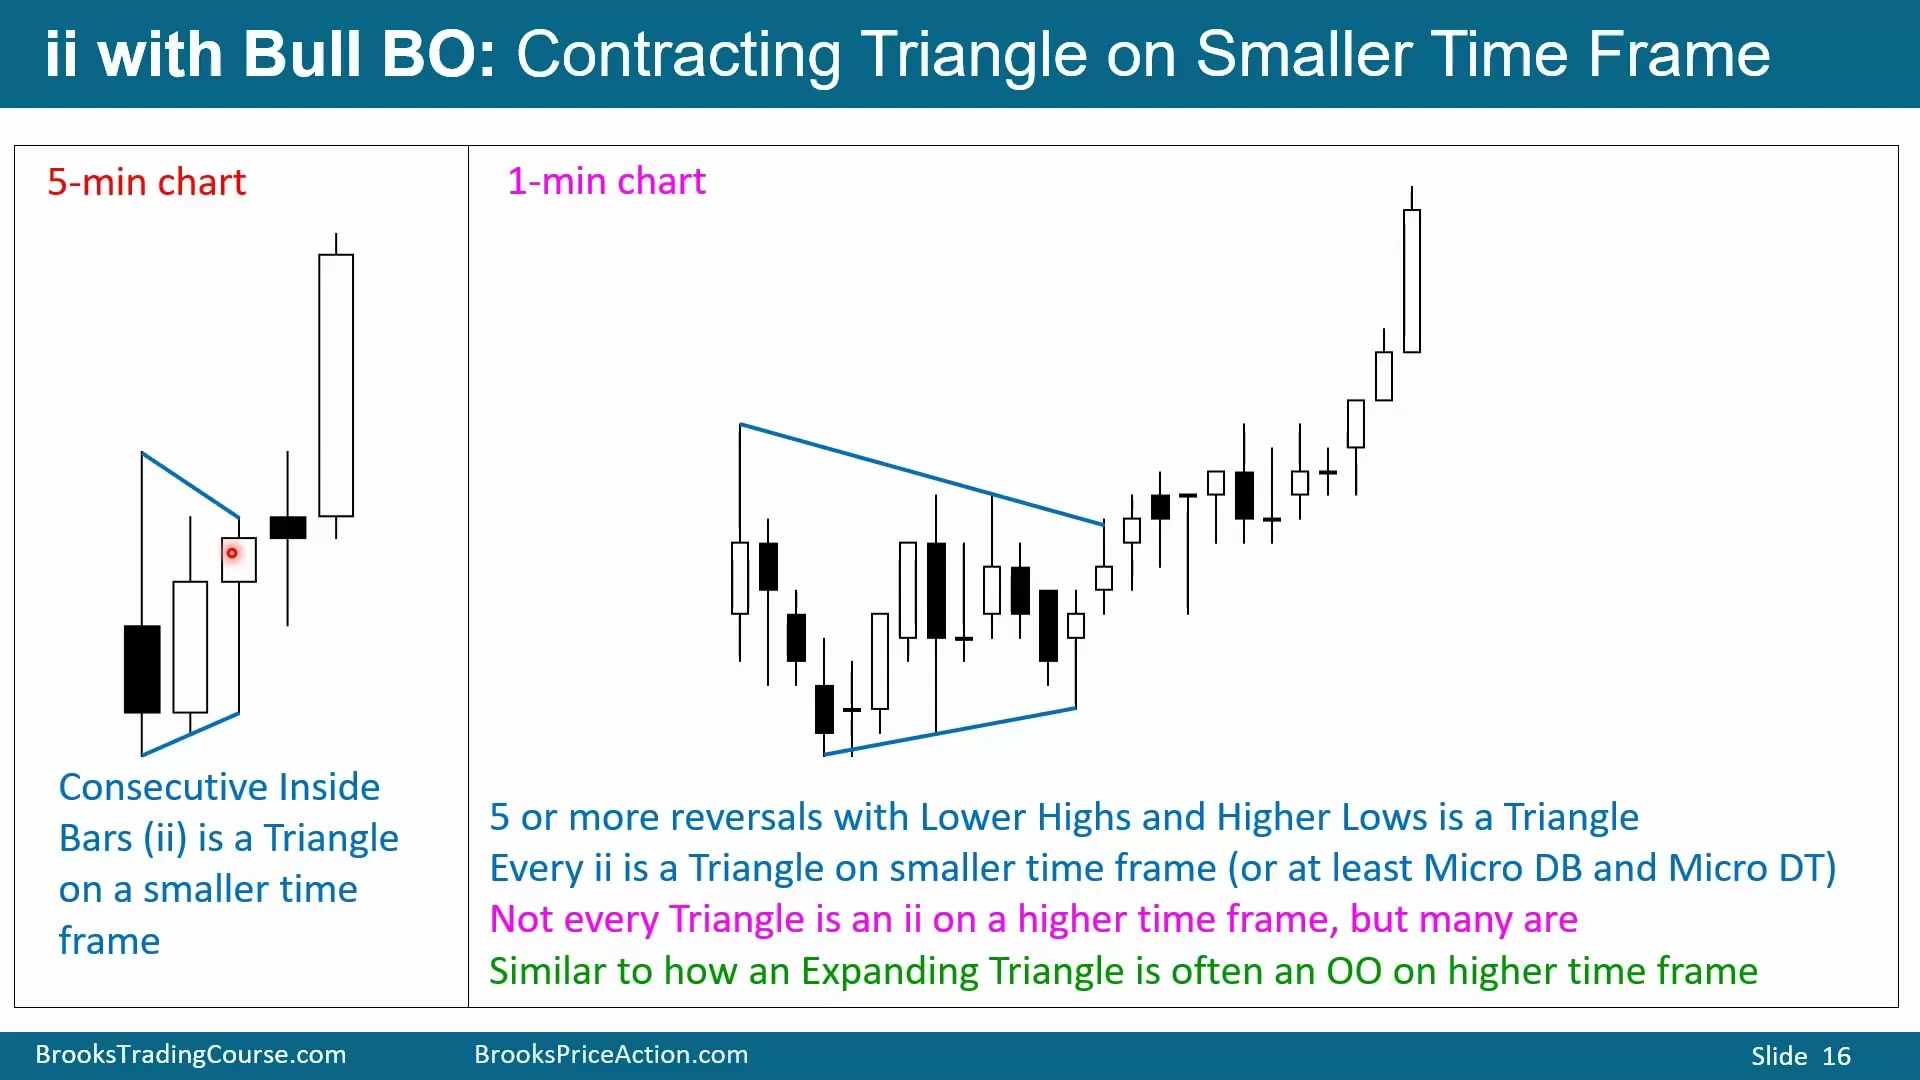
图中 5 分钟图出现 ii 并向上突破。如果切到 1 分钟图,通常会看到三个低点和两个高点,形成一个有 Lower High 和 Higher Lows 的小交易区间,也就是 Triangle。这里 1 分钟图正显示了该 ii 的 Triangle 形态,并向上突破顶部。
并非每个 Triangle 都值得回头寻找某个高周期上的 ii。理论上总能找到某个周期让它看起来像 ii,但这没有必要。若当前交易周期已经清楚出现 ii,也不必去小周期确认 Triangle;你已经知道它本质上是 BreakOut Mode。
当前周期足够清楚时,就按当前周期执行。
Bitcoin月线ii和周线Triangle表达同一件事
Time: 25:05
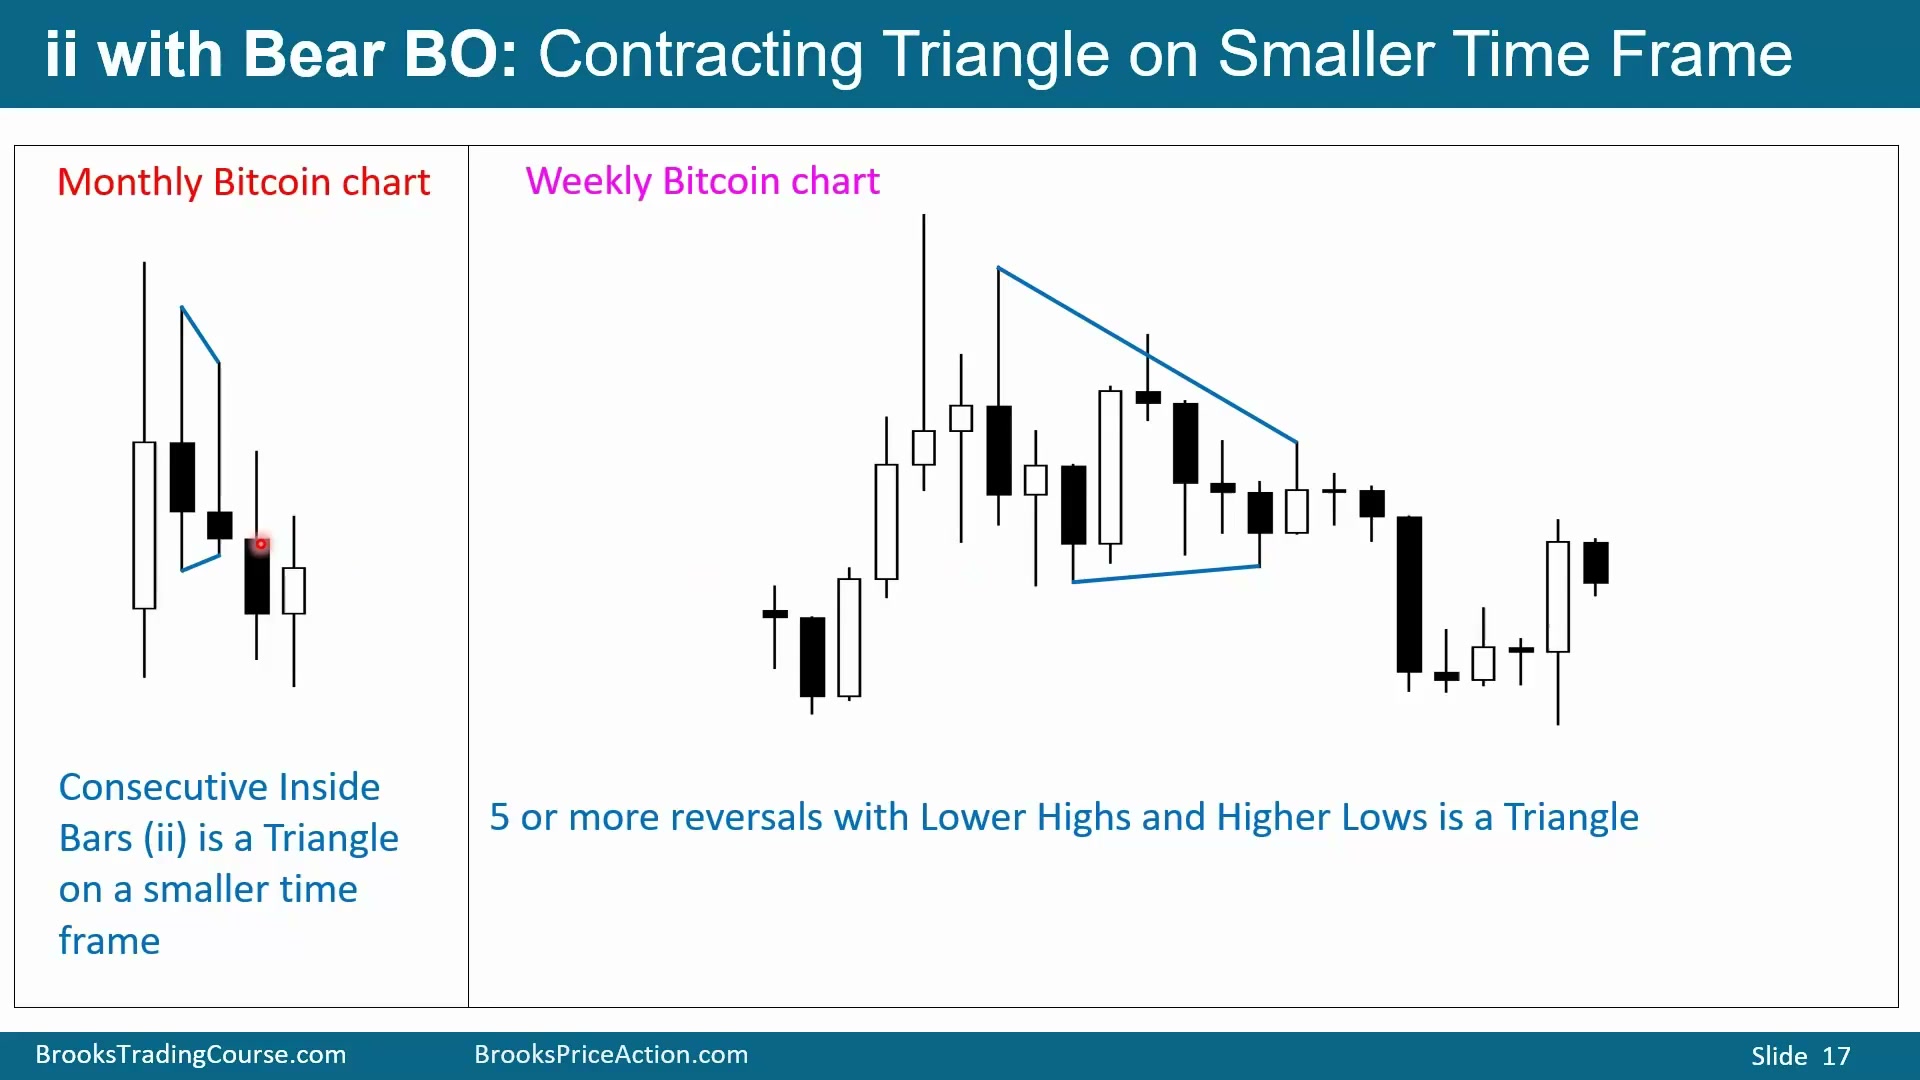
Bitcoin 月线图上的连续 Inside Bars,在周线图上可以表现为 Triangle:三个高点、一组低点,以及最终的向下突破。高周期的收缩 K 线结构,放到小周期上通常会展开成更清晰的横向整理和多次推动。
这个例子说明,ii 不是孤立的 K 线技巧,而是多周期价格行为的压缩表达。高周期看起来只有几根 K 线,小周期中可能已经经历了多次上下尝试。
多根Inside Bar仍然只是BreakOut Mode
Time: 25:25
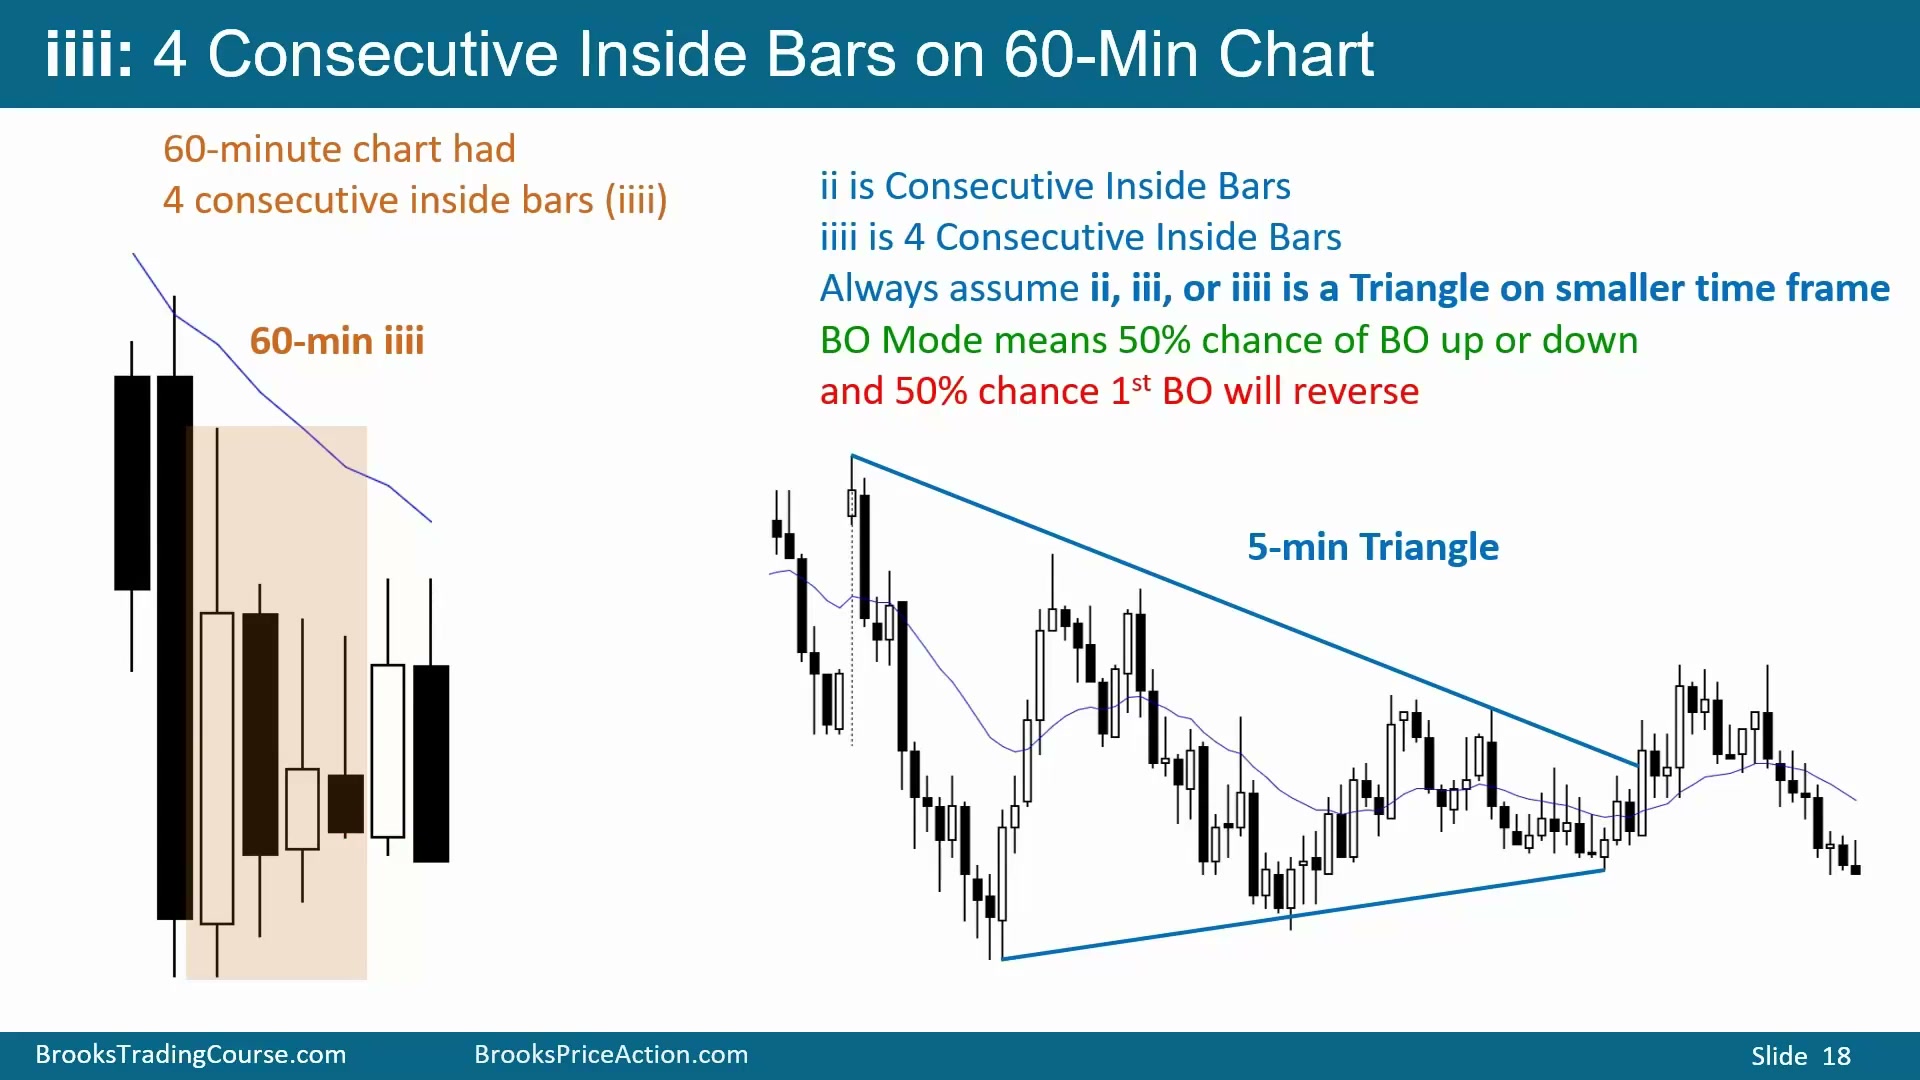
三根、四根甚至更多连续 Inside Bar,本质上和 ii 没有区别。它们都是 BreakOut Mode,并且在更小周期上通常是 Triangle。图中 60 分钟图有四根连续 Inside Bar,而 5 分钟图能看到对应 Triangle。
知道小周期是 Triangle 可以帮助理解它为什么是 BreakOut Mode,但并不会改变交易方式。当前图上市场横向收缩,等待突破;第一方向有约 50% 概率失败,也有约 50% 概率成功。有时市场会先向下再向上,两个方向都触发。交易者只需要按眼前周期的 BreakOut Mode 管理,而不是为了确认去寻找更小周期结构。
多根 Inside Bar 越多,越说明市场正在等待信息或等待一方放弃。它可能最终成为强突破,也可能先假突破再反向。交易计划要包括两边:上破就看买入质量和 follow-through,下破就看卖出质量和 follow-through;若第一边失败,另一边会因为 trapped traders 而更有动力。
趋势末端的Triangle常是Final Flag
Time: 26:46
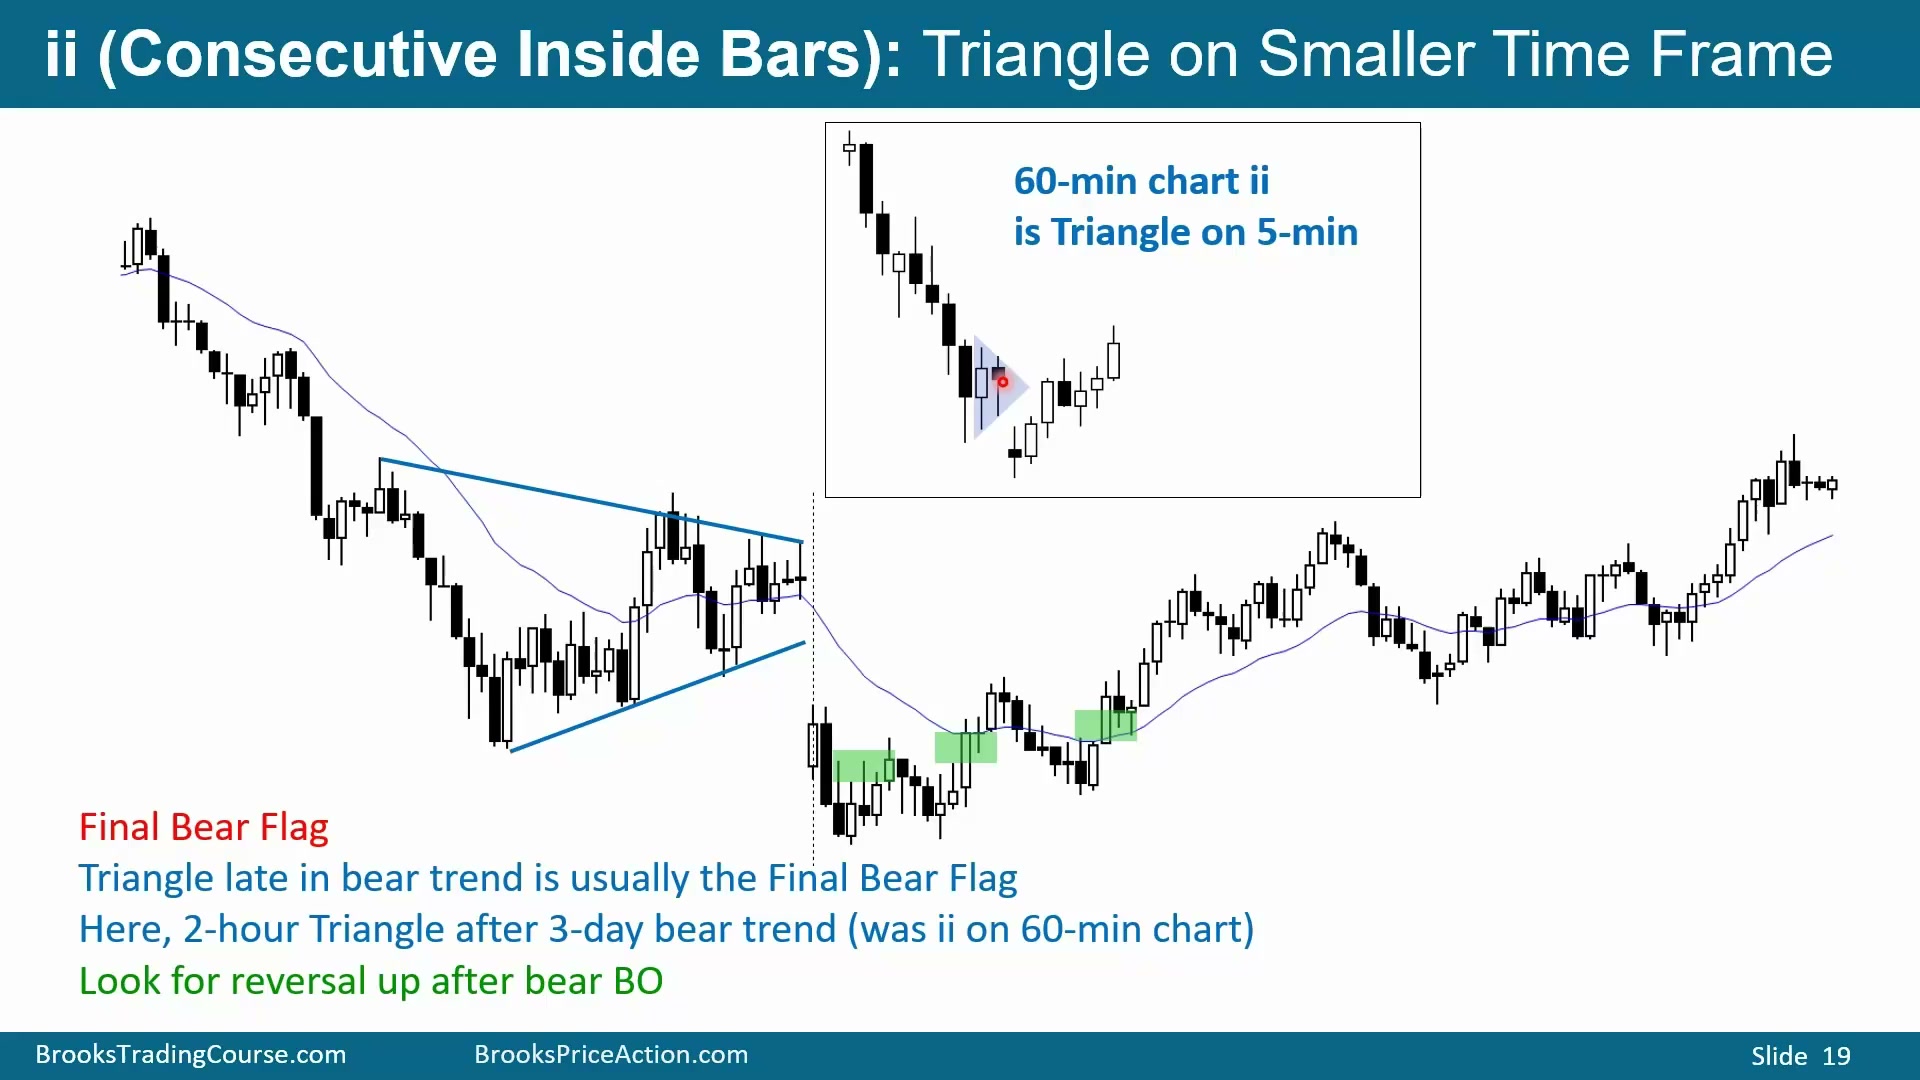
熊趋势末端的 Triangle 往往是 final bear flag。Triangle 是价格共识区,交易者认为这个价格相对公平;无论向上还是向下突破,市场都容易被吸回这个公平价格附近。因此,若 late bear trend 中的 Triangle 向下突破,价格很可能很快回到 Triangle apex。
这就是为什么趋势晚期的 ii 或小 Triangle 不能机械顺势追。向下突破确实可能再走一段,但若它只是 final bear flag,空头利润空间很有限,随后反弹回 apex 的风险很高。交易者要把“趋势方向突破”和“趋势末端失败突破”同时纳入计划。
图中当前周期是 5 分钟图;若看 60 分钟图,这个 Triangle 可能就是一个 ii。反过来,如果交易者在 60 分钟图上看到 ii,就应假设小周期上有类似 5 分钟 Triangle 的结构。
ioi是Outside Bar之后的Inside Bar
Time: 27:45
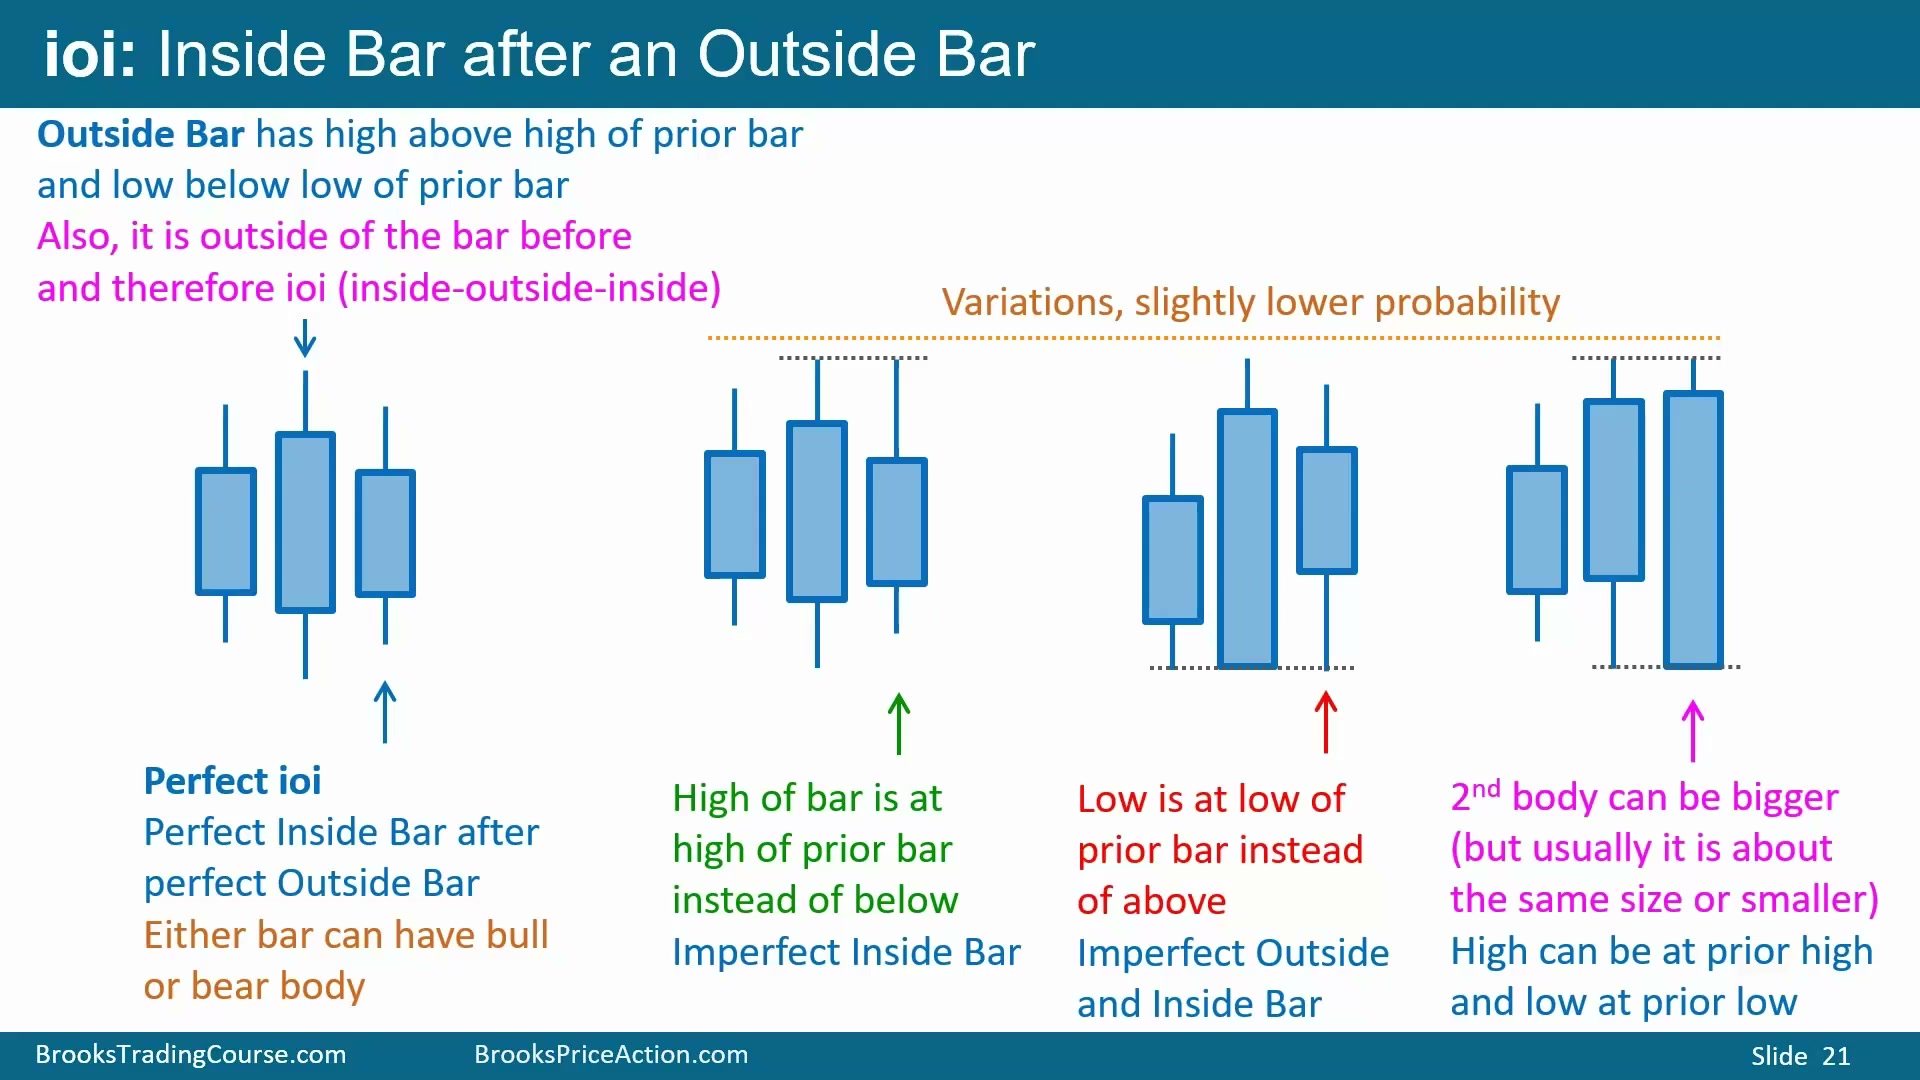
ioi 的定义是 Outside Bar 后面接 Inside Bar。因为 Outside Bar 前一根 K 线必然在它的范围内,所以完整结构是 inside-outside-inside。它同样是 BreakOut Mode。
完美 ioi 中,Outside Bar 的低点低于前一根低点,高点高于前一根高点;后面的 Inside Bar 高点低于 Outside Bar 高点,低点高于 Outside Bar 低点。变体可以有相等高点或相等低点。例如后面的 Inside Bar 高点等于 Outside Bar 高点,仍可视为 ioi,只是没有完美形态可靠。
有些结构会同时符合 ioi 和 OO。若第三根 K 线既可以算 Inside Bar,又因为高低点与前一根相等而符合 Outside Bar 定义,它就既是 ioi 也是 OO。名称不重要;两者都是 BreakOut Mode,交易方式围绕突破和失败突破展开。
实际图表中相等高点和相等低点很常见,尤其在最小跳动单位较大的市场。不要为了名称争论浪费注意力。只要三根 K 线形成一个小型横向区间,并且突破方向尚未确定,就应按 BreakOut Mode 处理:准备两侧突破,评估信号 K 线强弱,失败后考虑反手。
完美ioi配合强熊K线是高概率卖出
Time: 29:48
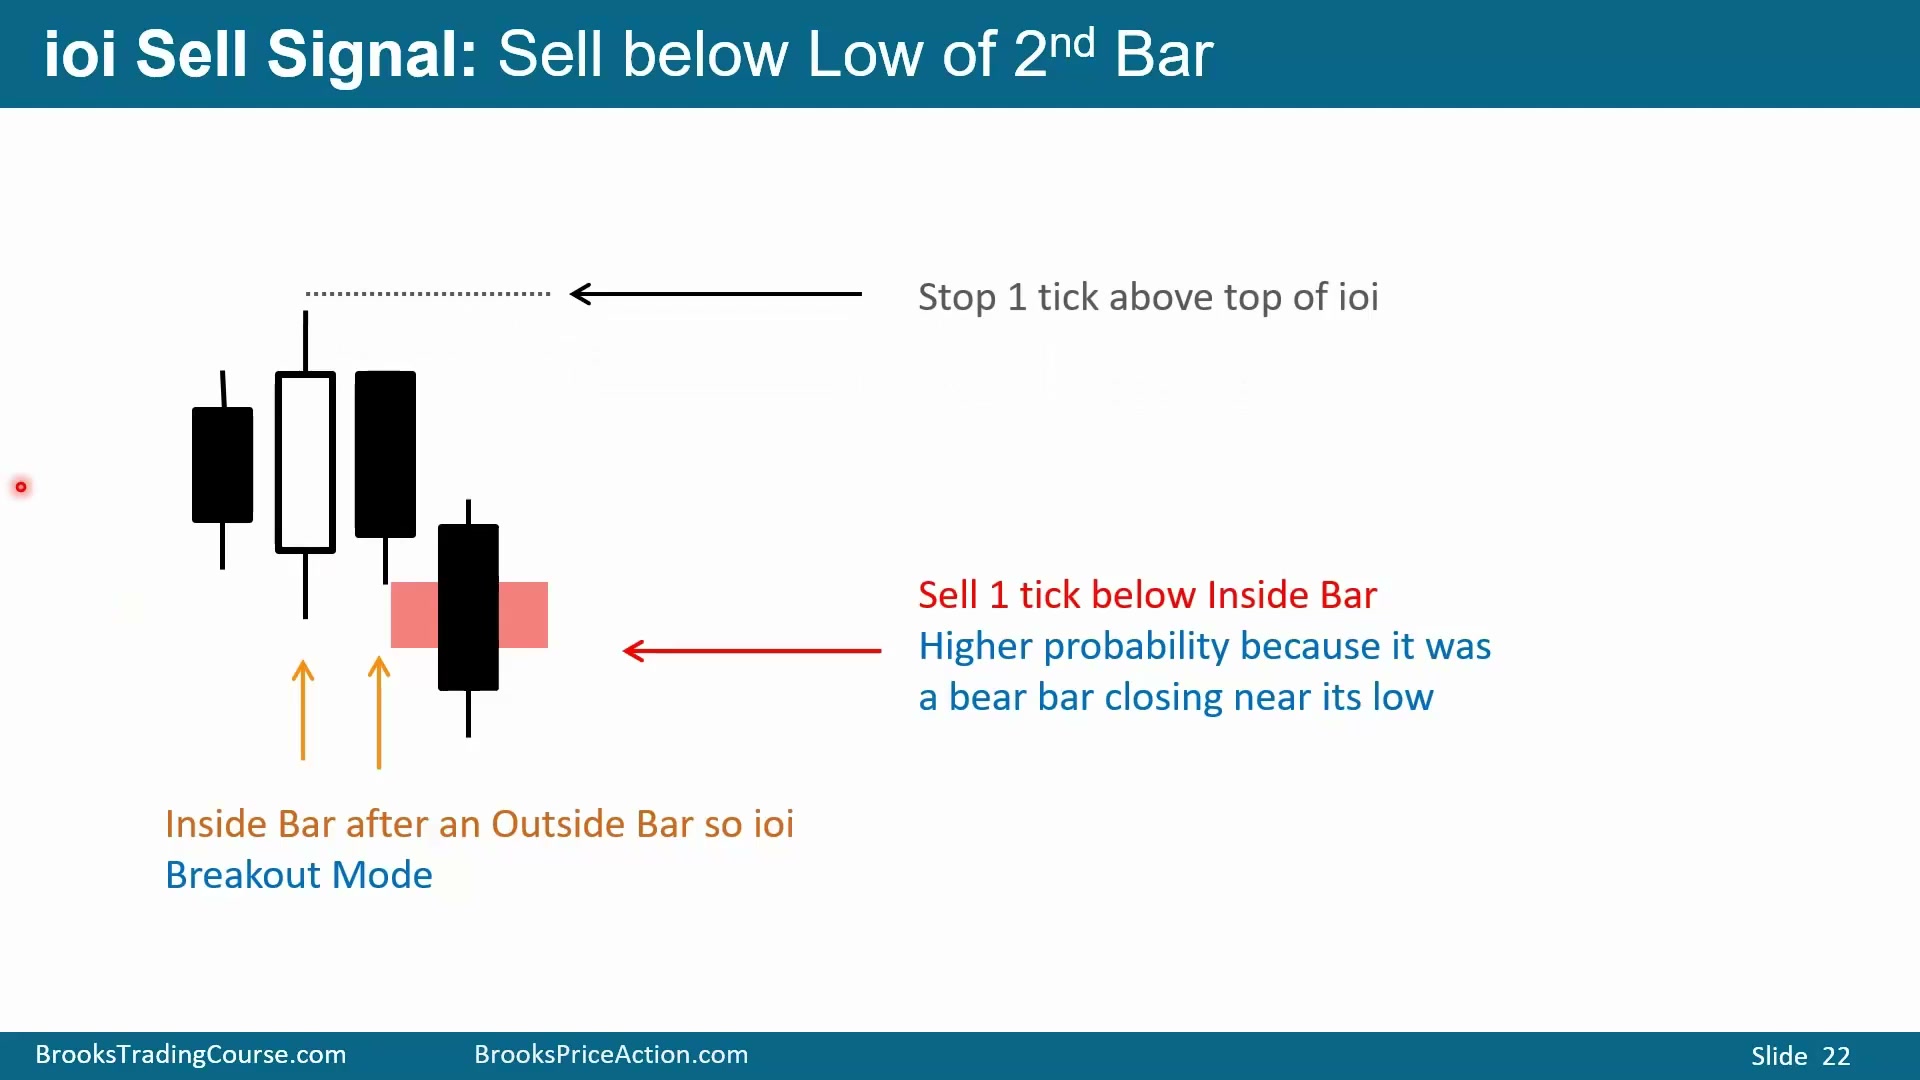
图中的 ioi 以熊 K 线结束,这可能出现在牛趋势顶部,也可能是熊趋势中的 bear flag。若最后一根熊 K 线收在低点附近,交易者会在其低点下方 1 tick 或 1 pip 用 stop 卖出。
这是较高概率 ioi,因为结构完美,先有大牛 K 线,后有收在低点附近的熊 K 线,反转意图清楚。止损通常放在整个 ioi 高点上方。背景仍然重要:同样的 ioi 在阻力区、Buy Climax 末端或熊趋势 flag 中更有意义。
ioi向上突破时等待强牛Entry Bar更稳
Time: 30:35
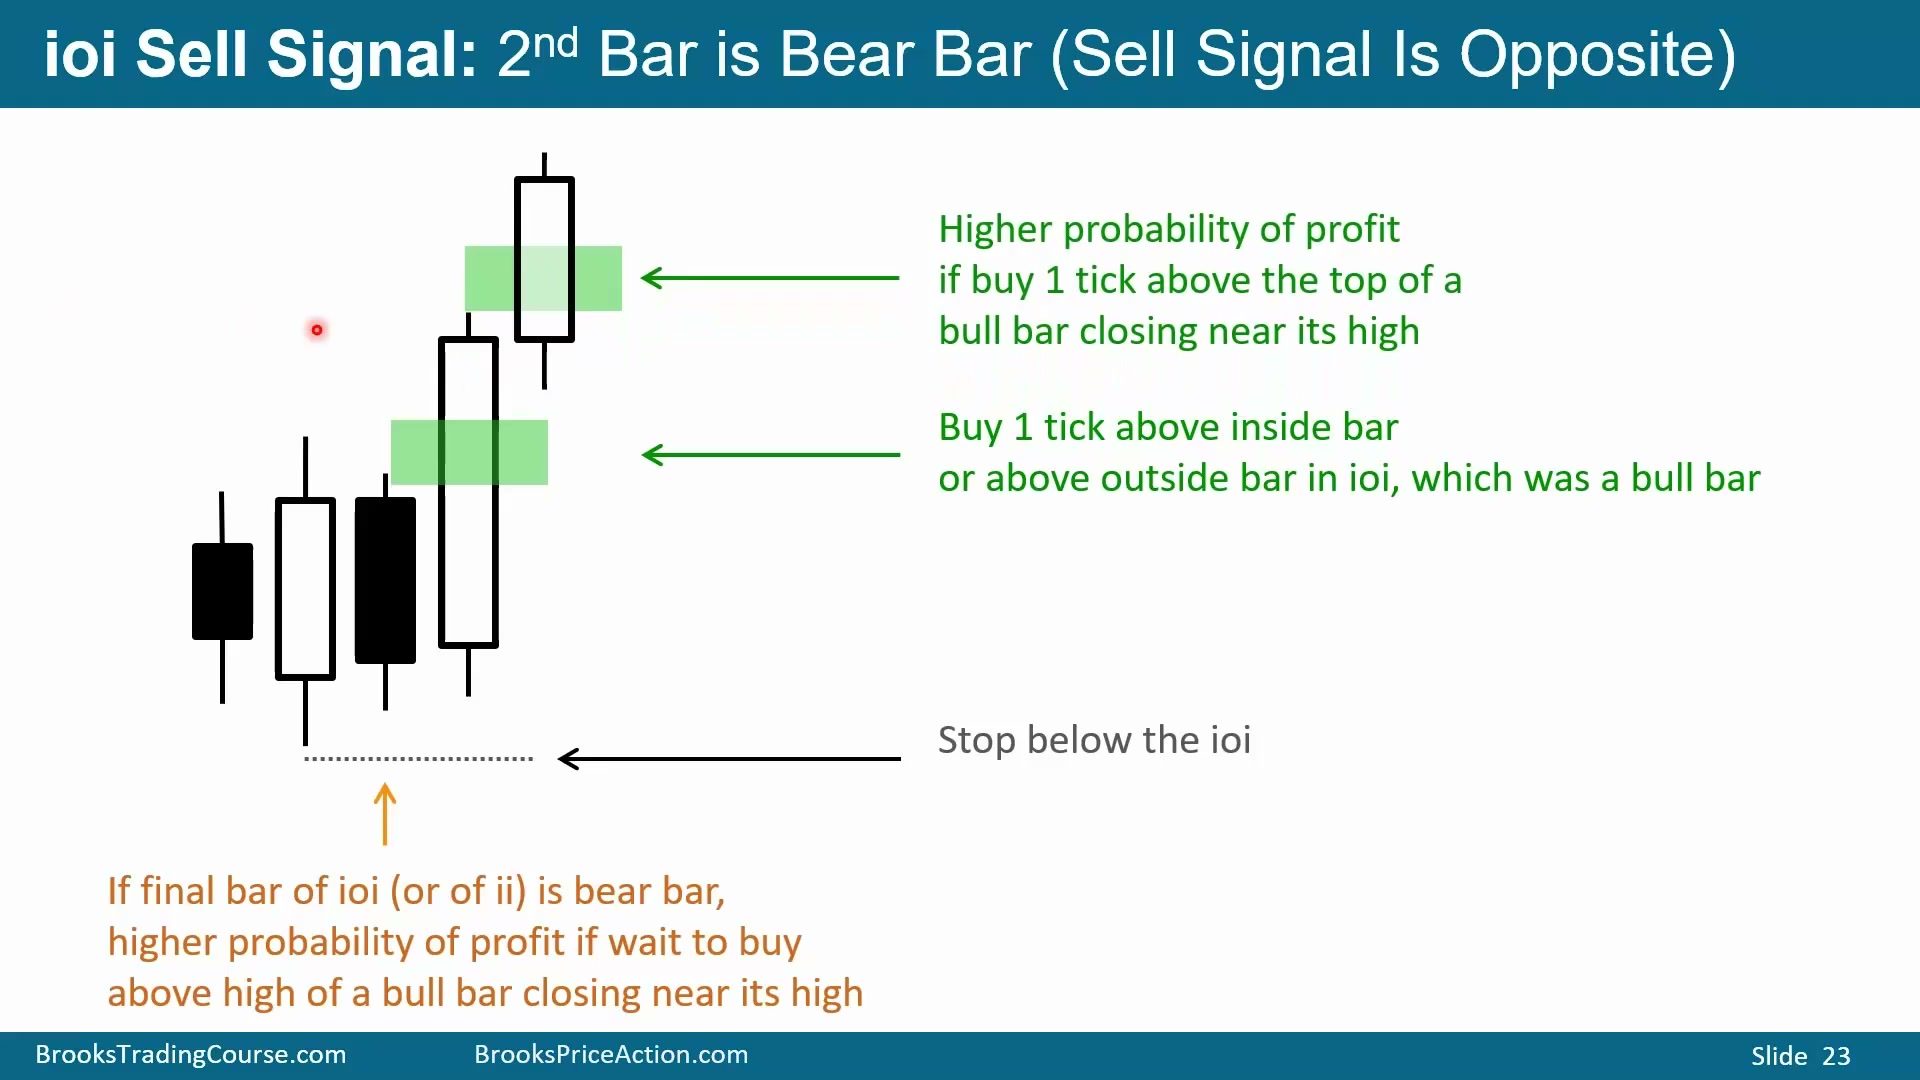
图中 ioi 没有向下突破,而是向上突破。一般来说,买在收在高点附近的牛 K 线上方,比买在熊 K 线上方概率更高。理论上可以直接买在 ioi 高点上方,但如果触发买入的信号 K 线是熊 K 线,这个买入概率较低。
更稳的做法是等待 entry bar。若突破后出现牛 K 线并收在高点附近,再在这根 K 线高点上方 1 tick 或 1 pip 买入。若最初没有向上,而是跌破 Inside Bar 低点,则可以按 ioi 向下突破卖出。BreakOut Mode 不偏向某个方向,方向要由突破质量和背景决定。
等待 entry bar 的代价仍是风险变大。买在 ioi 高点上方,止损到模式低点距离较小;等牛 entry bar 后再买,入场更高,止损仍可能要放在模式低点下方。但如果原始信号是熊 K 线,这个额外成本常常值得。
ioi里常同时包含Micro Double Top和Micro Double Bottom
Time: 31:45
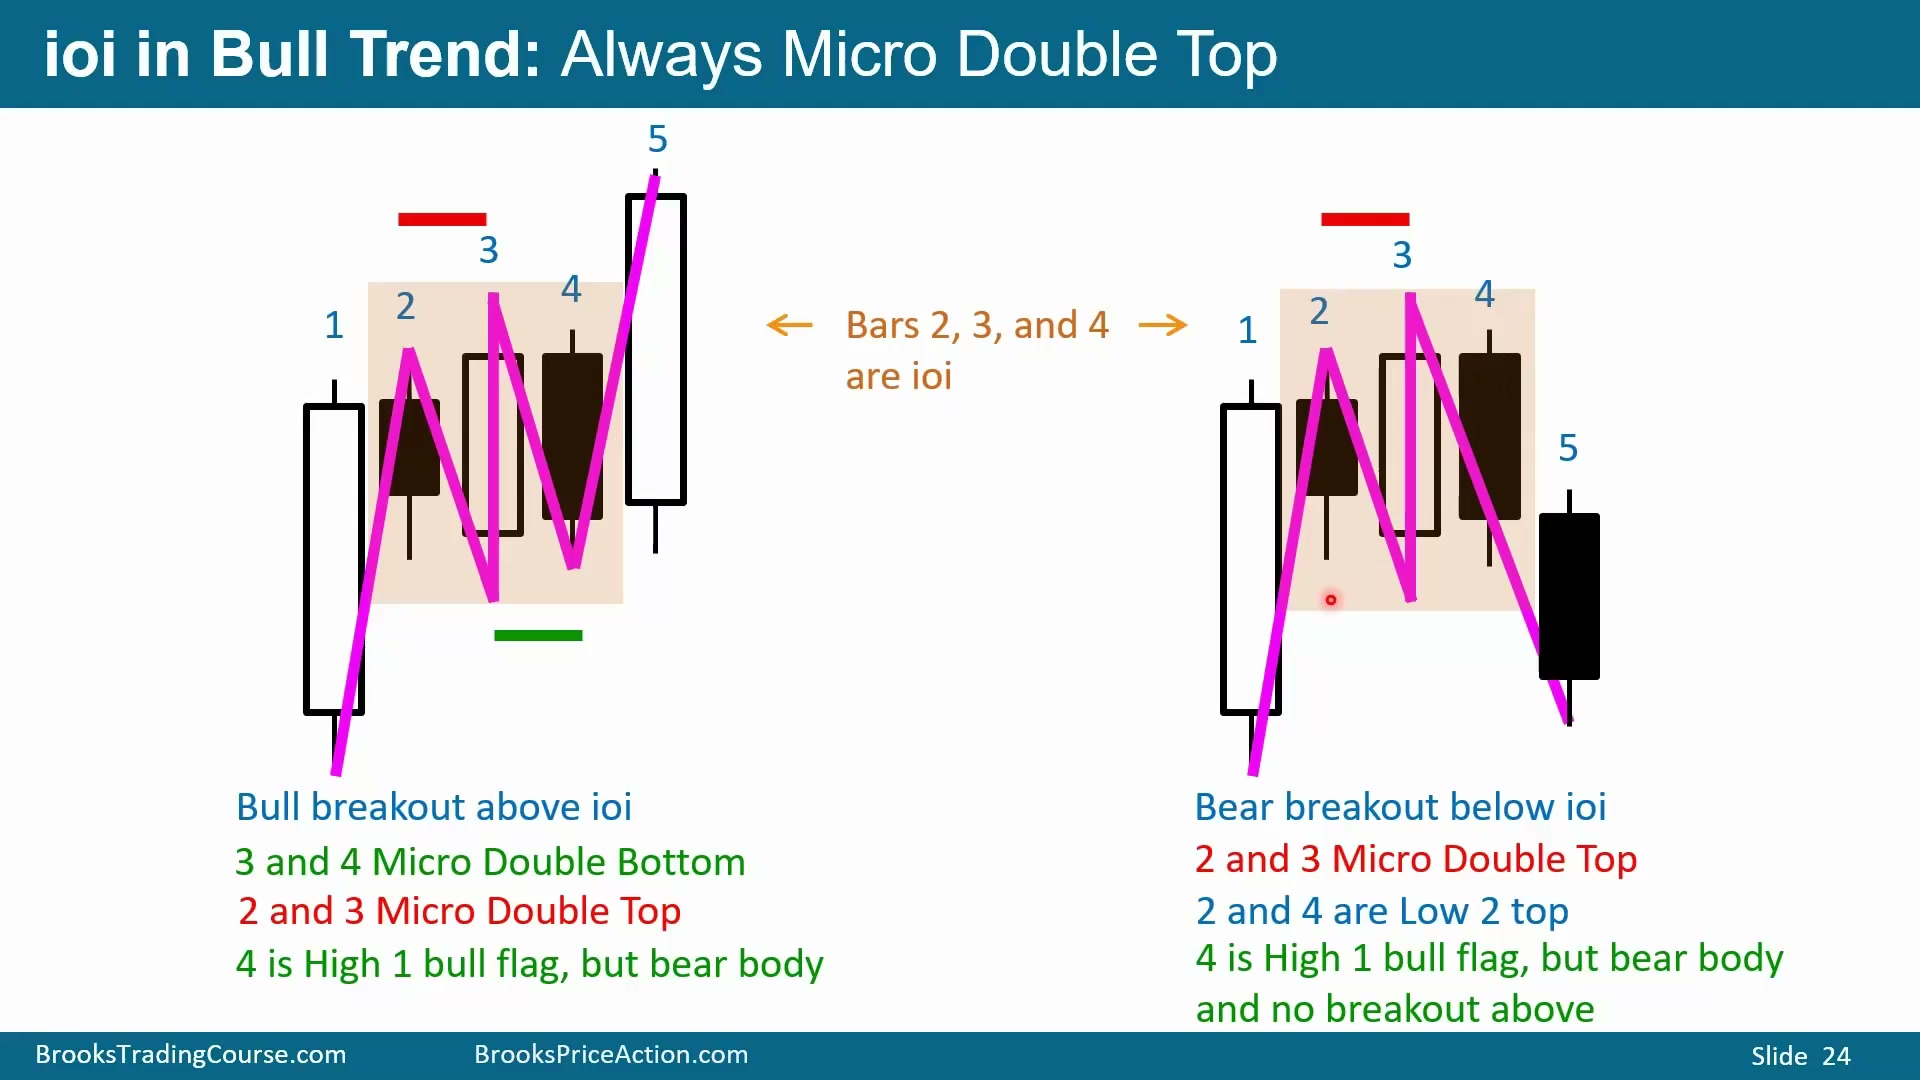
图中的五根 K 线里,第 2、3、4 根构成 ioi。左侧例子向上突破,右侧同类结构向下突破。若第 4 根是收在低点附近的熊 K 线,卖在其下方合理;若想买在熊 K 线上方,则概率较低,最好等待更强牛 K 线。
ioi 内部通常有 Micro Double Top 和 Micro Double Bottom。价格先上后下,再上后下,或者先下后上再下,说明市场正在多次尝试两个方向。BreakOut Mode 的本质就是小型交易区间,交易者等待最终突破。
若 ioi 出现在牛趋势中,也可以是 High 1 bull flag。可以买在 bear bar 上方、bull bar 上方,或等 breakout bar 收在高点附近后再买。右侧例子中,Bar 2 和 Bar 3 形成 Micro Double Top,Bar 2 和 Bar 4 又构成 Low 2 top;Bar 4 虽然也是 High 1 bull flag,但它是熊实体,因此买入概率较低。最终该例没有触发 High 1 买入,反而触发了 Low 2 顶部卖出。
ioi 的内部波动本来就代表买卖双方反复争夺。向上突破时,空头可能被困;向下突破时,多头可能被困。Micro Double Top 和 Micro Double Bottom 让这种争夺更清楚:市场不是从安静状态随机突破,而是在短时间内测试了两边边界,然后选择其中一边。
右侧例子中的 Low 2 top 也说明,ioi 可以同时包含反转逻辑和 flag 逻辑。若 High 1 买点没有触发,反而 Low 2 卖点触发,交易者应跟随实际突破方向。名称帮助准备,不替代触发条件。
OO是连续Outside Bar,最好有大实体而不是一堆doji
Time: 34:25
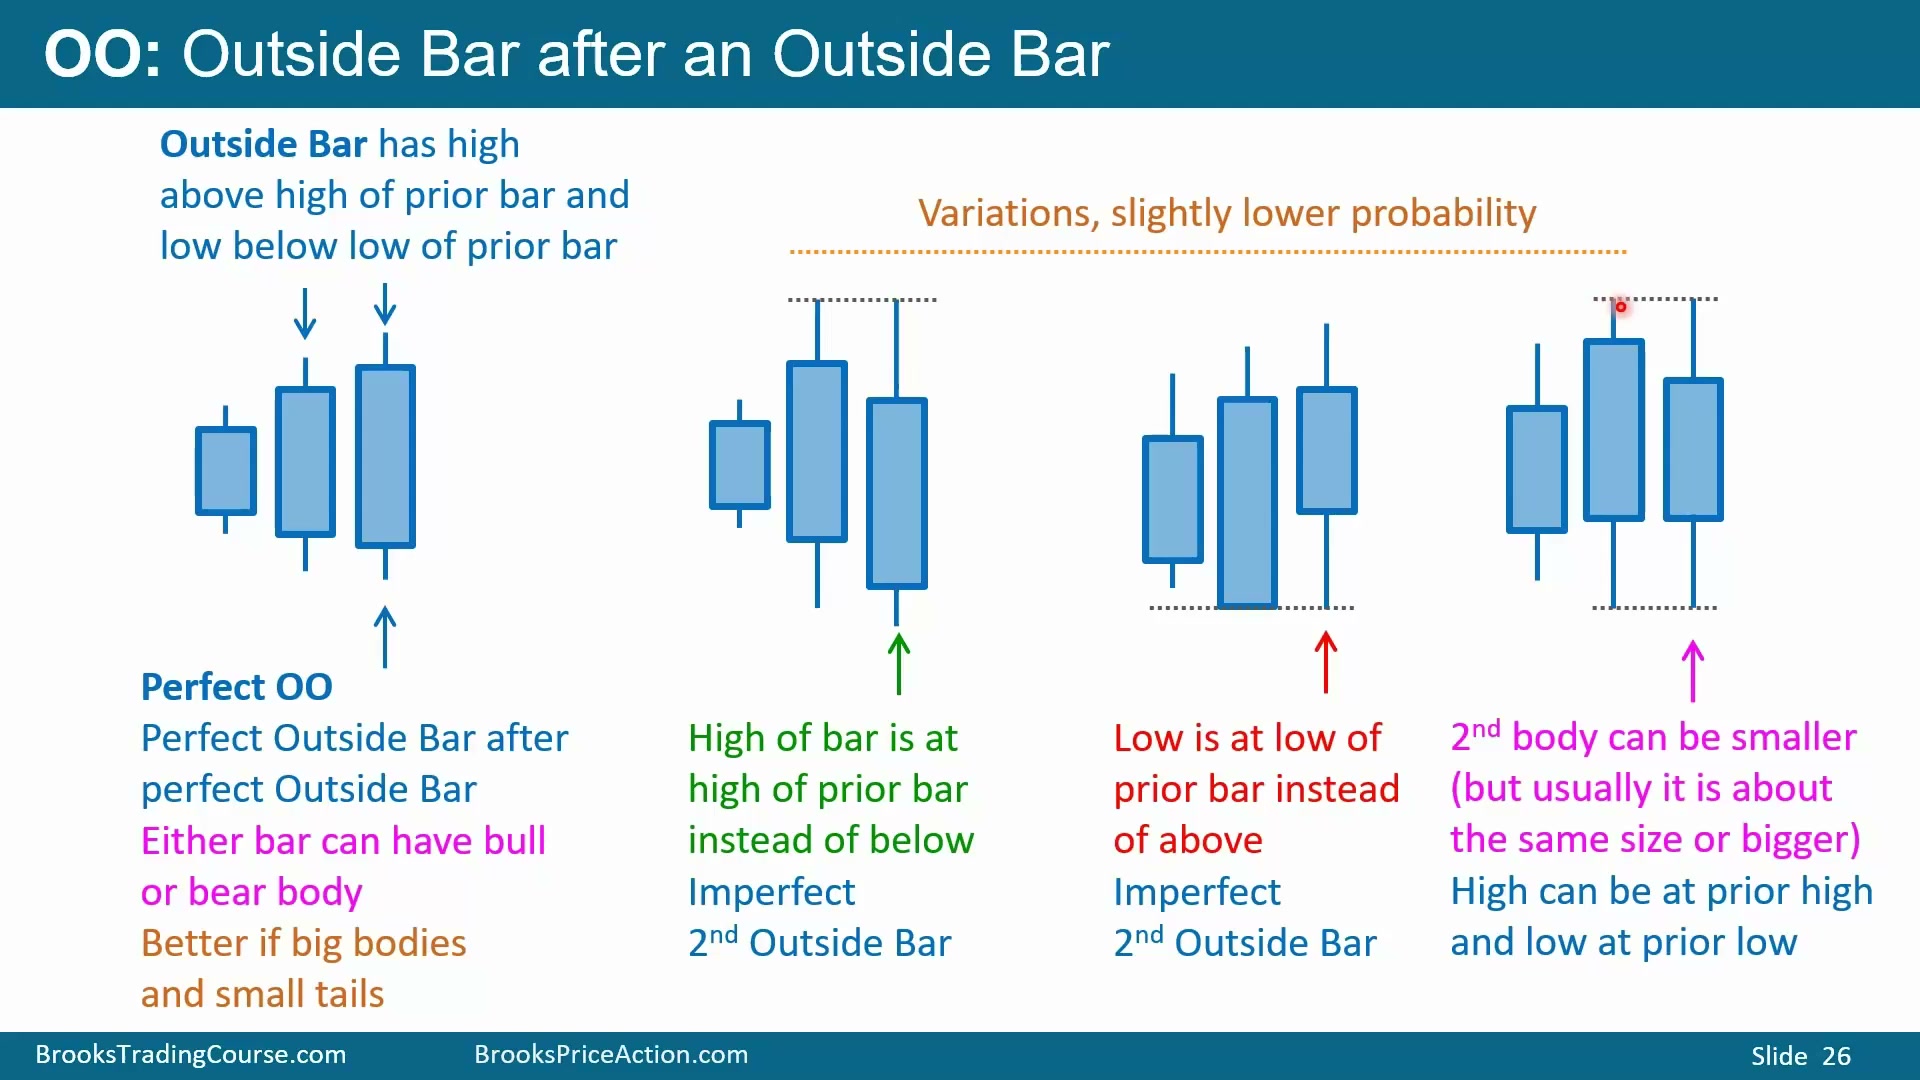
OO 是一根 Outside Bar 后接另一根 Outside Bar。完美 OO 中,后面的低点更低、高点更高。K 线实体是牛是熊不影响定义,但实体大小和影线很重要。如果三根 K 线都是 Tight Trading Range 里的小 doji,这是 Limit Order Market,不适合在上方买或下方卖。
若三根 K 线实体较大、影线较小,例如大牛 K 线、大熊 K 线、大牛 K 线,交易者更愿意在最终大牛 K 线上方买入。OO 也有变体:高点相等或低点相等仍可算 OO,只是没有完美 OO 清晰。第三根 Outside Bar 若与前一根高度完全相同,也可以符合定义。
OO 的风险是范围经常很大。大实体说明双方都曾积极推动价格,但连续 Outside Bar 也会把模式高低点拉宽。若要在第三根上方买或下方卖,止损通常要放到另一侧,仓位必须相应减小。没有足够实体、只有一堆 doji 的 OO,不应因为名字相同就当作高概率突破。
OO连续困住多空后,第三次突破更有价值
Time: 36:05
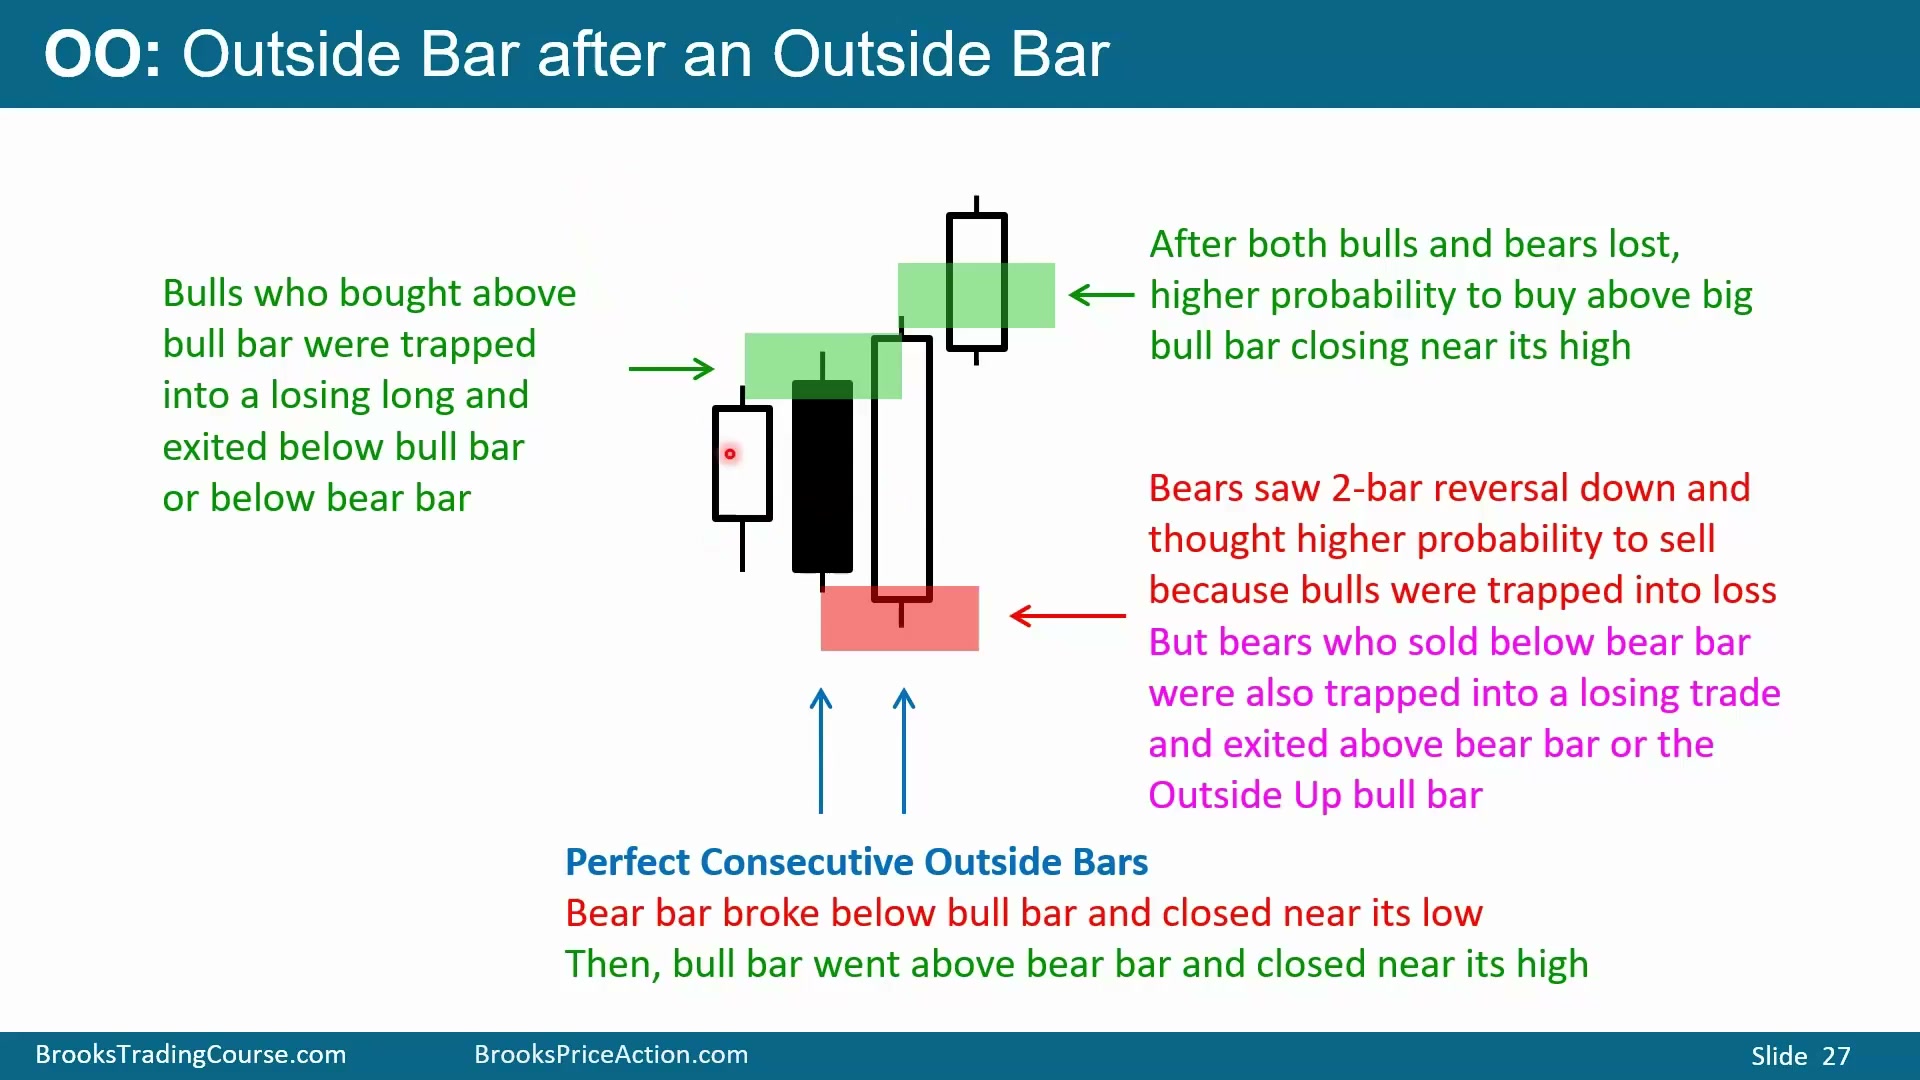
图中先有收在高点附近的大牛 K 线,随后更大的熊 K 线,再接更大的牛 K 线。如果背景是牛趋势,一些交易者会买在第一根牛 K 线上方,并在其低点下方或后续熊 K 线低点下方出场;另一些交易者看到失败买入和 Outside Down 后会反手做空。
随后价格又突破回牛 K 线高点上方。结果是先困住买在上方的多头,再困住卖在下方的空头。多头亏损、空头也亏损之后,第三次突破的成功概率提高。此时若出现收在高点附近的牛 K 线,买入更合理。它可以是牛趋势中的 OO bull flag,也可以是熊趋势末端的 OO bottom。若要买,最好买在收在高点附近的牛 K 线上方。
第三次突破更有价值,是因为前两次已经制造了 trapped traders。第一次向上让早买多头被困,第二次向下又让追空空头被困;第三次再向上时,空头回补和新多头买入可能叠加。若背景是牛趋势或底部反转,这种叠加能让 OO 的后续 move 更强。
但如果第三根 K 线很大,风险也会更大。即使概率提高,也不能用正常仓位硬做;仓位要按模式另一侧止损距离调整。好的 OO 仍然必须通过仓位控制进入 Trader’s Equation。
OO的第三根K线大,仓位通常要更小
Time: 38:05
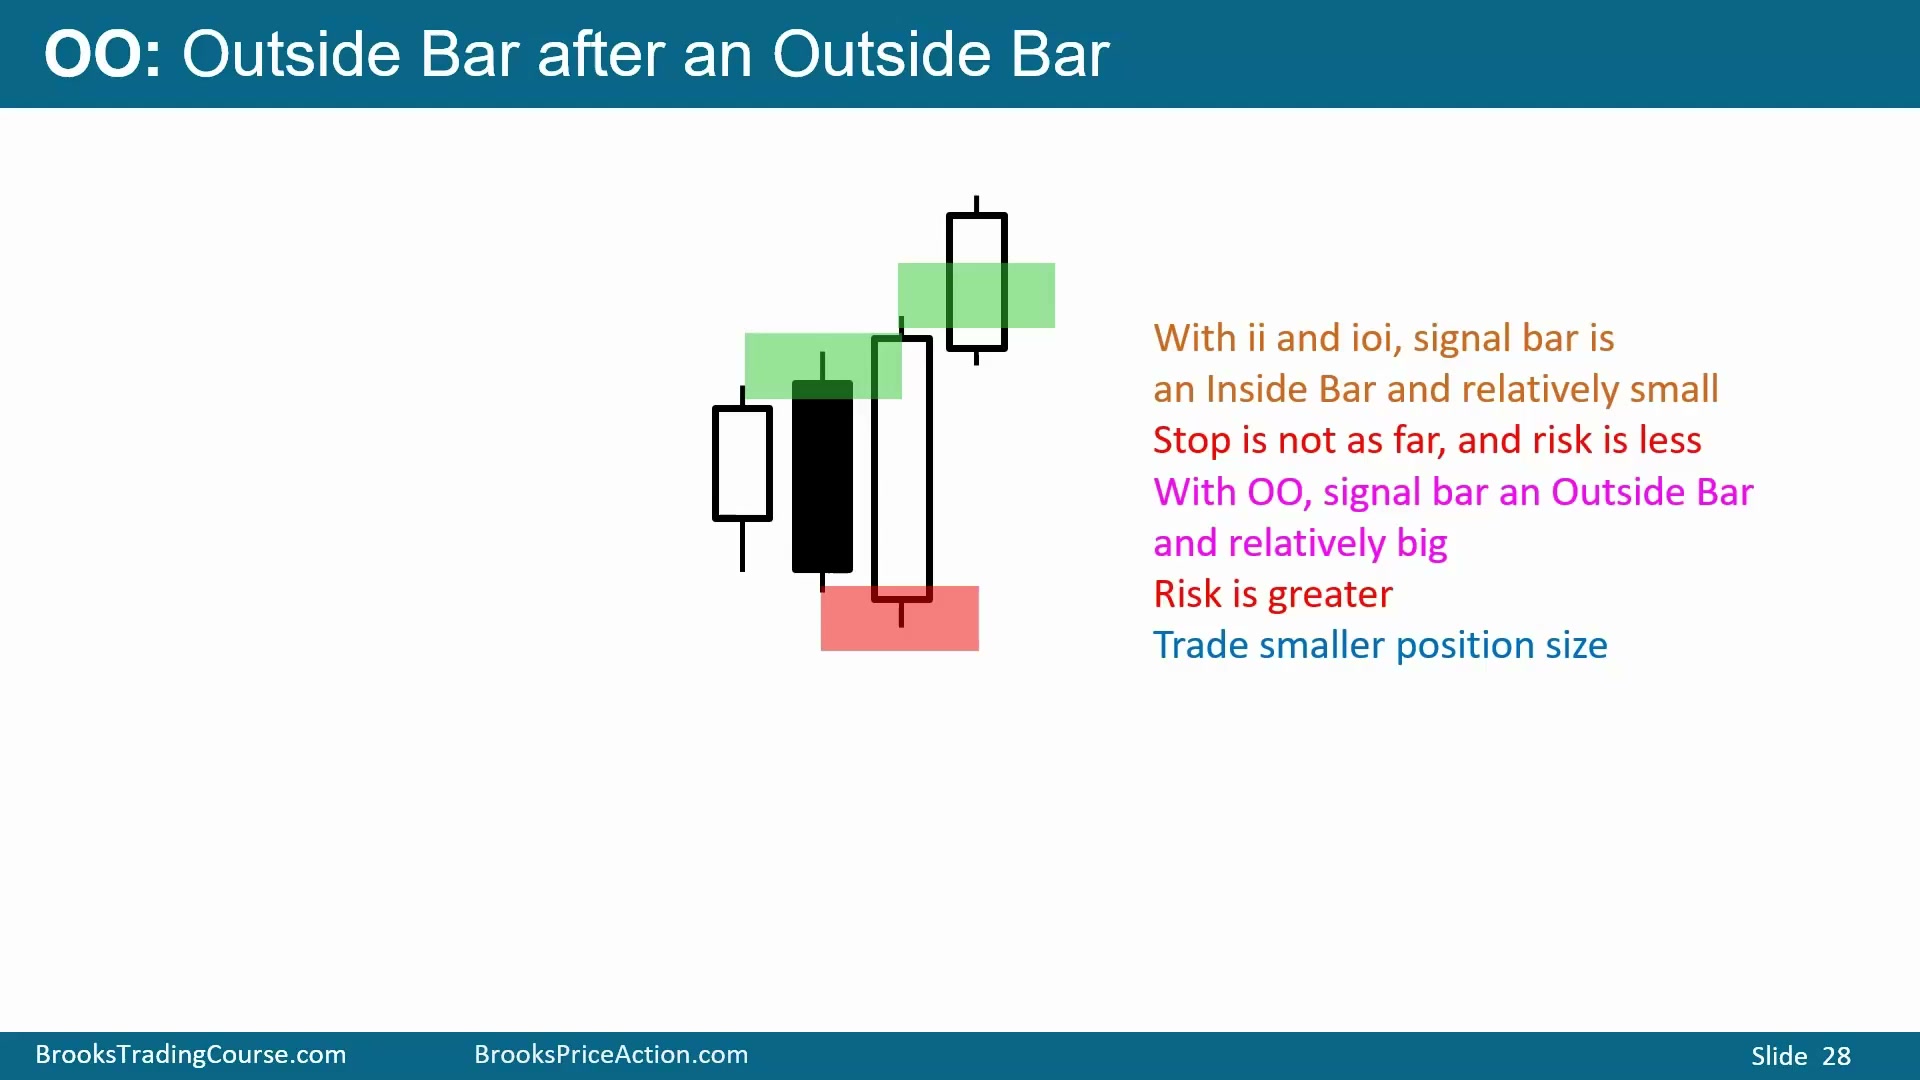
OO 和 ii、ioi 的重要差别在于第三根 K 线。ii 和 ioi 的第三根通常是 Inside Bar,范围较小,因此止损不远,风险相对小;OO 的第三根是第二根 Outside Bar,通常范围大,止损更远,风险更高。
任何交易的美元风险都应保持可控。如果 OO 的止损距离更大,就必须降低仓位,避免单笔交易风险超过平时标准。高概率形态并不允许交易者忽略仓位大小。
完美OO比不完美OO更容易形成高概率第三突破
Time: 38:55
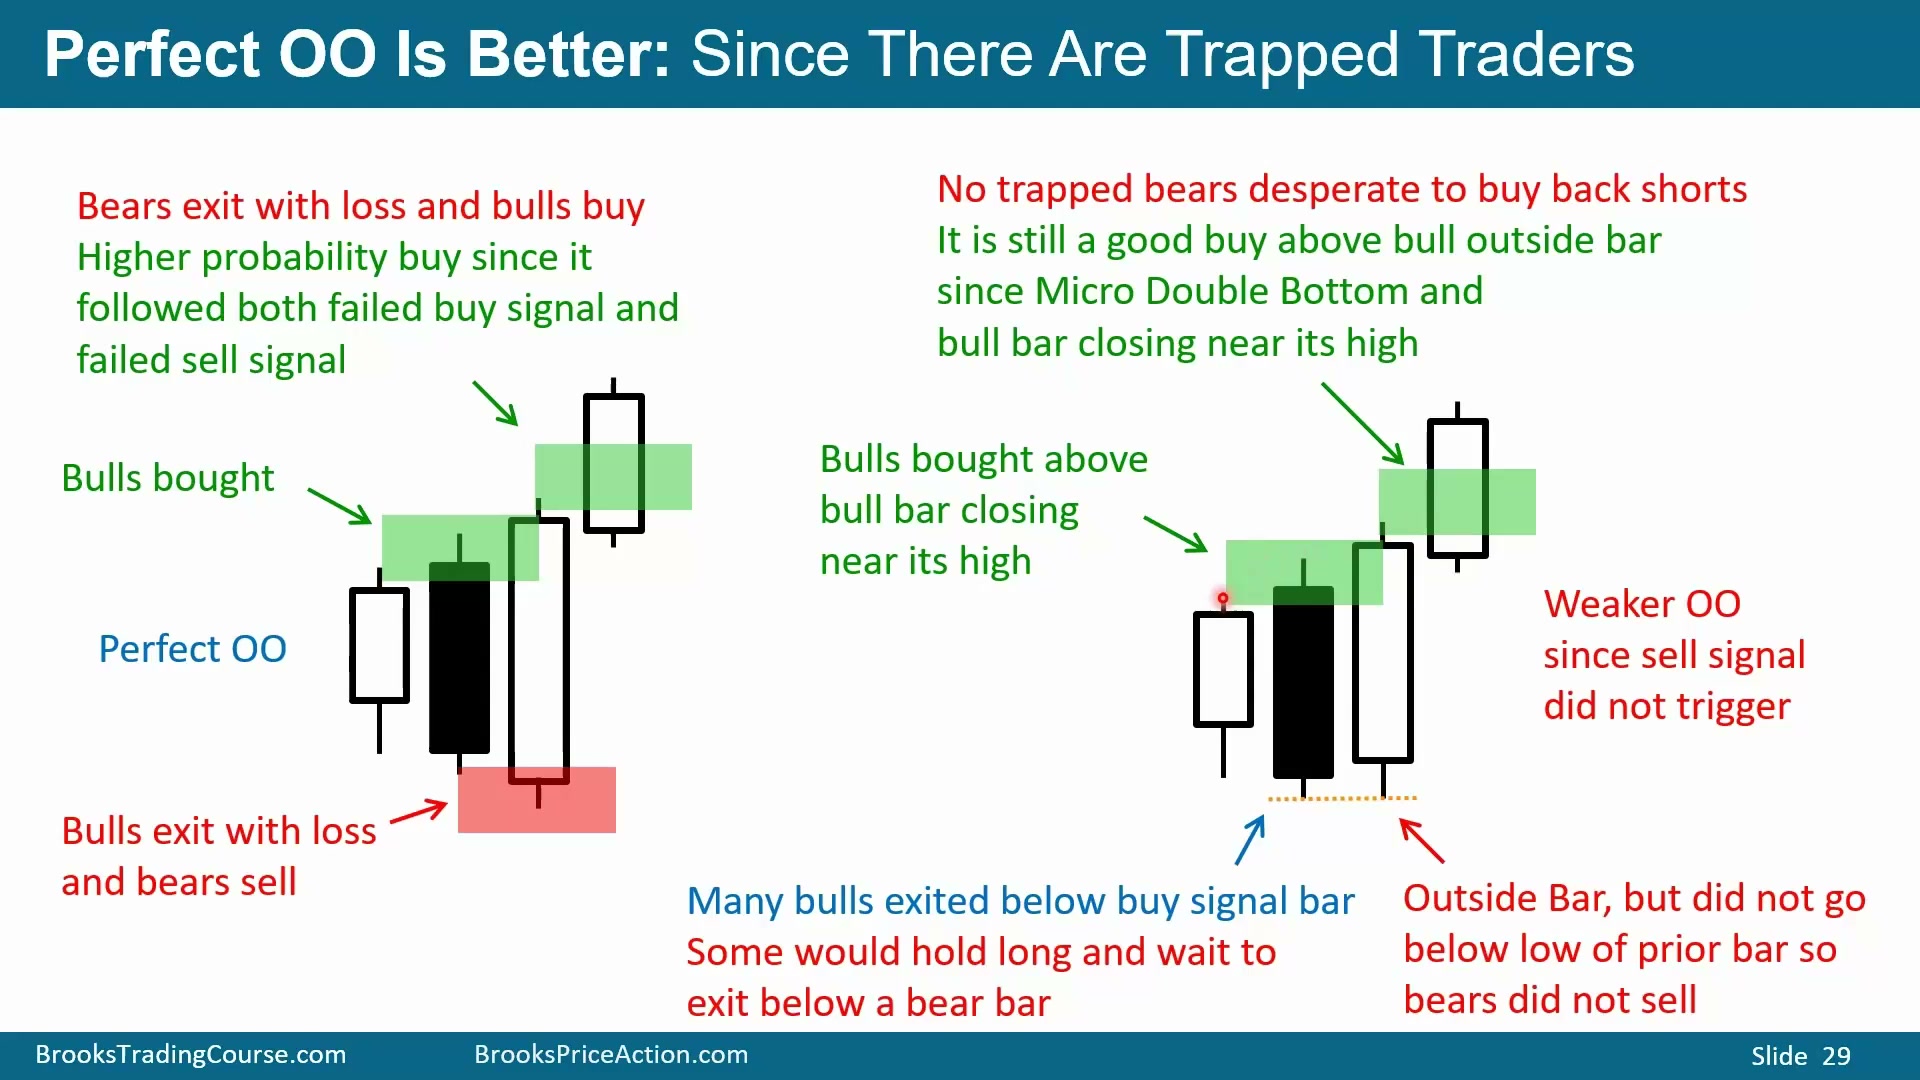
不完美 OO 可能触发了买入,却没有触发卖出。例如某根低点没有跌破前一根低点,多头即使经历回落,也没有被标准止损打出,很多多头仍然持仓。这种结构没有同时困住多空,后续突破的概率优势较弱。
完美 OO 则不同。理论上多头买在牛 K 线上方,随后跌破熊 K 线让多头亏损;空头卖在熊 K 线下方,随后又向上突破让空头亏损。两边都被困住后,第三次向上突破更容易成为高概率交易。并不是必须做第一次买或第一次卖,是否做取决于背景;但一旦看到完美 OO 已经困住多空,再出现第二买点或强牛 K 线,买入质量会提高。若前面买入未被止损,可以加仓;若已被止损,也可以把它当作第二买入信号重新买。
相同高低点的三根K线可以同时是ii、ioi和OO
Time: 40:40
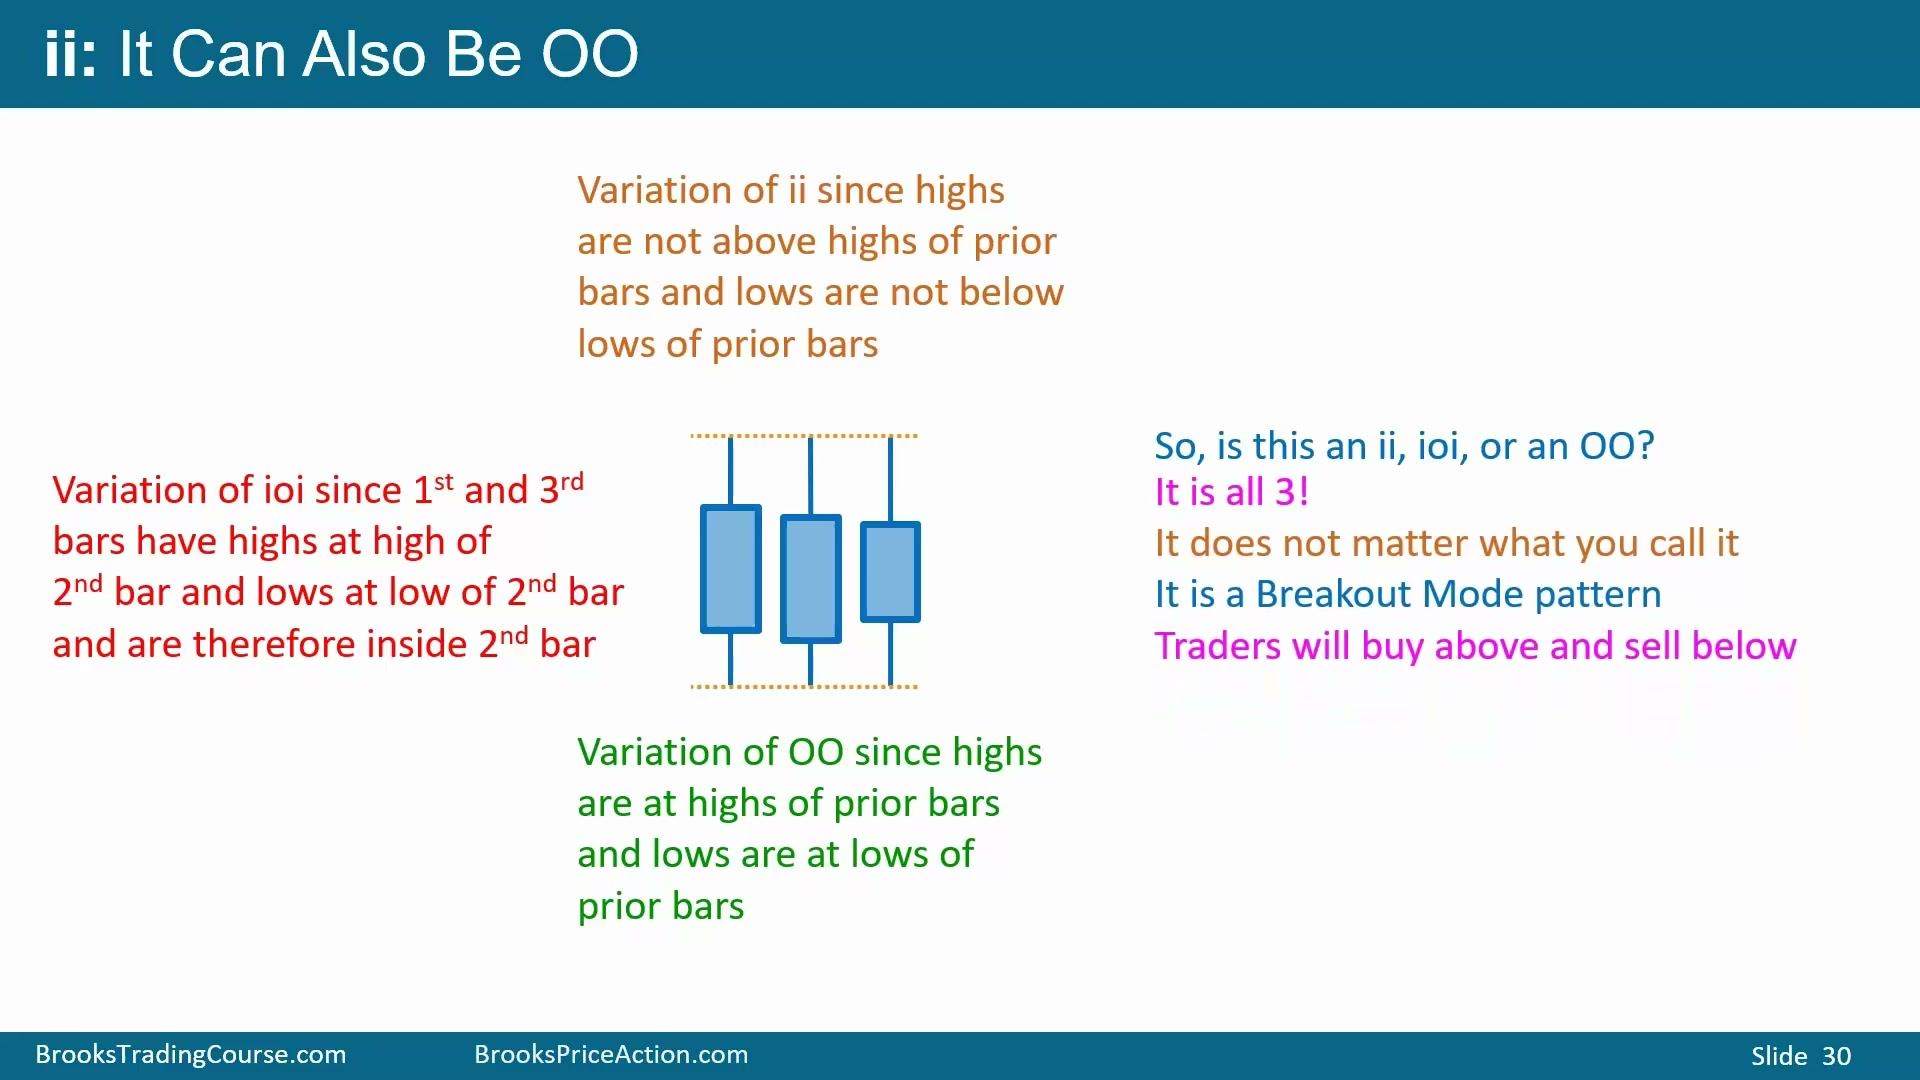
三根高点完全相同、低点也完全相同的 K 线,可以同时满足 ii、ioi 和 OO 的定义。它是 ii,因为后两根没有突破前一根高低点,都是 Inside Bar;它也是 ioi,因为中间那根既可视为 Inside Bar,也可因高点等于前高、低点等于前低而符合 Outside Bar 的宽松定义;它同样是 OO,因为后两根也可被视为连续 Outside Bar。
名称不重要。交易上真正重要的是市场横向停顿,处于 BreakOut Mode。交易者会在上方买、在下方卖,等待突破后的方向和质量。
这种极端相同高低点的结构也说明,定义只是帮助观察,不是交易本身。它可以被不同人命名成不同模式,但所有人看到的订单位置相同:高点上方有买入 stop,低点下方有卖出 stop。真正的 edge 来自突破后的 follow-through、背景和风险控制。
OO在小周期上通常是Expanding Triangle
Time: 42:10
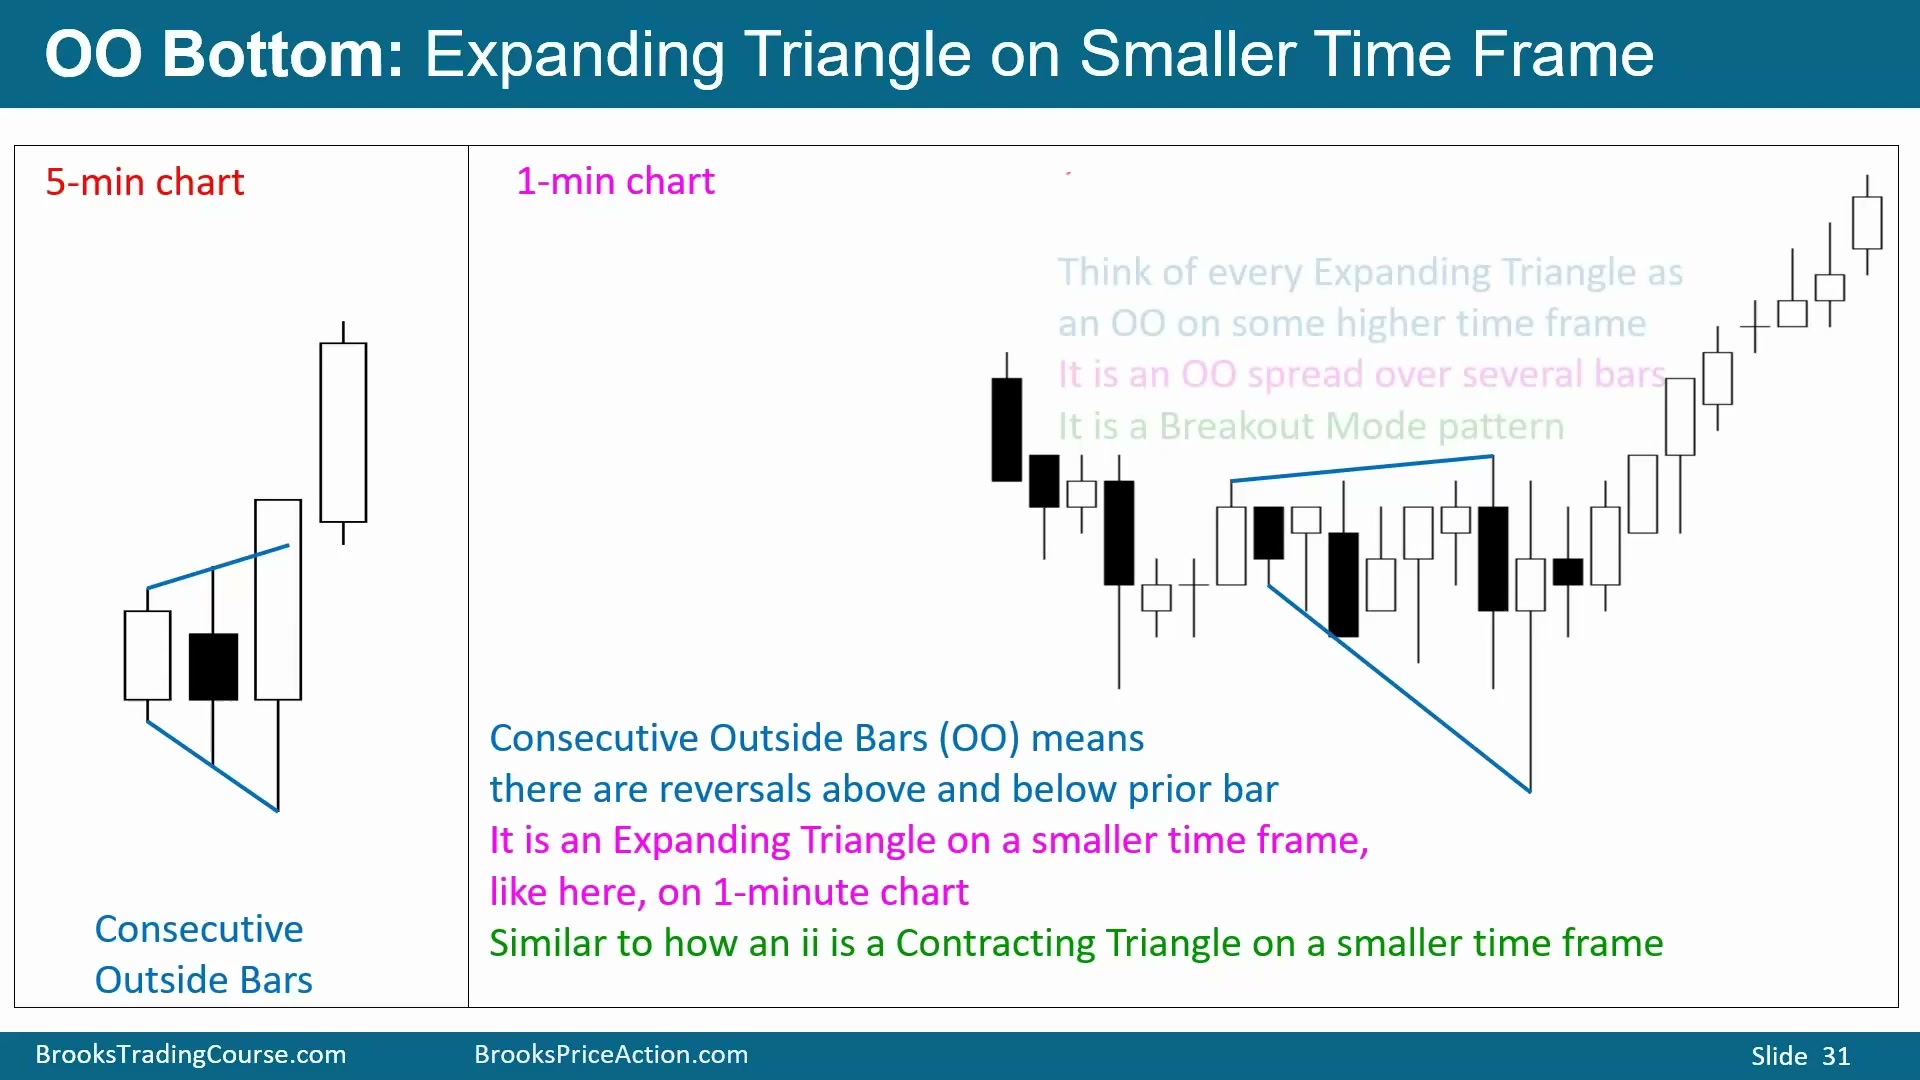
5 分钟图上的连续 Outside Bars,在 1 分钟图上通常会表现为 Expanding Triangle。它和 ii 的关系是镜像:连续 Inside Bars 在小周期上是收敛 Triangle,连续 Outside Bars 在小周期上是扩张 Triangle。
收敛 Triangle 和 Expanding Triangle 都是 BreakOut Mode。它们的交易意义相同:市场在横向竞争,交易者等待某个方向突破并观察是否有 follow-through。
小周期对应关系的价值在于理解结构,而不是增加复杂度。看到 5 分钟 OO 时,交易者不必一定切到 1 分钟图;只要知道背后通常是扩张三角,就能理解为什么双向假突破和 trapped traders 很常见。
60分钟OO对应5分钟扩张三角
Time: 42:55
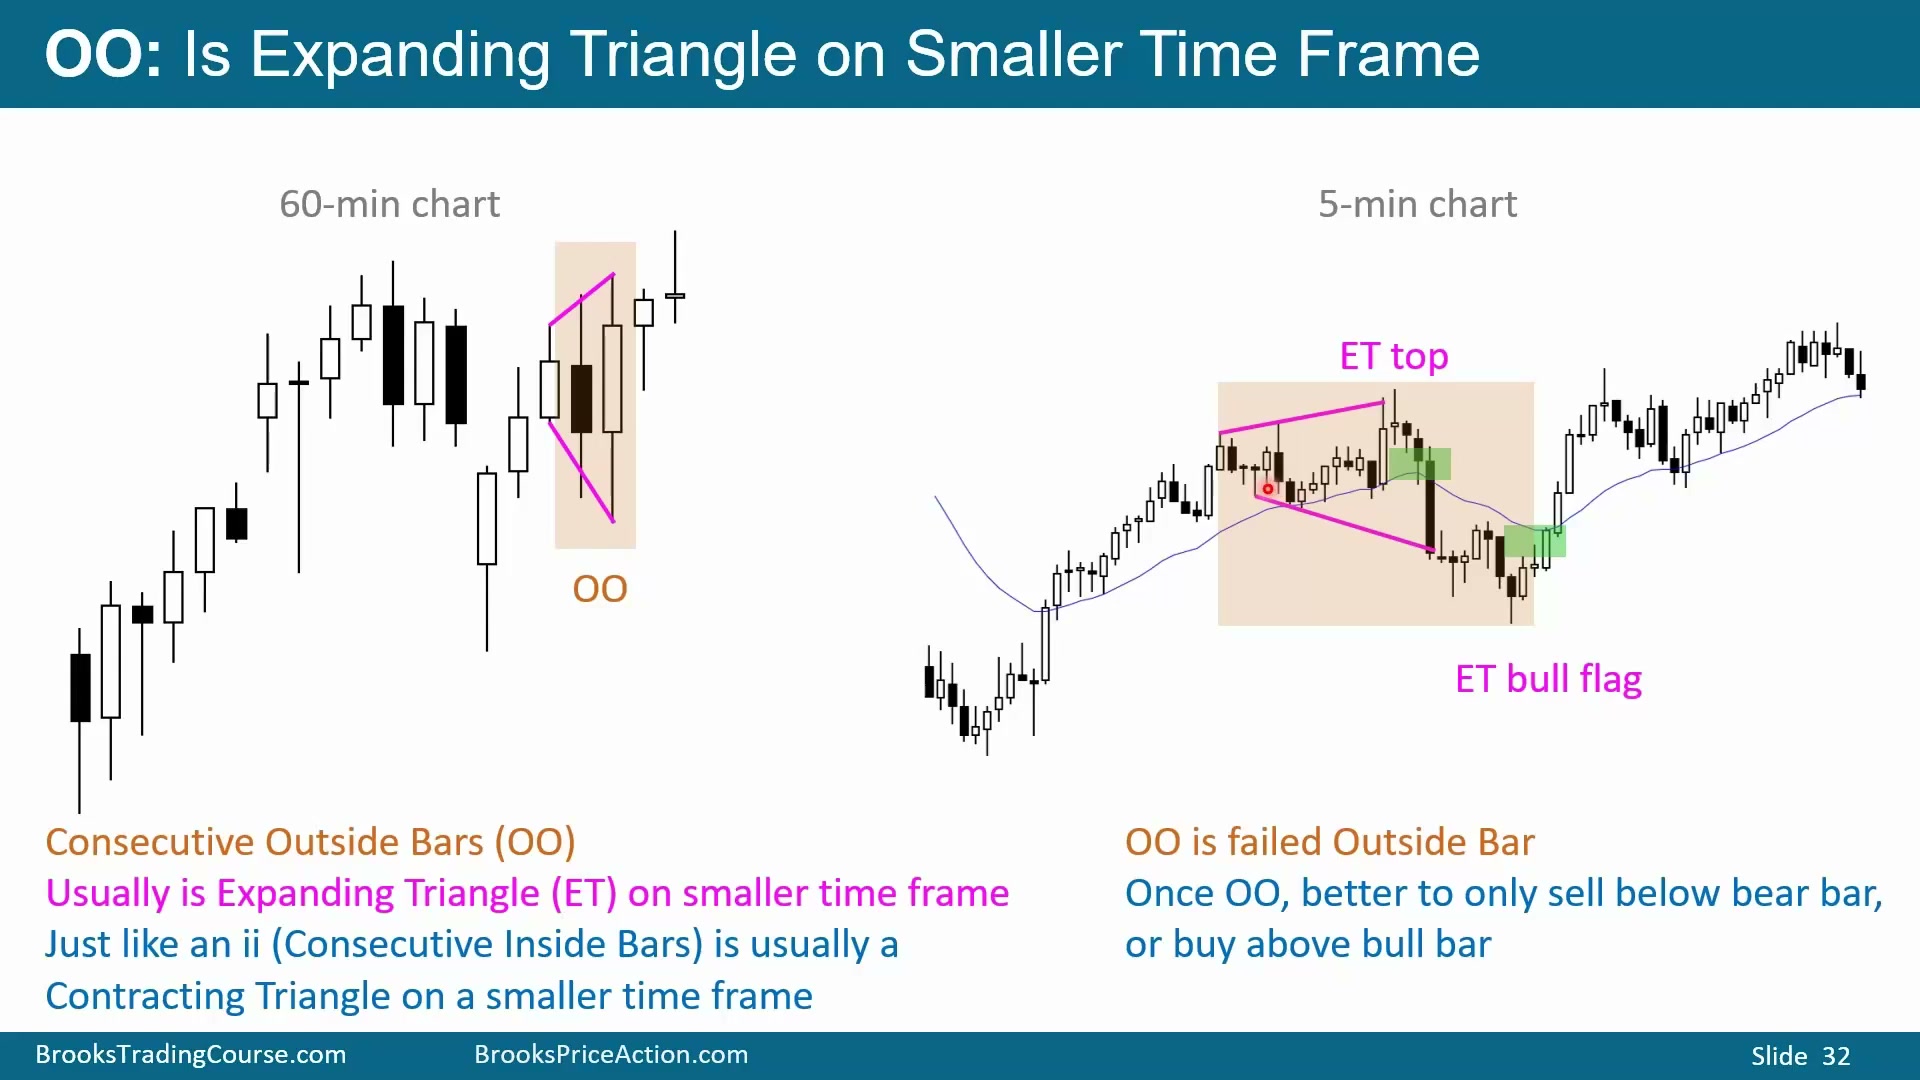
图中的 60 分钟 OO,应假设在更小周期上是 Expanding Triangle。5 分钟图中棕色框对应 60 分钟图中的相同两小时交易区间;高周期的 OO,展开后就是小周期上反复创新高、创新低的扩张结构。
理解多周期对应关系可以帮助确认模式性质,但不必为了交易去切换多个周期。当前图上的 OO 已经足够告诉你:市场处于 BreakOut Mode。
三种小型横盘模式的交易结论
Time: 43:25
ii、ioi 和 OO 都是 BreakOut Mode,可以是 bull flag、bear flag,也可以是反转模式。若出现在牛趋势顶部,它既可能向上作为 bull flag 继续,也可能向下成为顶部;因此上方买入、下方卖出都要准备。若出现在熊趋势底部,它既可能向下作为 bear flag 继续,也可能向上成为反转;因此下方卖出、上方买入都可能成立。
ii 是连续 Inside Bars;ioi 是 Outside Bar 前后都有 Inside Bar;OO 是连续 Outside Bars。名称帮助识别结构,但交易判断始终回到背景、信号 K 线、突破质量、止损距离、概率和风险回报。