al-brooks-course
14 - 10 Emini Scalps on 15-Second Chart
Readable self-study lecture notes for 14 - 10 Emini Scalps on 15-Second Chart.
Source Media
15秒图上的极端剥头皮只适合高胜率交易者
Time: 00:26
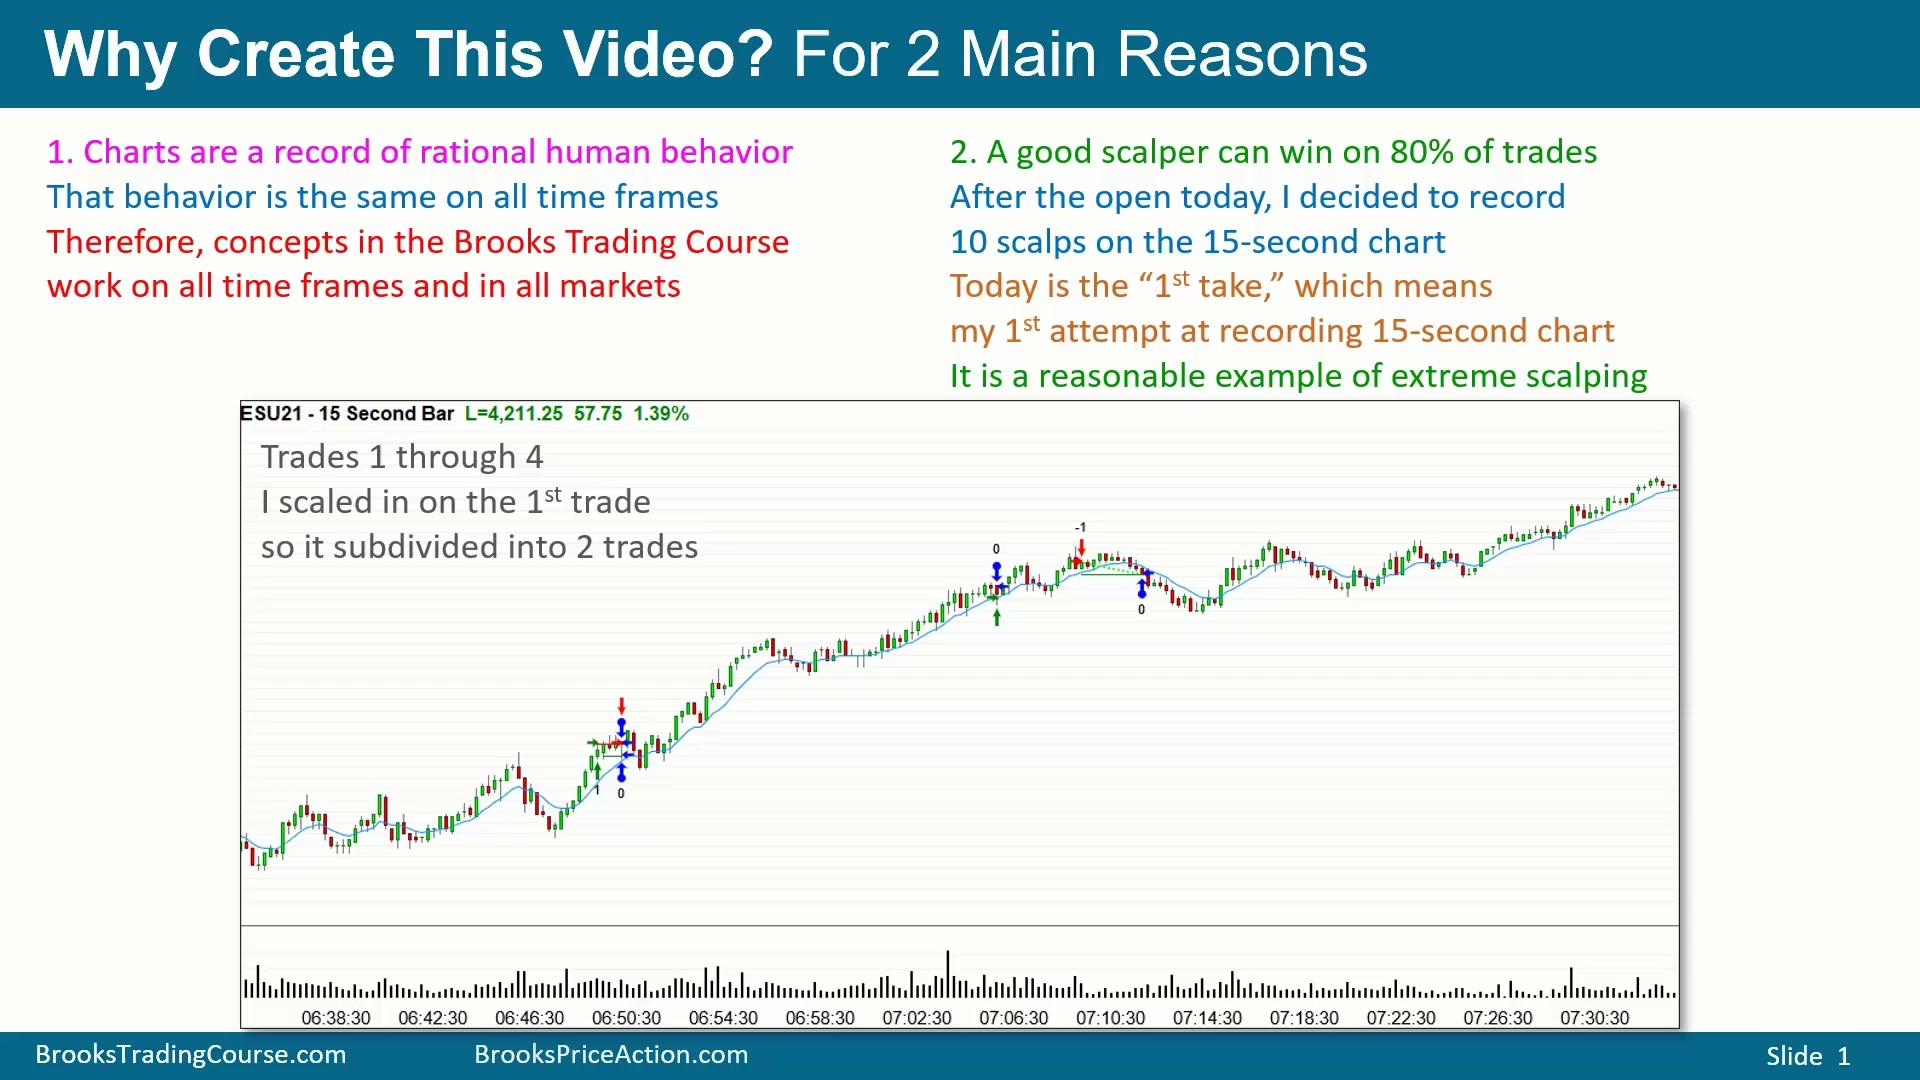
这节课用 Emini 15 秒图展示一次真实交易日里的 10 笔连续剥头皮交易。每根 K 线只有 15 秒,价格变化和订单成交都非常快;有些交易在下单后几秒钟就成交,最长的交易也只是几分钟。为了让案例容易比较,所有目标都只设为 1 点。许多交易本来可以持有更大的利润,但这里的重点是展示标准价格行为技术在极短周期上仍然成立。
使用 15 秒图有两个核心目的。第一,图表是理性人类行为的记录,而人类在任何市场、任何周期上的交易逻辑相同;因此课程中的价格行为概念不只适用于 5 分钟图,也能在 15 秒图上出现。第二,优秀剥头皮交易者可以取得很高的胜率,80% 到 90% 的胜率并非不可能。不过这不是鼓励多数人这样交易,而是说明在足够熟练、足够快、错误极少的前提下,小目标交易可以成立。
图中左下角的前两笔其实是同一组交易:先买入,价格再低 1 点时加仓买入,然后第一笔保本出场、第二笔获得 1 点利润。这是强反转后的顺势买入。市场在 Wedge Top 之后强力向上反转,强到这种程度时,通常还会继续向上;即使先回落,第一次向下反转也很可能失败。若反转后进入交易区间,而不是立刻发展成牛趋势,低位再买一笔后,价格通常会回到区间上方或原始买入价附近,因此可以用限价单在低 1 点处加仓。
第三笔是上涨过程中高位卖出 1 点。市场仍在强势上涨,但开始出现一些熊 K 线,说明短线回调可能足够给出一个剥头皮利润。这里不是在预测大反转,而是在上涨延伸后高位挂限价卖单,争取很小的回落空间。订单刚放上去几秒钟就成交,体现了 15 秒图交易的速度。
第四笔也是卖出反弹。图中的上涨已经出现三推,并开始出现回调;在这种环境下,买回调和卖反弹都可能获利。本例选择卖反弹,依据是出现收在低点附近的熊 K 线。因为前面刚有三四根不错的牛 K 线,市场未必会立刻直线下跌,可能先横盘。如果价格涨到这根熊 K 线高点上方,计划是继续卖高,押注市场正在从上涨转入小型交易区间。
15 秒图不适合慢慢等待止损入场。K 线最后一秒可能突然多走一两个 tick,用 stop 进场很容易错过或滑点,所以多数订单要么是市价单,要么是限价单。5 分钟图上,多数交易者更适合用 stop 入场;但在这么快的周期里,限价和市价执行更现实。第四笔的背景可以看成 15 秒图上的 Lower High Major Trend Reversal:熊 K 线之后出现三小推上涨,形成小型 Wedge rally 到 Lower High Double Top,随后又有收在低点附近的熊 K 线。图左侧价格梯上可以看到 1 点止盈限价单和上方 3 点止损;若市场继续上冲,可以再卖高,并根据后续价格行为调整止损。
剥头皮的风险回报差,必须靠极高胜率补偿
Time: 07:10
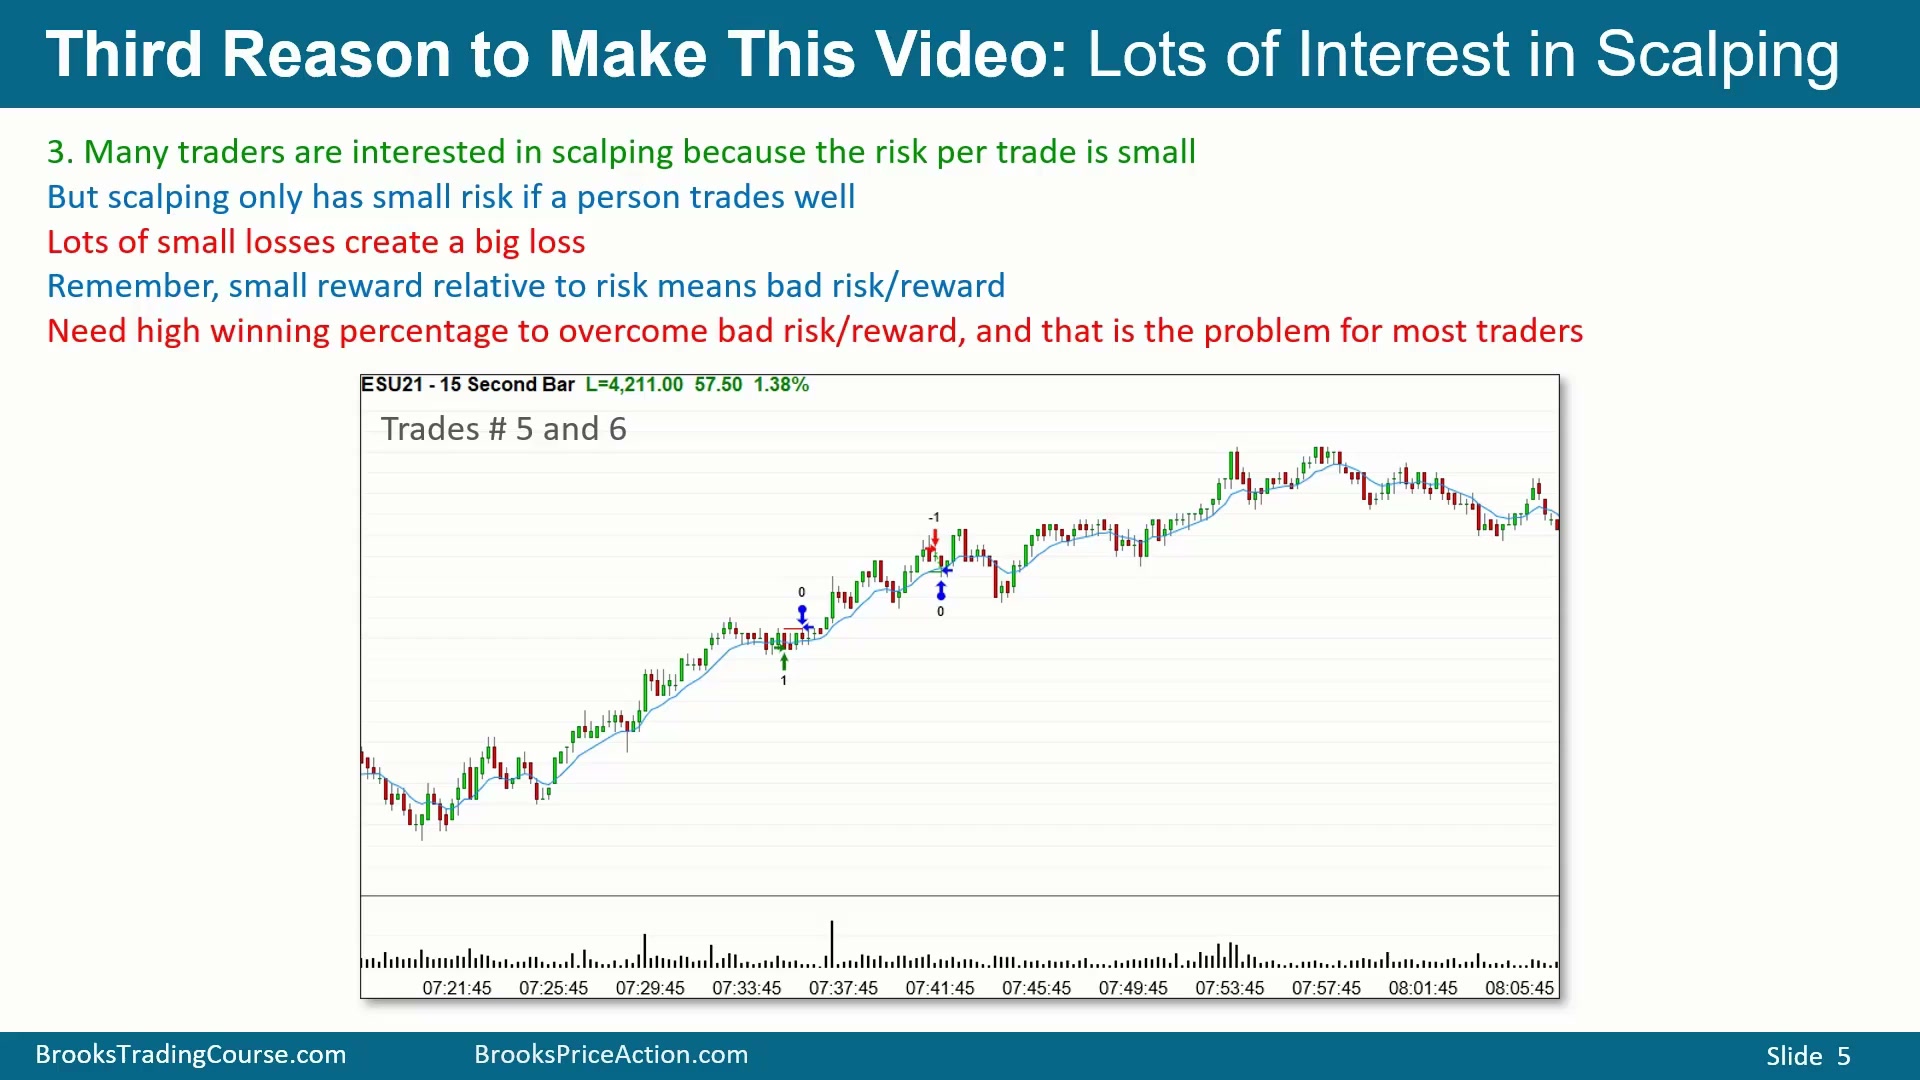
剥头皮之所以吸引很多交易者,是因为表面风险看起来小。但小目标并不自动等于小风险。若连续出现许多小亏损,结果会迅速变成一笔大亏。剥头皮交易的 reward 相对 risk 很小,风险回报天然不好;能否赚钱取决于概率,也就是能否在很短时间里做出大量正确决策,并且尽量不犯错。多数交易者的问题不是找不到交易,而是无法足够快、足够稳定地做出高质量判断。少数几个错误就足以把小利润全部抹掉。
第五笔是顺着牛趋势买入。牛趋势中可以买限价回调,也可以买市价;如果行情开始转入交易区间,也可以卖出,但卖出必须尽量卖在高位。图中的回调更像 bull flag,而不是强反转。此前市场突破 Double Top 后又回测 Double Top,由此形成向上的 Measured Move 目标;现在价格没有快速下跌,而是在横向整理,因此继续买入、押注市场至少测试 Measured Move 目标,是合理的。实际止盈限价单放在 Measured Move 目标下方很多,降低了成交难度,随后很快获得 1 点利润。
第六笔是上涨中卖出限价单。强牛趋势里做空很难,必须读图足够好,而且必须卖得很高。更理想的情况是市场已经开始出现回调,并出现熊 K 线。这里在熊实体出现后立即挂限价卖出,甚至市场还没有跌破那根 K 线的低点就已经成交。过去约 20 根 K 线里已有几次回调,当前熊 K 线也算不错,因此可以预期至少有一小段回落空间。该笔交易在不到一分钟内完成 1 点利润。
好交易可以持有更久,但示范账户以1点为目标
Time: 10:15
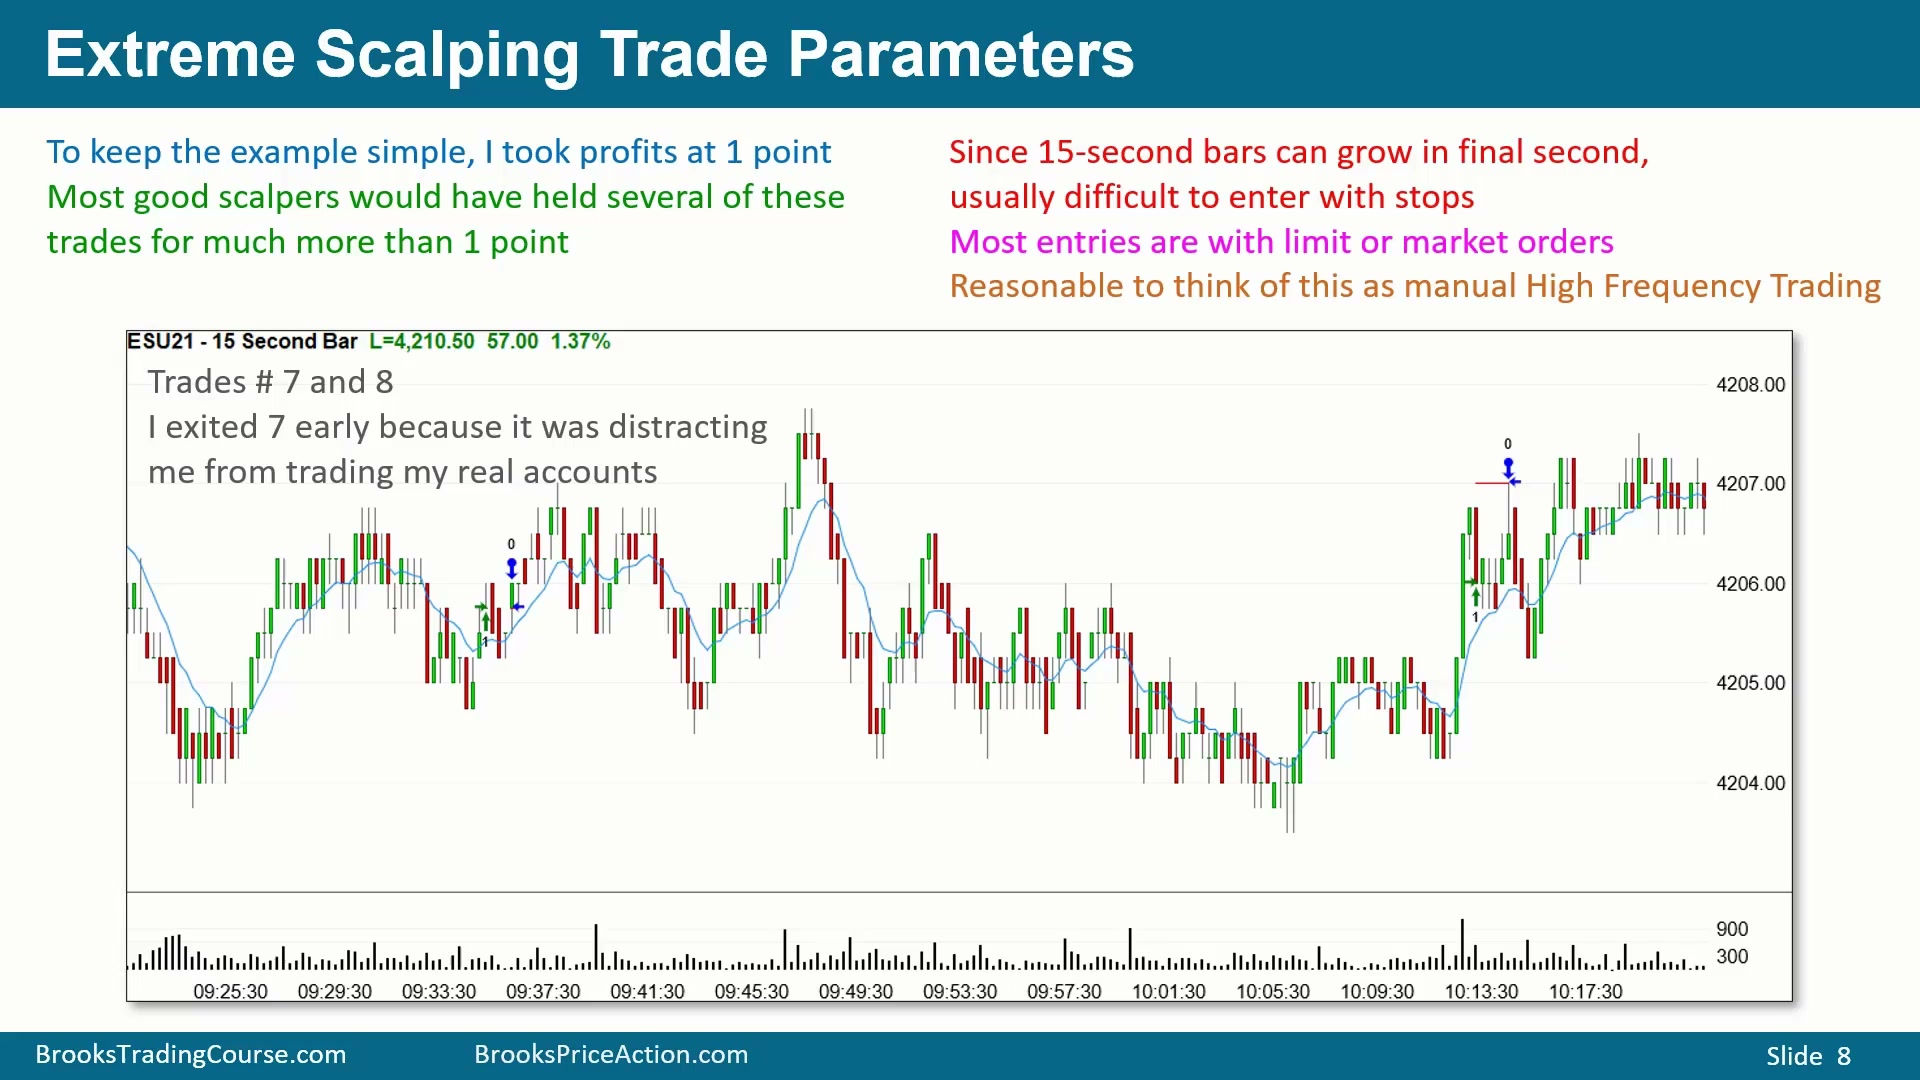
整段示范为了保持简单,只做 1 点剥头皮;实际优秀剥头皮交易者会把其中几笔持有更久,赚取远大于 1 点的利润。当天多数进场仍是限价单或市价单。
第七笔位于图左侧:Wedge selloff 后出现不错的向上反转,并形成 Higher Low。这样的结构通常会至少有第二腿上涨;尤其在连续两根牛 K 线之后,买入是合理的。但这笔交易同时在 2 分钟图和右侧 5 分钟图上也出现了不错的买入背景,注意力转向真实账户后,模拟账户的持仓反而成为干扰,所以很快在价格层面保本出场。由于仍然支付佣金,TradeStation 会把这笔记为亏损交易。
第八笔位于图右侧:市场看起来正在突破 bull flag,并尝试恢复牛趋势。可以直接市价买入,因为测试高点的概率不低;但这里更偏好用限价单买一点回调。止损放在 3 点下方,低于屏幕左侧可见 K 线,因此图中看不到止损单。因为 15 秒图上影线非常突出,临时切到 1 分钟图检查更平滑的结构;若某个周期满是影线,说明短线反复较多,换一个较高周期有助于判断。
模拟账户的限价成交由 TradeStation 算法判断,不是每次触碰价格都一定成交。多数情况下,如果模拟账户显示限价成交,真实账户大概率也会成交;但这种差异仍是回放和实盘之间需要意识到的执行细节。图中红色 L1 是止盈限价单,蓝色线标出已经完成或正在进行的进出场。
15秒图机会很多,但长期盯盘并不适合多数人
Time: 13:32
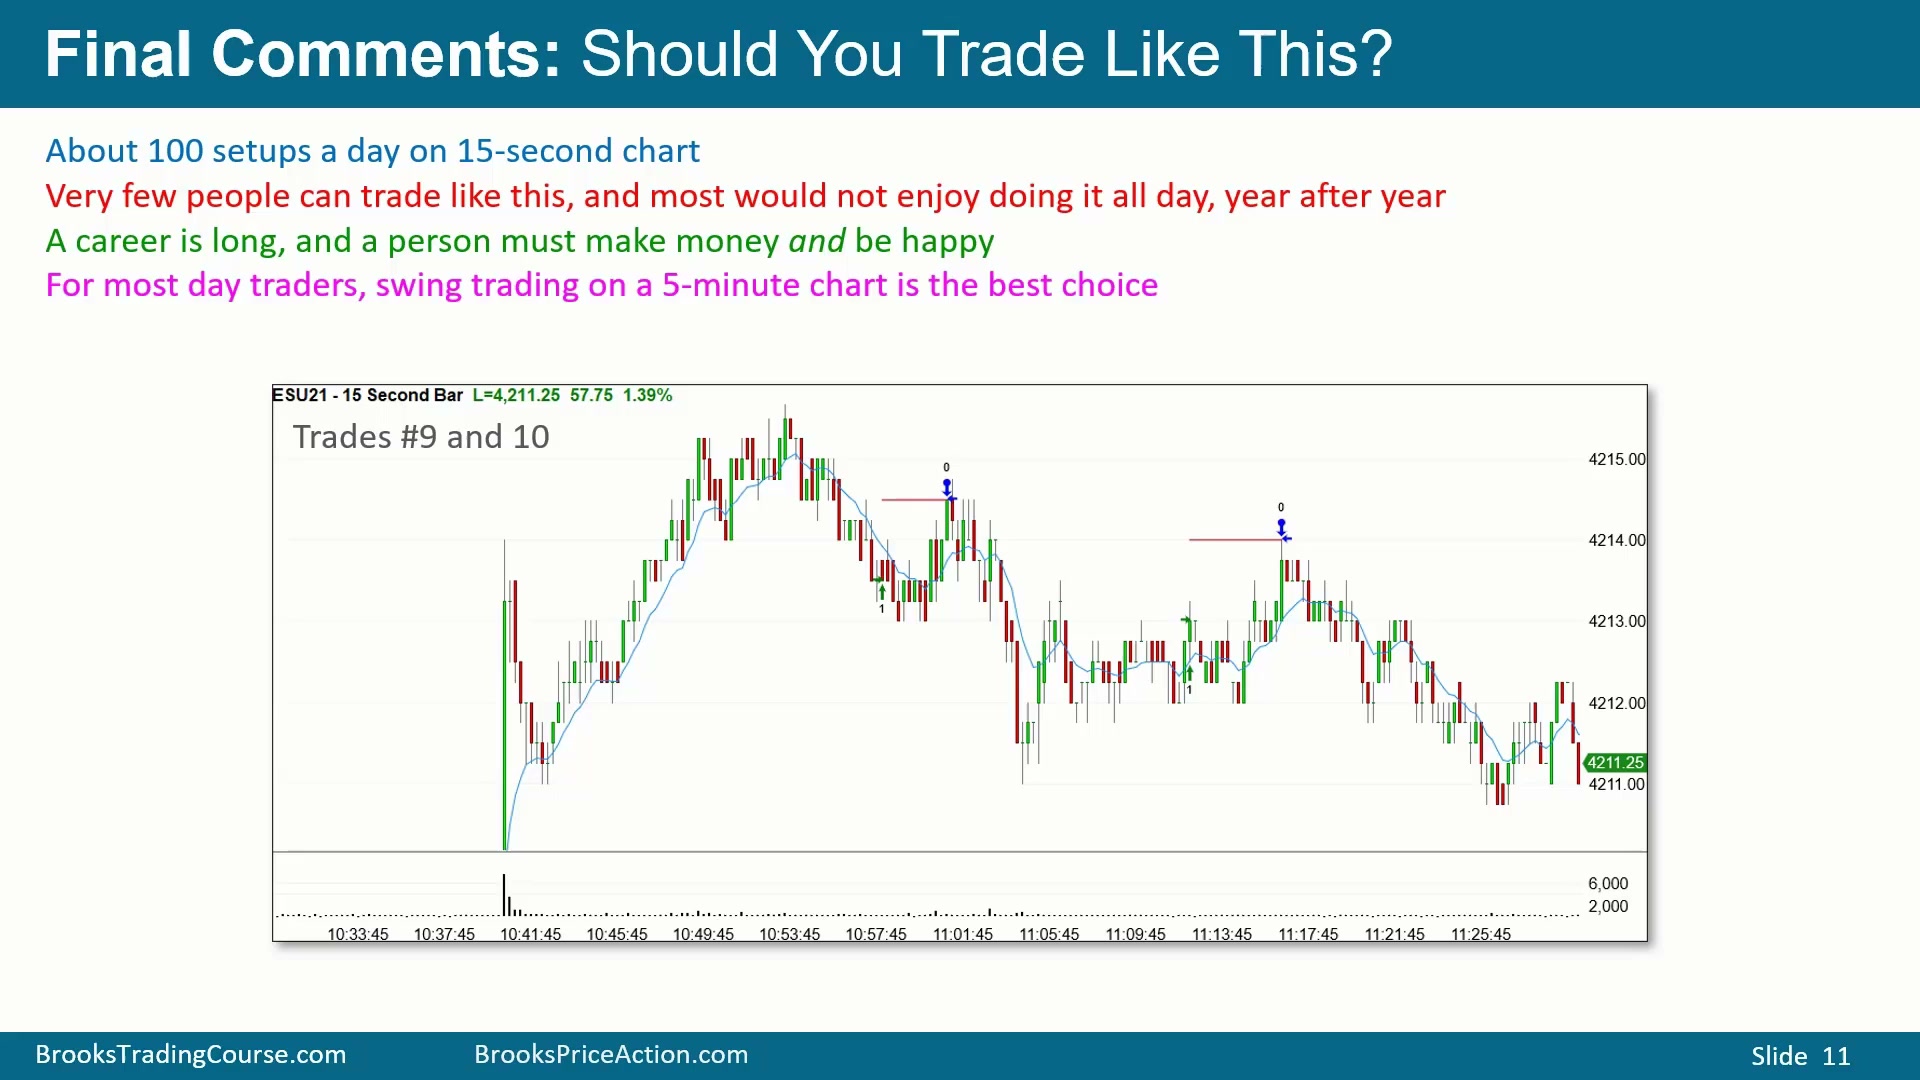
15 秒图每分钟 4 根 K 线,每小时 240 根。一个 6 小时 45 分钟的交易日超过 1000 根 K 线。如果整天盯着它,合理 setup 可能至少有 100 个。但很少有人能这样交易,尤其很少有人能每天连续几小时保持这种速度和准确度。交易生涯很长,交易者既要赚钱,也要能长期承受自己的交易方式;对多数人来说,5 分钟图上的 swing trading 更合适。
第九笔的核心问题是:当前下跌到底是熊趋势反转,还是牛趋势中的回调?下跌过程中出现许多牛 K 线,价格也没有快速下跌,而是在六七根 K 线里横向运行;过去约 10 根 K 线有三小推下跌,形成小型 Wedge。熊方在 Wedge selloff 后容易获利了结,多头也会尝试买入,因此这里选择买入。如果还要再跌,可以更低位置加仓;初始止损在 3 点下方,位于左侧价格梯底部附近。
刚买入时并不理想,市场仍在小回调熊趋势中向下 channeling。但右下角 5 分钟图仍是很强的牛趋势,并且高位出现牛 K 线;这根 K 线作为卖出信号并不好,通常会有买家在其下方接盘。15 秒图上,牛方需要连续牛 K 线,最好收在高点并重新站上 10-bar EMA。随后出现收在高点的牛 K 线,突破均线,又形成小 Double Bottom,并突破 neckline。连续两三根牛 K 线后,牛趋势恢复的可能性上升。即使熊方希望红色 K 线成为向下恢复,牛方也可以把它看作大牛 K 线后的回调。再出现牛 K 线后,价格足以完成 1 点剥头皮。
第十笔是最后一笔。熊方先有一次大突破,但价格没有继续下跌,而是横向整理,可能形成 Double Bottom 后恢复牛趋势。约 10 根 K 线前有小 Double Bottom,当前回调是在测试那个 Double Bottom,形成略高低点的 Double Bottom Pullback。市场处于 Triangle 和 BreakOut Mode,关键是判断继续下跌更可能,还是反转向上更可能。由于愿意更低加仓,买入风险可以管理;出现连续牛 K 线后,用限价单快速买入。
多周期背景支持这笔买入。2 分钟图上有连续 Inside Bars 的 ii,也是与四根 K 线前 High 2 相关的买入;5 分钟图上也有 ii,且两根 Inside Bar 都是牛实体。熊方希望 ii 向上突破失败并变成 bear flag,但均线附近已有不错的反转,且只是前面强上涨的约 50% 回撤。15 秒图上短暂浮亏两三个 tick 后,市场在 2 分钟图上给出熊 K 线,但它收在均线上方,仍处于 ii 买入结构;随后 15 秒图形成 Outside Up,先跌破熊 K 线再反转到其高点上方,这是对多头有利的行为。若这根 K 线收在高位,进一步上测牛趋势高点的概率会增加。随后 5 分钟 ii 也触发,15 秒图出现三根连续牛 K 线和均线处小 High 2,最终突破并成交止盈。
15 秒图示范不是鼓励整天交易极小周期,而是说明同一套价格行为会在很小的时间框架上反复出现。一天可能有一百多个可以讨论的 setup,但真正适合下单的只是其中一部分;交易者必须在几秒内判断更高周期背景、当前 K 线强弱、是否愿意加仓、止损是否还能承受。若每一笔只看 15 秒图本身,很容易被影线、假突破和极短噪音来回拉扯。
第九、十笔也说明,剥头皮虽然目标只有 1 点,但分析并不简单。第九笔需要判断 Wedge selloff 后空头是否已经获利了结,牛方是否能重新站上 10-bar EMA;第十笔还要同时参考 2 分钟 ii、5 分钟 ii、15 秒 Outside Up 和前面强上涨的 50% 回撤。小目标并不等于随便交易,小目标要求更严格的选择和更快的否定。
这种速度也解释了为什么示范账户经常用限价单、快速止盈和固定 3 点灾难止损。15 秒图上价格可以在几根 K 线内从好信号变成坏信号;若交易者想持有更久,必须能在更高周期上看到足够强的背景。否则,1 点目标完成就退出,能避免在噪音里把盈利还回去。
第十笔尤其依赖多周期确认:15 秒图只是最早触发,2 分钟图和 5 分钟图的 ii 让买入更有结构。若 2 分钟图的熊 K 线跌破均线并收在低点,买入逻辑会变弱;但它收在均线上方,随后 15 秒图又 Outside Up,说明空头没有 follow-through。短线剥头皮的实际工作,就是不断把这些小证据合并成一个足够快的执行判断。
十笔交易的权益曲线与结果
Time: 22:50
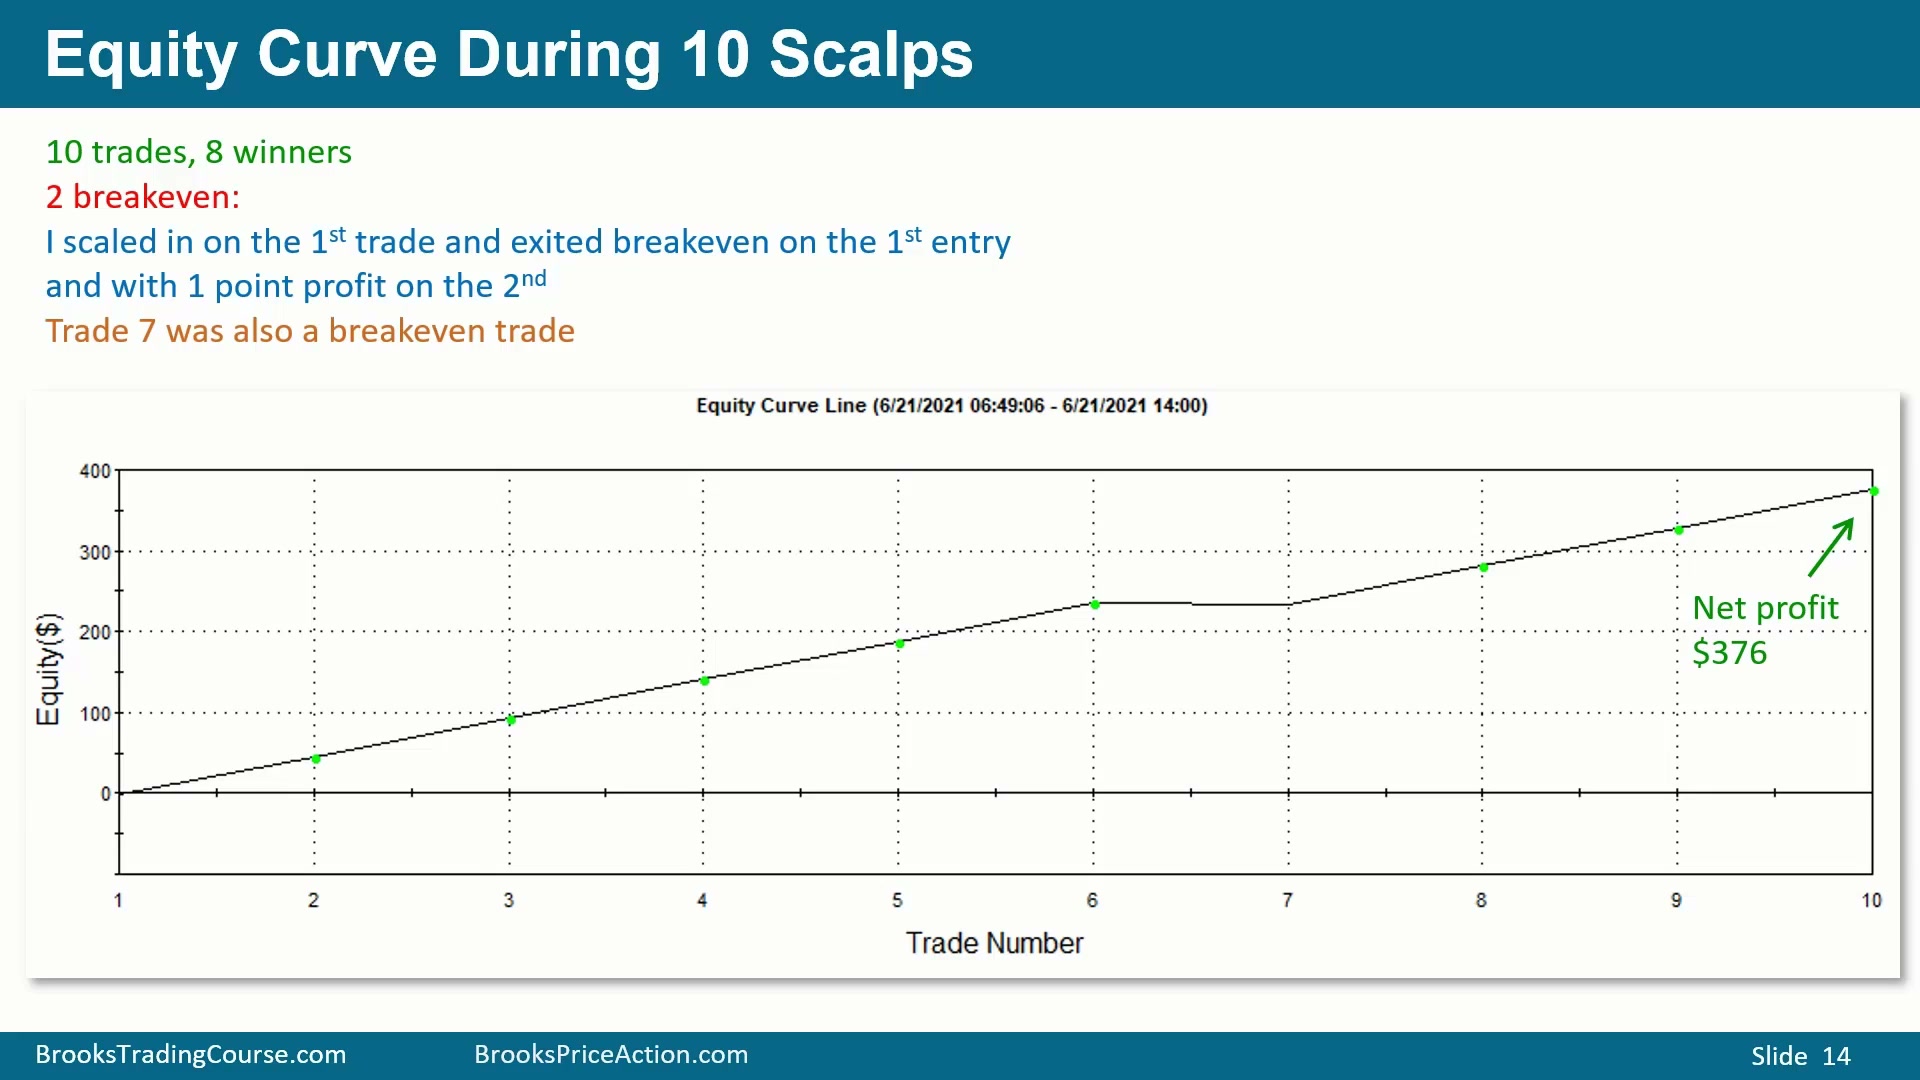
图中权益曲线显示 10 笔交易后的结果。第一笔在价格上保本出场,第二笔是第一组加仓交易的一部分,获得 1 点,也就是单合约约 $50。第七笔同样是价格保本,但因为当时注意力转向真实账户,提前退出模拟账户;从交易记录角度看,它也被计为亏损,因为佣金使净结果为负。
10 笔交易结束后,扣除佣金的净利润为 $376。这个结果来自 8 笔 1 点获利和 2 笔价格保本交易,而不是来自某一笔大行情。它展示的是高胜率、小目标、快速执行的剥头皮模型。
保本交易也会因佣金被记为亏损
Time: 23:30
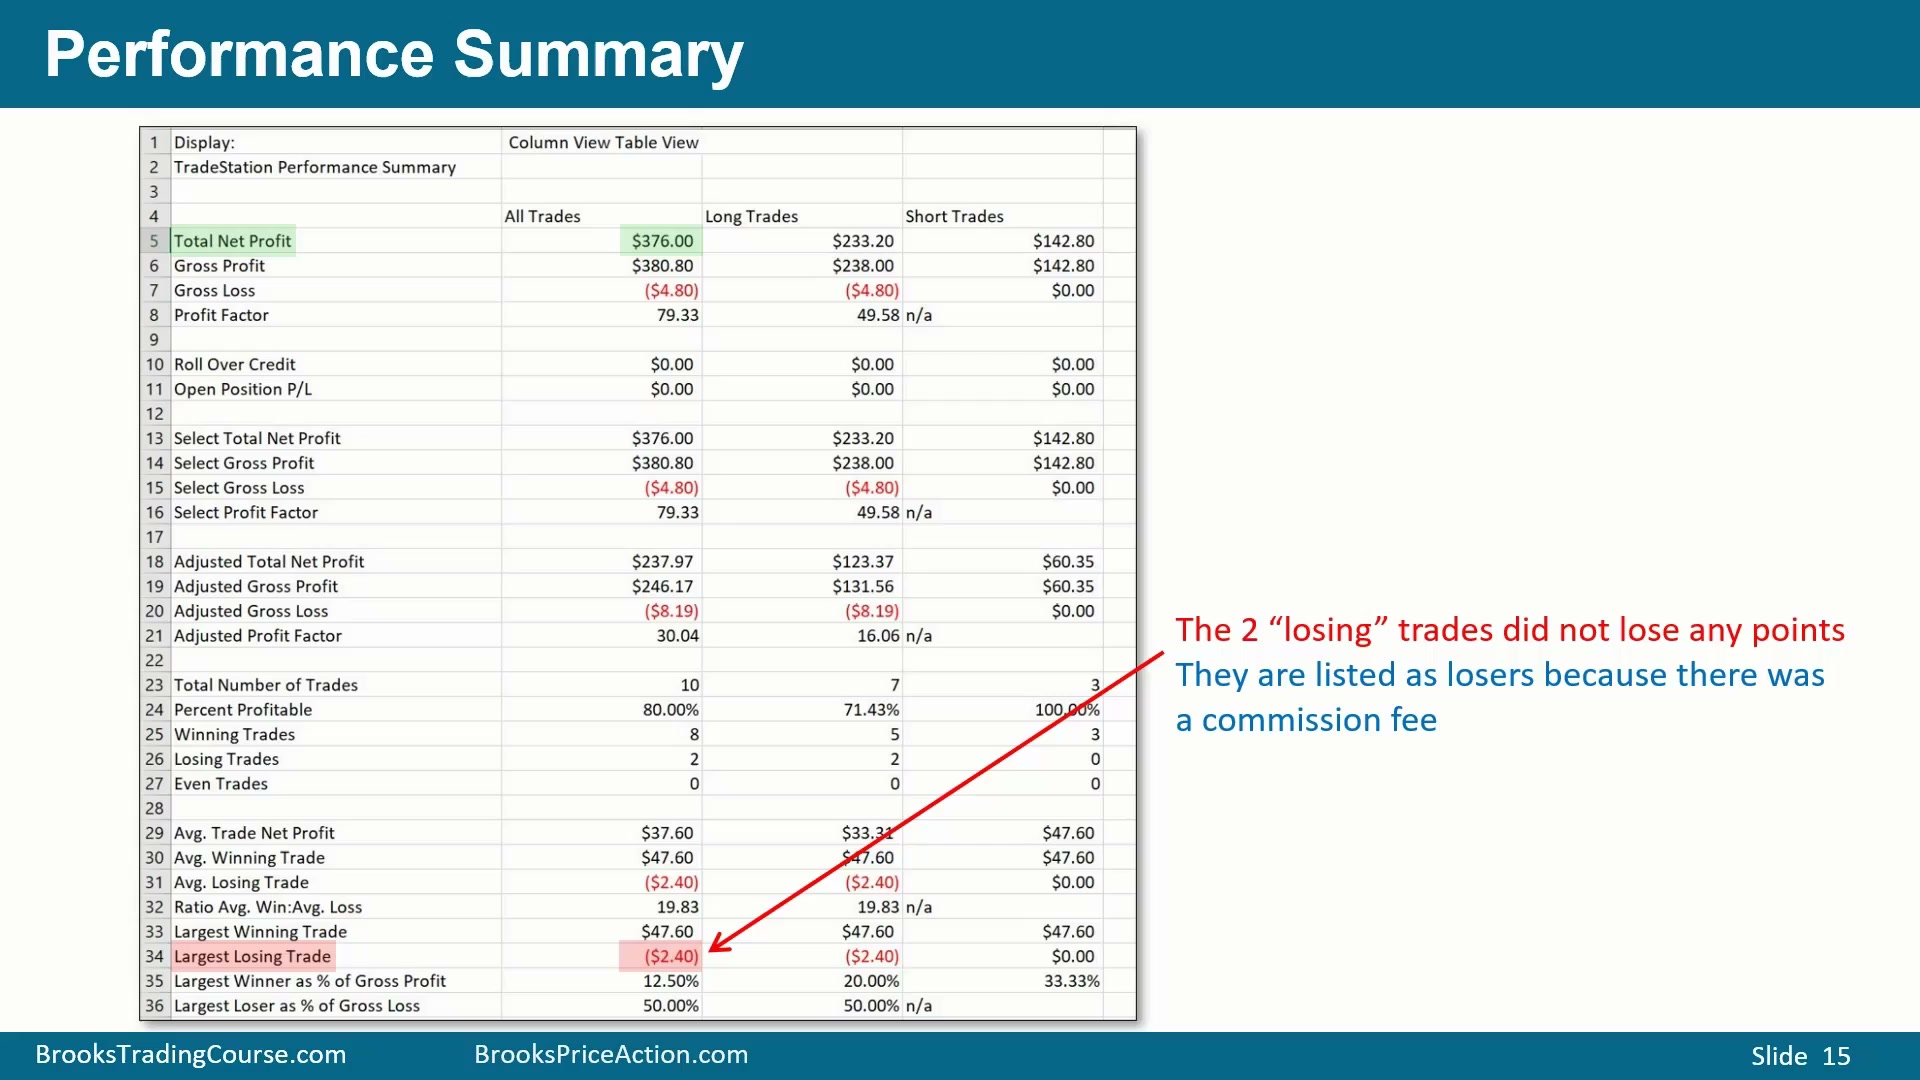
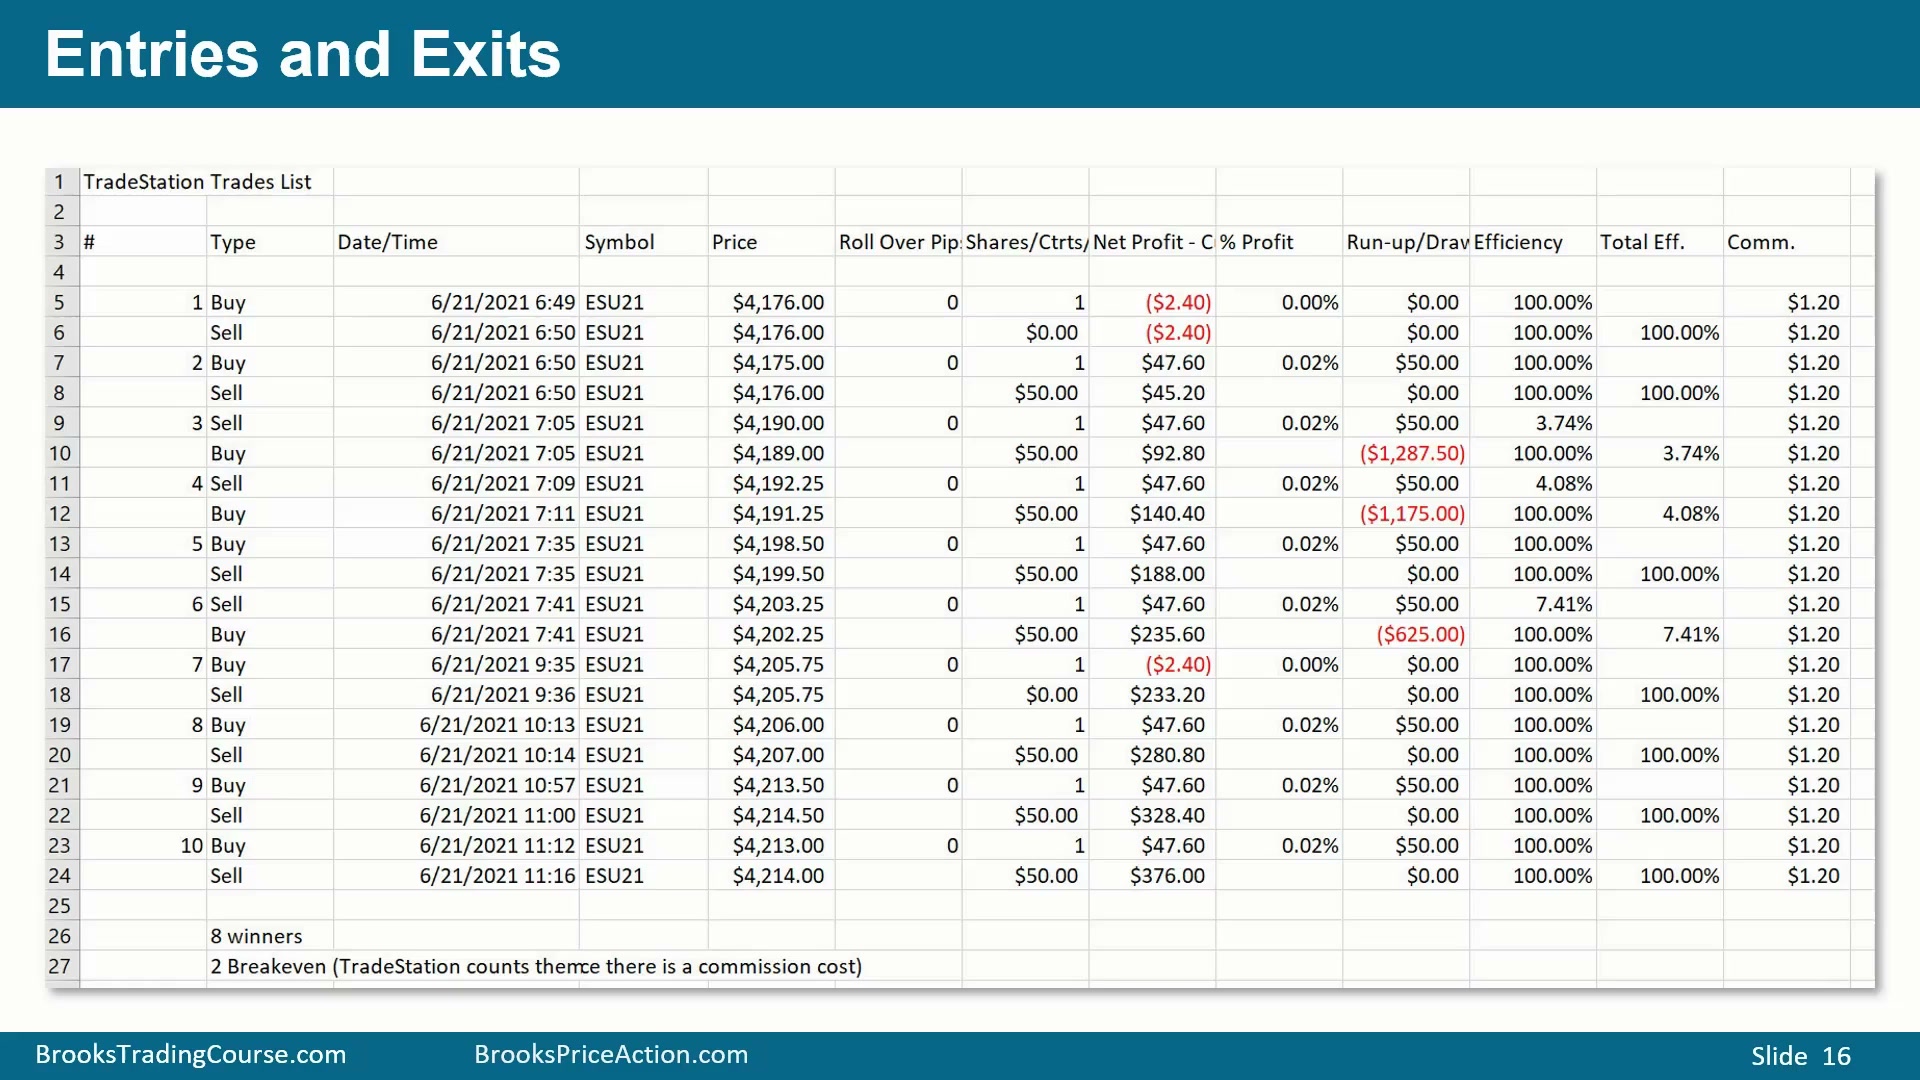
TradeStation 把两笔价格保本交易列为亏损,因为每笔交易仍要支付佣金。图中的交易列表因此显示两笔约 $2.40 的小亏损。实际价格没有亏 tick,但净值被佣金拉低。
把所有交易合在一起看,结果是 8 笔赚 1 点,2 笔价格保本。对剥头皮来说,这种细节很重要:小目标交易的 edge 很薄,佣金、点差、成交质量和一次小失误都会影响最终结果。
80%胜率来自严格选择与快速执行
Time: 23:55
最终胜率为 80%。这不是因为每笔交易风险回报都漂亮,而是因为交易目标很小、选择足够严格、执行足够快,并且大多数决策都和更高周期背景一致。15 秒图能够提供大量机会,但也要求交易者持续快速处理信息、立即下单、管理加仓和止损,并承受非常高的认知负荷。对多数交易者而言,这类极端剥头皮更适合作为理解价格行为在所有周期上都一致的案例,而不是默认交易方式。