al-brooks-course
49A - Swing Trading Examples
Readable self-study lecture notes for 49A - Swing Trading Examples.
Source Media
日内图中的波段交易案例
Time: 00:14
这一组案例讨论的是日内交易图上的波段交易机会。交易目标不是只做几个 tick 的 scalp,而是在开盘后或盘中出现足够强的结构时,寻找可以持有一段走势的入场、加仓、止损和退出位置。
开盘假突破反转后的测量运动
Time: 00:22
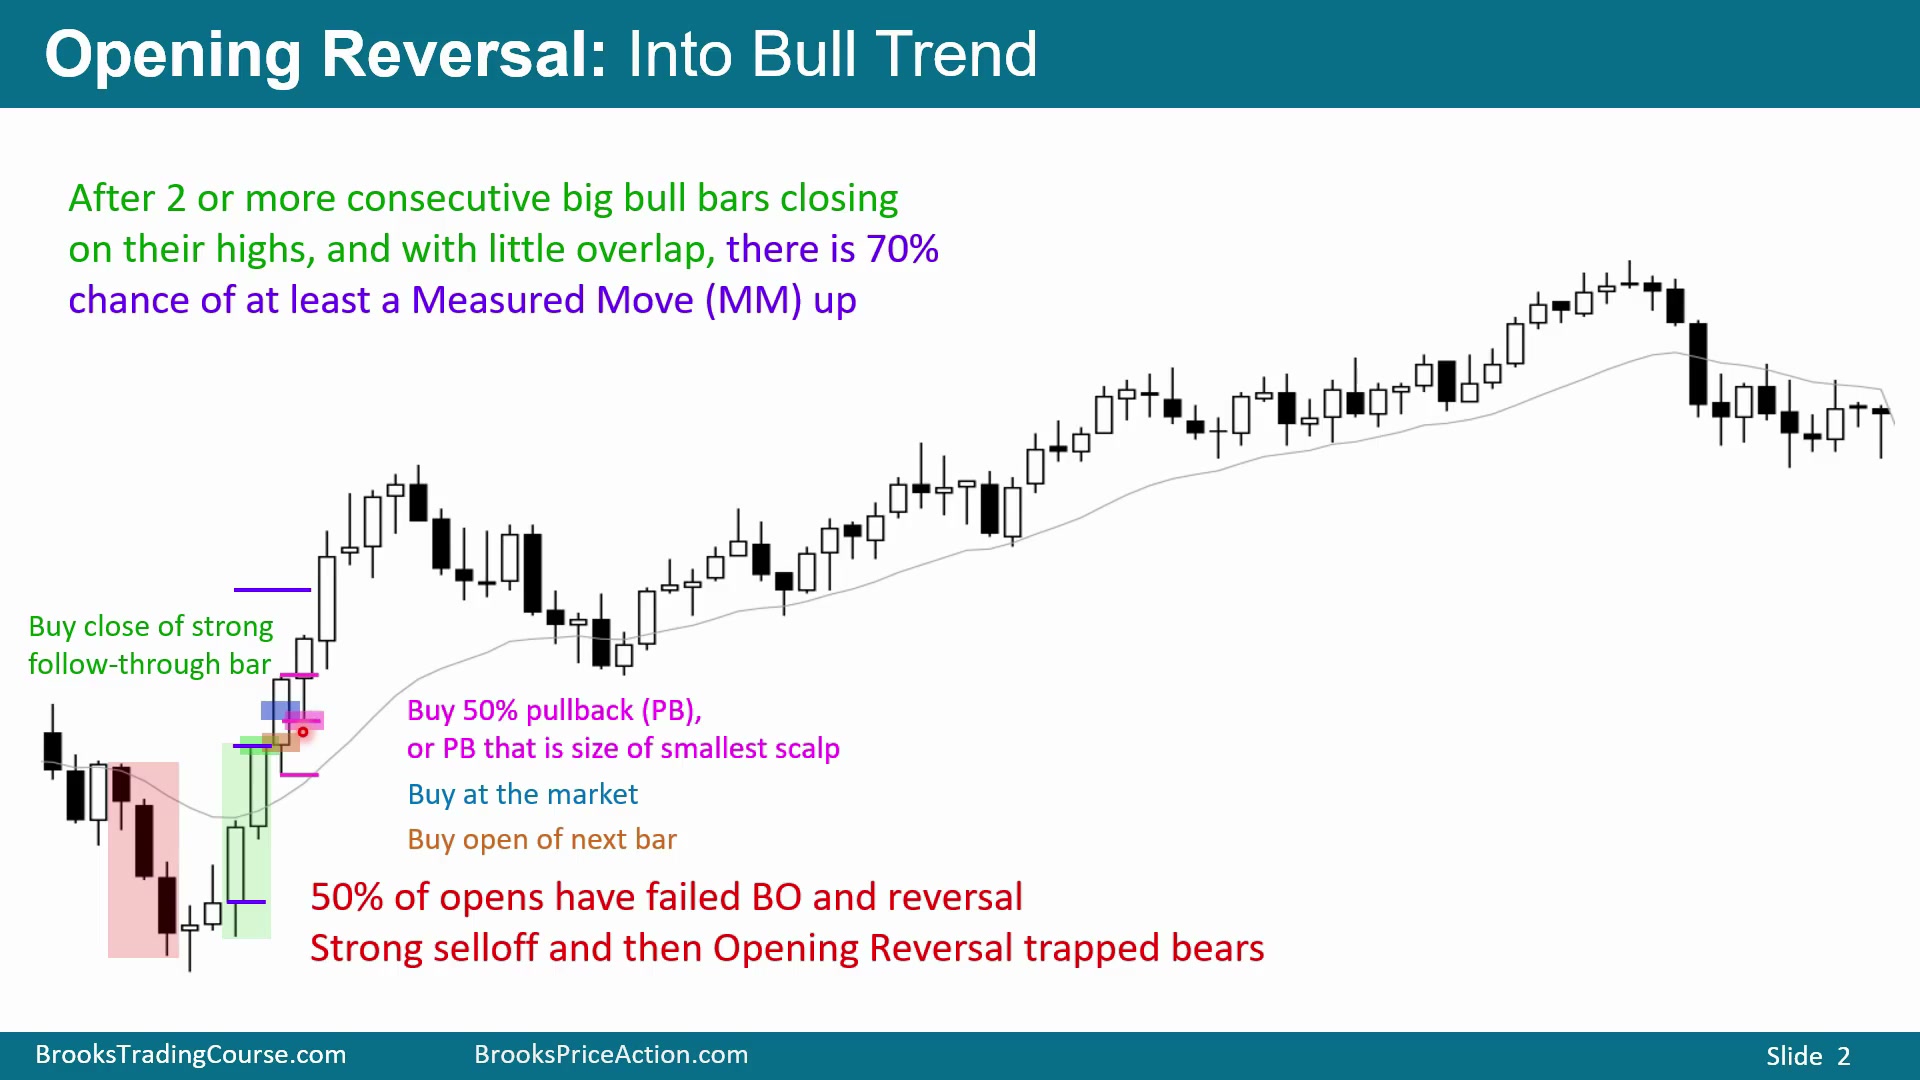
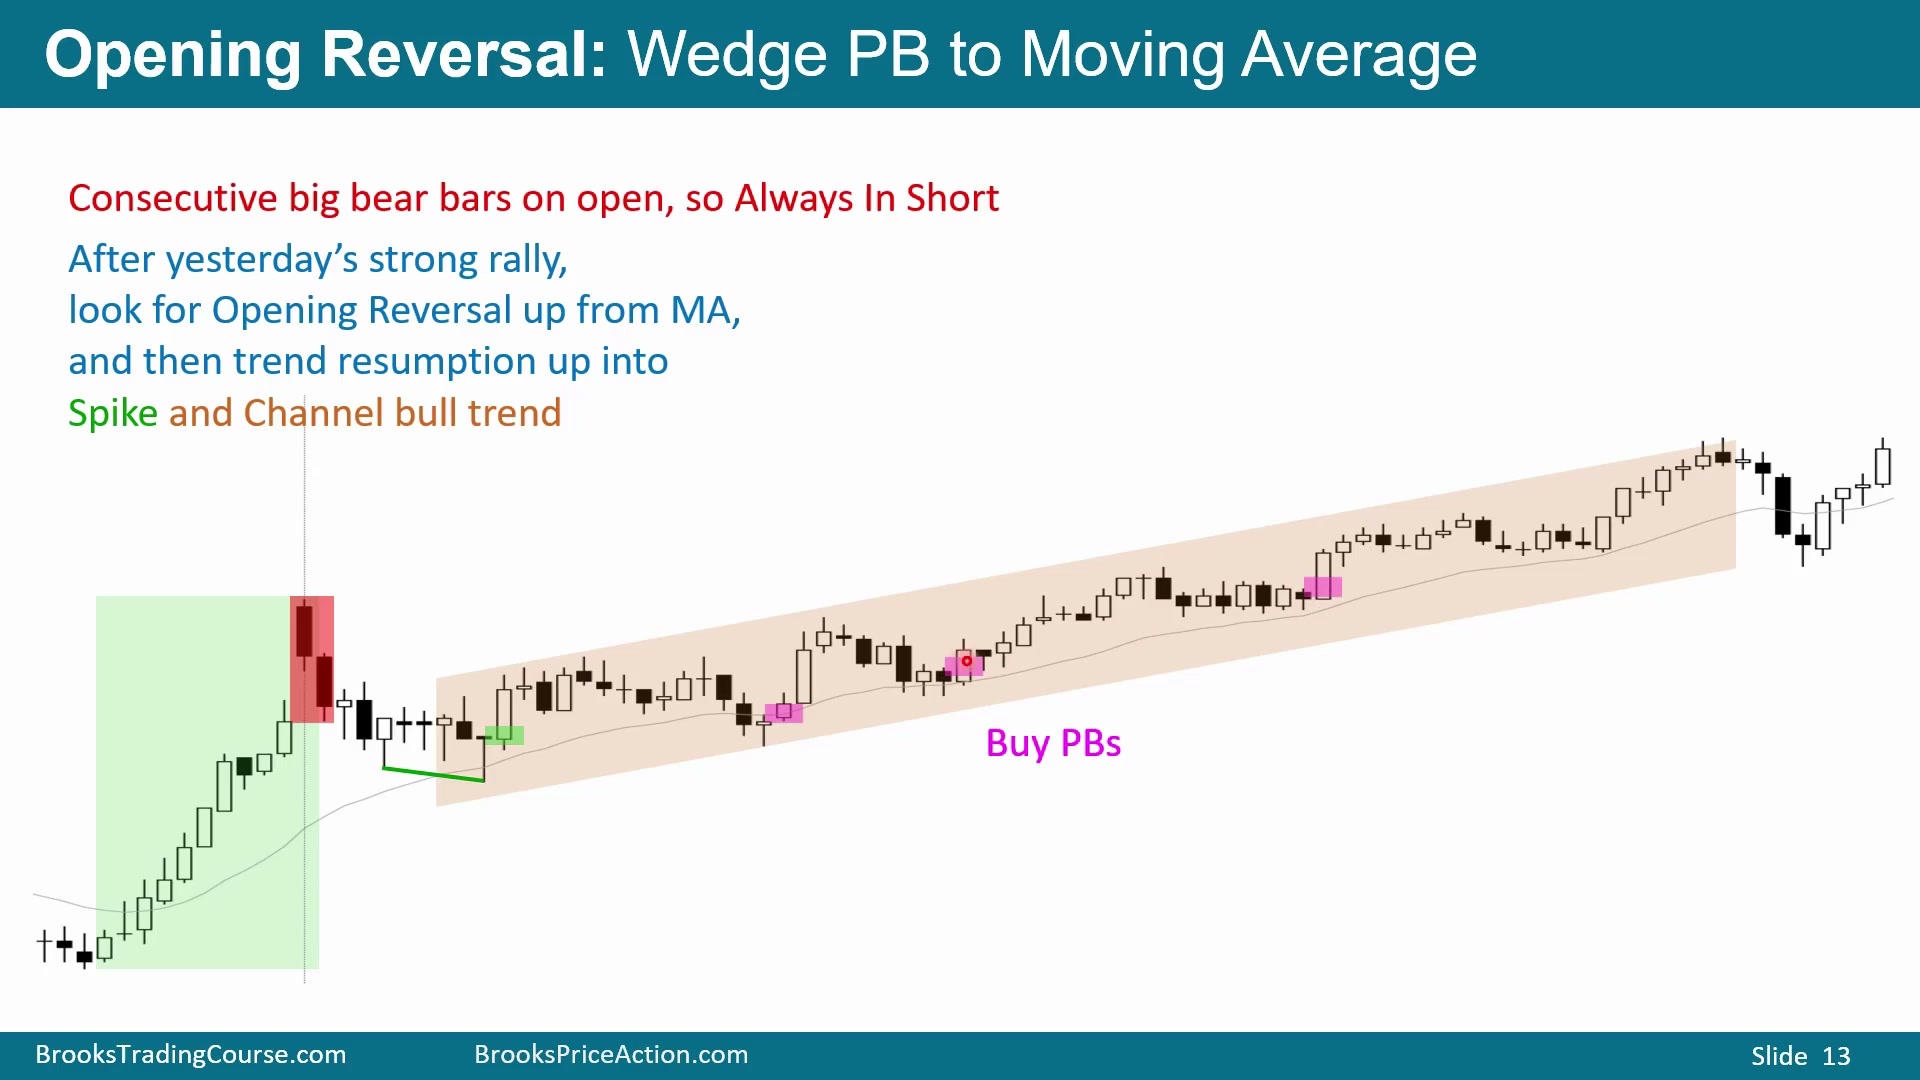
开盘最重要的观察之一,是大约一半的开盘突破会失败并反转。图中市场开盘后强力下跌,随后向上反转,把追空的空头困住。这是 opening reversal。这样的开盘下跌通常会在某种支撑位附近反转,虽然这张图没有显示左侧 K 线,无法直接看到支撑来源。
反转向上之后,图中先出现一根较大的 outside up bar,接着又出现第二根较大的阳线,两根之间重叠很少,并且第二根收在最高点附近。这个收盘远高于前面空头 K 线的高点,也高于均线,还高于最后一段空头腿的高点。到这里,市场已经清楚转为 Always In Long,并且至少走出某种向上测量运动的概率大约有 70%。
强多头突破出现时,首先要估算 measured move。常用投影可以从突破阶段第一根 K 线的开盘价到最后一根突破 K 线的收盘价,也可以用这段突破的低点到高点。随着突破继续扩大,最后一根突破 K 线不断上移,测量运动的目标也要随之上移。图中在不同收盘点,投影线会一次次向上调整;交易者在当时并看不到后面的 K 线,只能根据已经完成的突破重新计算目标。
因此,很多多头会买入强突破 K 线的收盘。可以在该收盘价挂限价买单,但有时不会成交;另一种方法是直接市价买入,通常会在下一根 K 线开盘附近成交。如果没有在第一根强收盘买入,只要市场仍处在强突破中,也可以在后续任一点市价买入,因为到测量运动目标的概率仍然约为 70%。
没有追进的交易者,也会寻找回调买入。图中蓝色区域是可以直接市价买入的位置;也可以在突破原始入场价到后续收盘价之间的 50% 回调处挂限价买单。若价格回落到粉色区域成交,交易者就在强突破后的第一次回调里获得了多头仓位。到图中这一刻,已经有三根强多头 K 线,突破质量足以支持继续寻找向上波段。
强突破后的回调、通道与交易区间演化
Time: 04:00
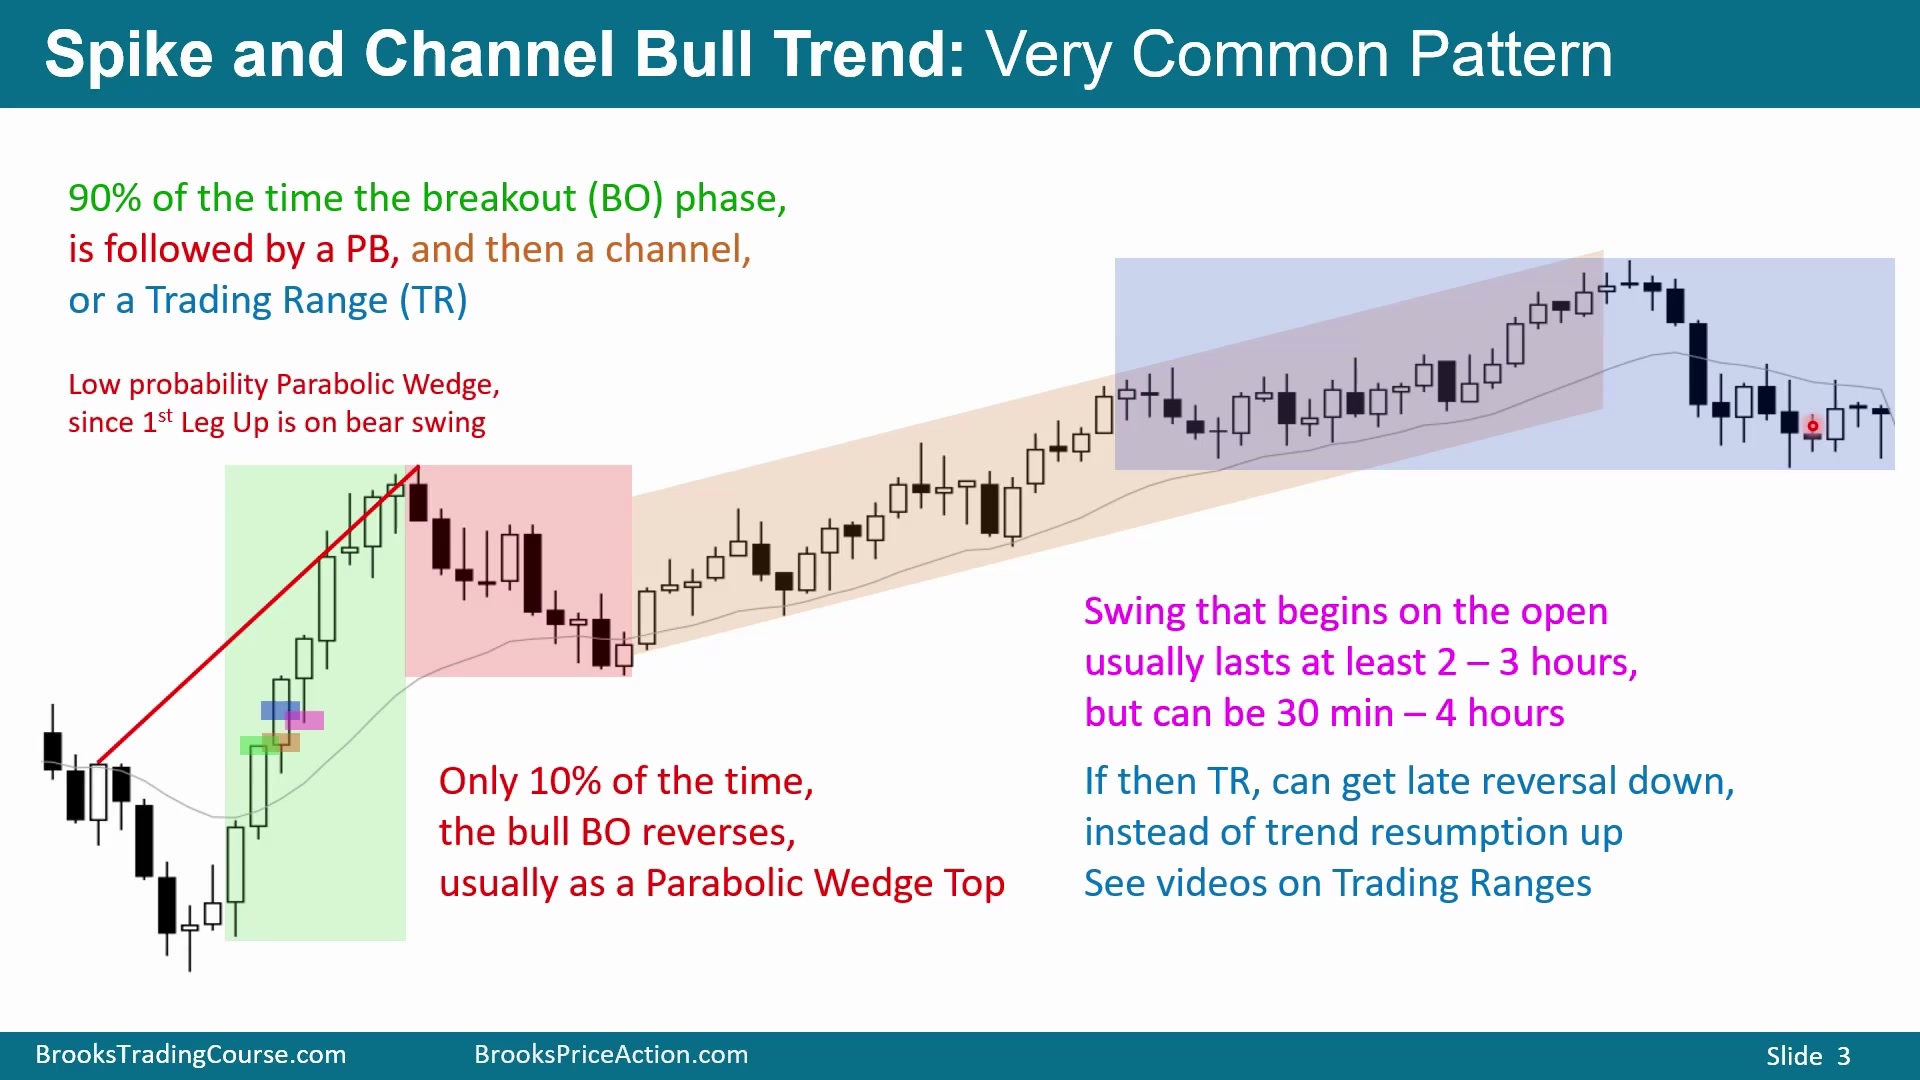
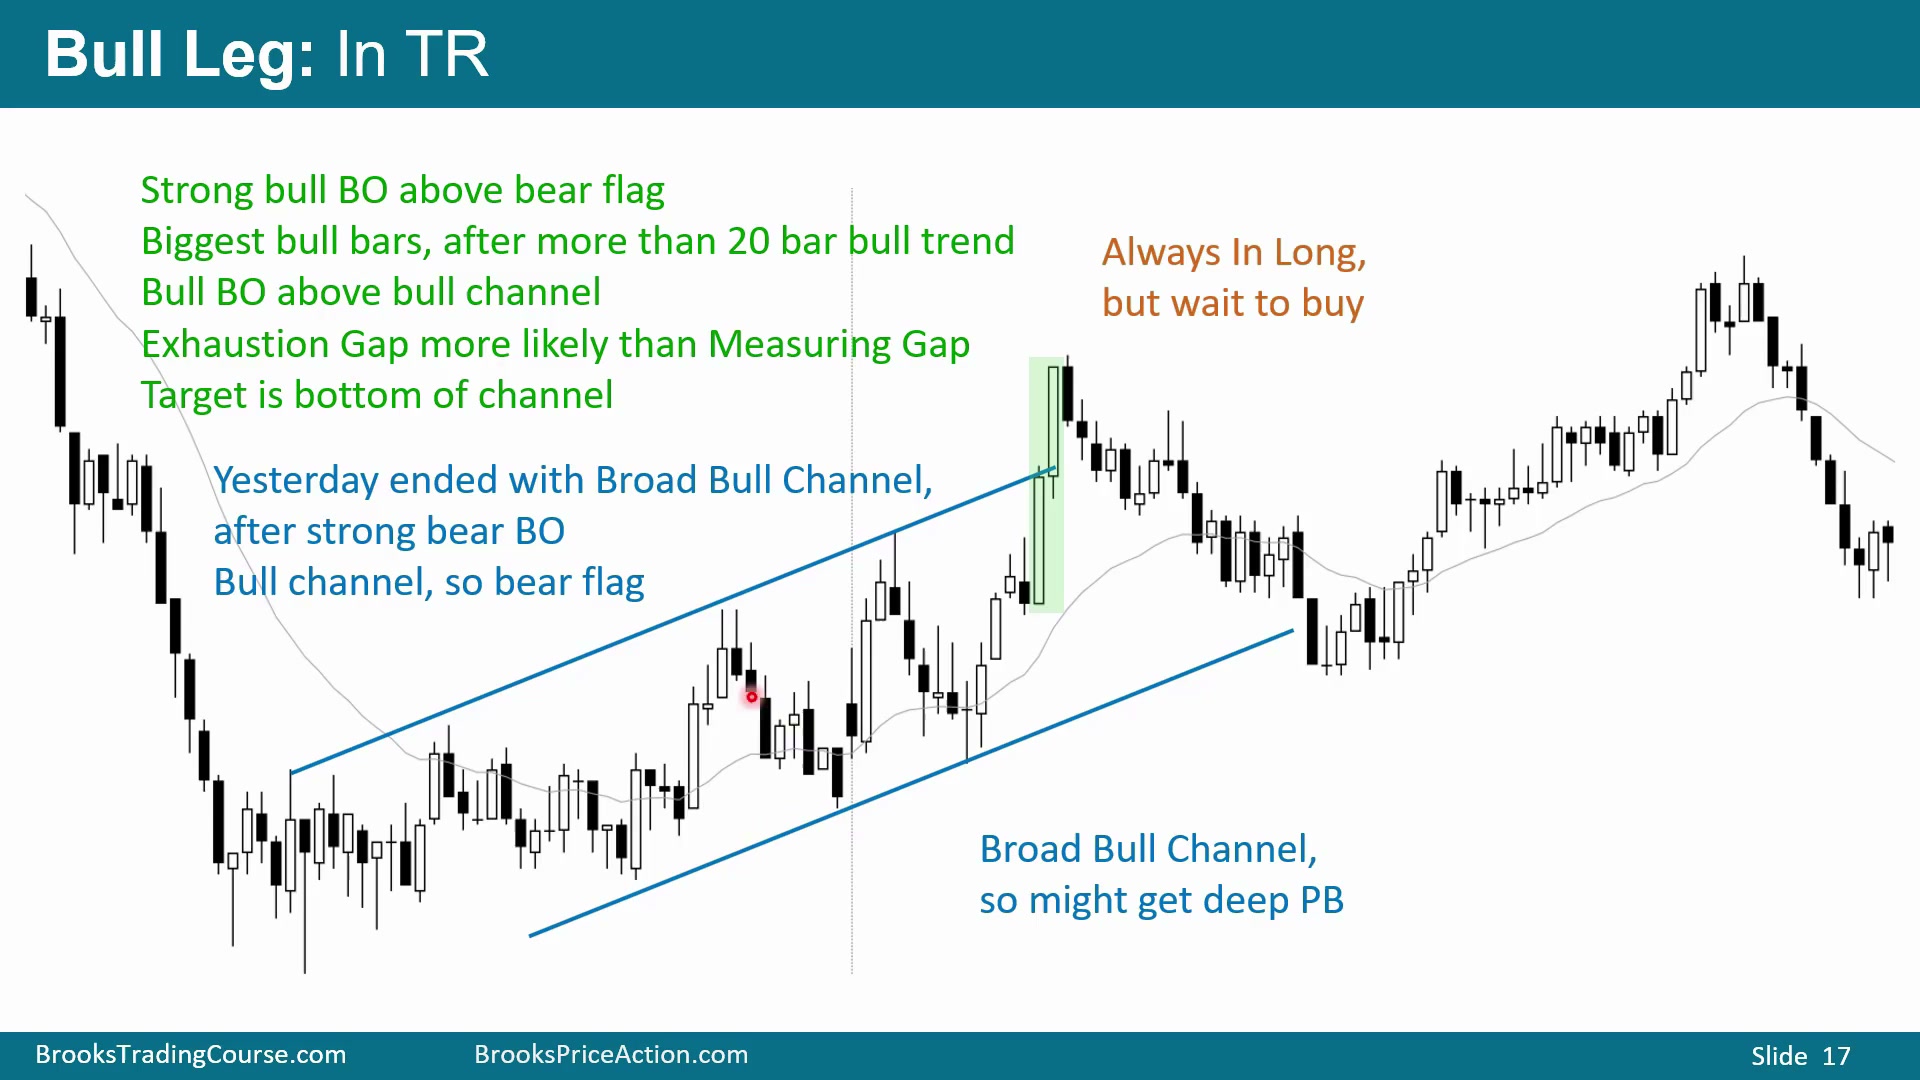
图中强突破最终形成四到五根强阳线。任何强趋势的突破阶段之后,迟早都会出现回调;这里先有小回调,之后有更大的回调。回调之后通常只有几种结果:市场进入交易区间,然后在趋势恢复向上和趋势反转向下之间做选择;或者回调本身发展成通道,就像图中的熊通道一样。
这段回调也可以被看成一个交易区间,直到出现良好的买入信号 K 线并恢复上涨。但从结构上看,它更像一个熊通道形式的 bull flag,并且有三推下跌:第一推、第二推、第三推。即使趋势在第一次回调后继续向上,前两根上冲 K 线仍然属于从反转下跌开始的回调结构。第三推结束后,楔形 bull flag 完成,随后开始形成上升通道。
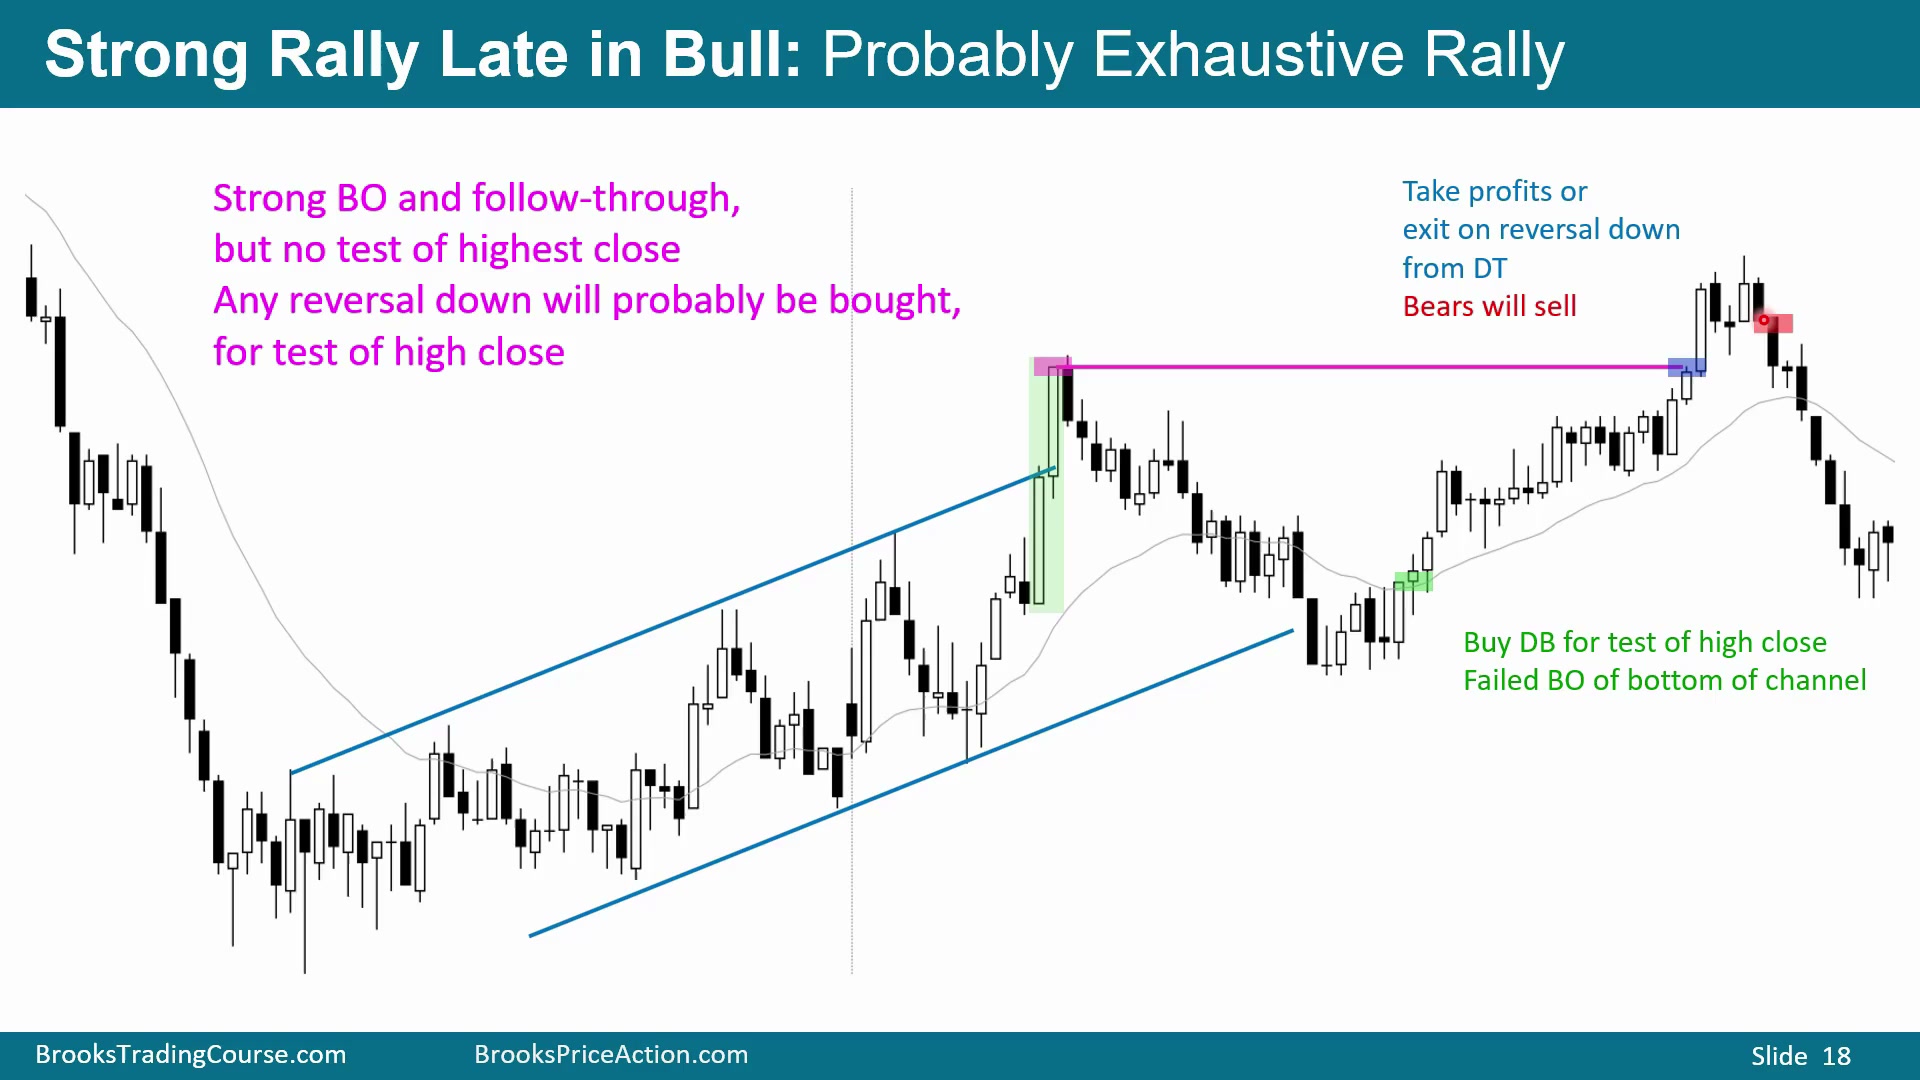
上升通道本身也要被看成潜在 bear flag。大约 75% 的通道最终会向下突破,并且通常演化成交易区间。图中通道后半段已经出现一连串 doji,十根 K 线里几乎全是 doji。市场虽然继续创新高,但交易区间可能已经从这些 doji 开始形成;后面价格强烈反转并测试这个发展中交易区间的底部,说明通道确实开始失去趋势特征。
强多头突破之后,至少再涨一点的概率大约 90%;达到基于突破阶段开盘或低点到最后收盘的 measured move,概率大约 70%。只有大约 10% 的时候,这样的突破会直接形成当天高点并强烈反转向下。那种情况通常需要非常清楚的 parabolic wedge top,而图中并不是典型形态。
可以勉强把图中上涨标成三推:第一推、回调、第二推、回调、第三推。但典型 parabolic wedge top 的第一推通常从低点之后开始,中间常有一两根空头 K 线;图中第一推更像发生在前面的空头腿里,而且上涨途中几乎没有空头 K 线。因此,把它当成重大反转并成为当天高点的概率只有大约 10%;更合理的预期是回调之后进入交易区间,或继续趋势。
开盘后或第一个小时内出现的波段交易,通常会持续两到三个小时,但也可能短到 30 分钟,只走五六根 K 线后就反转;也可能长达四小时,甚至持续一整天。一旦走势开始演化为交易区间,就要准备晚些时候出现向下反转,而不是一定趋势恢复向上。强突破、通道、交易区间这条演化路径中,后续趋势恢复和趋势反转大致各有 50% 的机会。
微双顶后的强空头腿与三角形
Time: 08:25
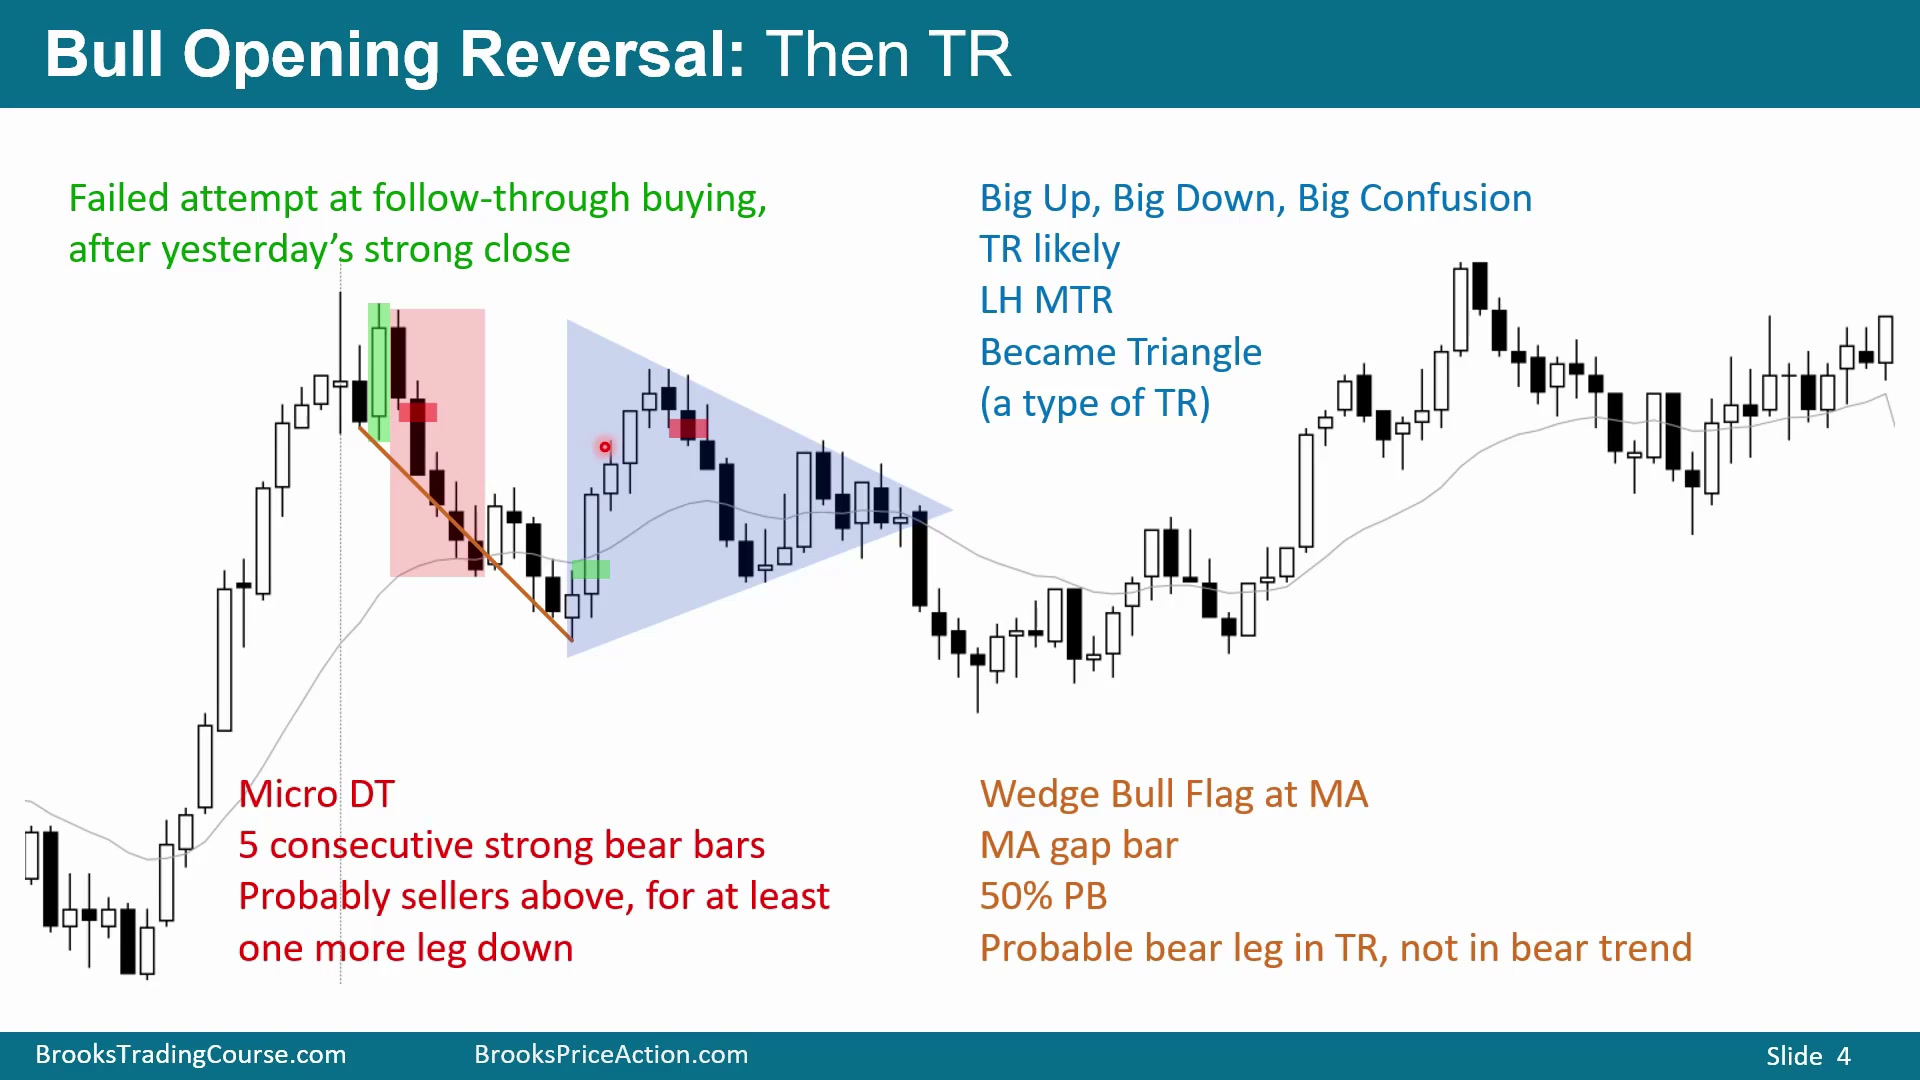
图中另一个案例先出现非常强的向上反转,然后形成 micro double top 和回调。回调也可以数成 wedge pullback:第一推、第二推、第三推。前一天尾盘是 Buy The Close 式上涨,今天开盘尝试继续跟随买入;第一次尝试失败并卖出,随后从 micro double bottom 再试一次,也再次失败,最后形成相当强的向下反转。
这个 micro double top 后的下跌发生在极紧多头通道之后,而且上升过程中没有空头 K 线。因此它大概率只是 minor reversal,也就是未来交易区间中的一条空头腿,而不是马上形成持续空头趋势。可是短线执行上,图中连续两根大阴线收在低点附近,重叠很少;开盘时看到这种结构,应判断市场已经 Always In Short,并预期至少会走出某种 measured move 向下。
即使预期 50% 回调附近会有买盘,即使认为它最后会成为交易区间中的空头腿,连续两根强阴线仍然意味着还会继续下跌。后面又出现五根连续空头 K 线,全部收在中点以下。开盘出现这种连续性后,第一次回调后至少再跌一点的概率很高。空头会在前一根 K 线高点上方用限价单卖出;图中即使回调 K 线本身是强阳线,在五根强阴线之后,仍然大概率会被卖。
这段下跌也可以数成 wedge bull flag:第一推可以取某个低点、某根阴线或另一个低点,不必过度纠结;之后上涨再下跌形成第二推,回调后形成第三推。它同时也是从前一天收盘附近开始的 50% 回调。图中还出现 moving average gap bar:某根 K 线高点与均线之间有明显空隙。这样的 gap bar 经常引出牛趋势最后一腿,随后市场尝试 major trend reversal;这里就是 lower high major trend reversal。
不过,第一次向下反转再强,仍然是第一次反转,通常只是 minor reversal。后面出现 lower high major trend reversal:先有多头趋势,再有不错的空头突破和许多空头 K 线,随后形成 lower high。可是 lower high 前面有五根连续阳线,这通常不会让 major trend reversal 直接成功。结果市场下跌五根 K 线后又再次上涨。
整体图形逐渐变成 triangle:三推向上之后进入 BreakOut Mode,并且大三角形顶点附近还有一个小三角形。大幅上涨、大幅下跌、再次大幅上涨、再次大幅下跌,说明市场处在强烈分歧中。强烈分歧意味着交易者既不相信市场能跌很远,也不相信能涨很远,所以会快速出场,最终形成交易区间。三角形就是交易区间的一种。
可以卖出 lower high major trend reversal,但在五根连续阳线之后,它大概率仍然只是 minor reversal。相反,图中后面的空头通道也非常紧,第一次向上反转也通常只是 minor reversal;极紧通道之后,通常不会立刻得到很长的反向趋势。
这张图的管理重点是不能只看信号名称。micro double top、wedge pullback、moving average gap bar、lower high major trend reversal、triangle breakout mode 都同时存在,但每个信号的概率都受前面通道紧密程度和连续 K 线强度限制。强下跌可以做空,强上涨后的 lower high 也可以卖,但只要它们发生在刚刚结束的极紧反向通道之后,就要默认它们更可能只是交易区间的一条腿,而不是新趋势的开始。
三角形突破失败与低点二买入
Time: 13:10
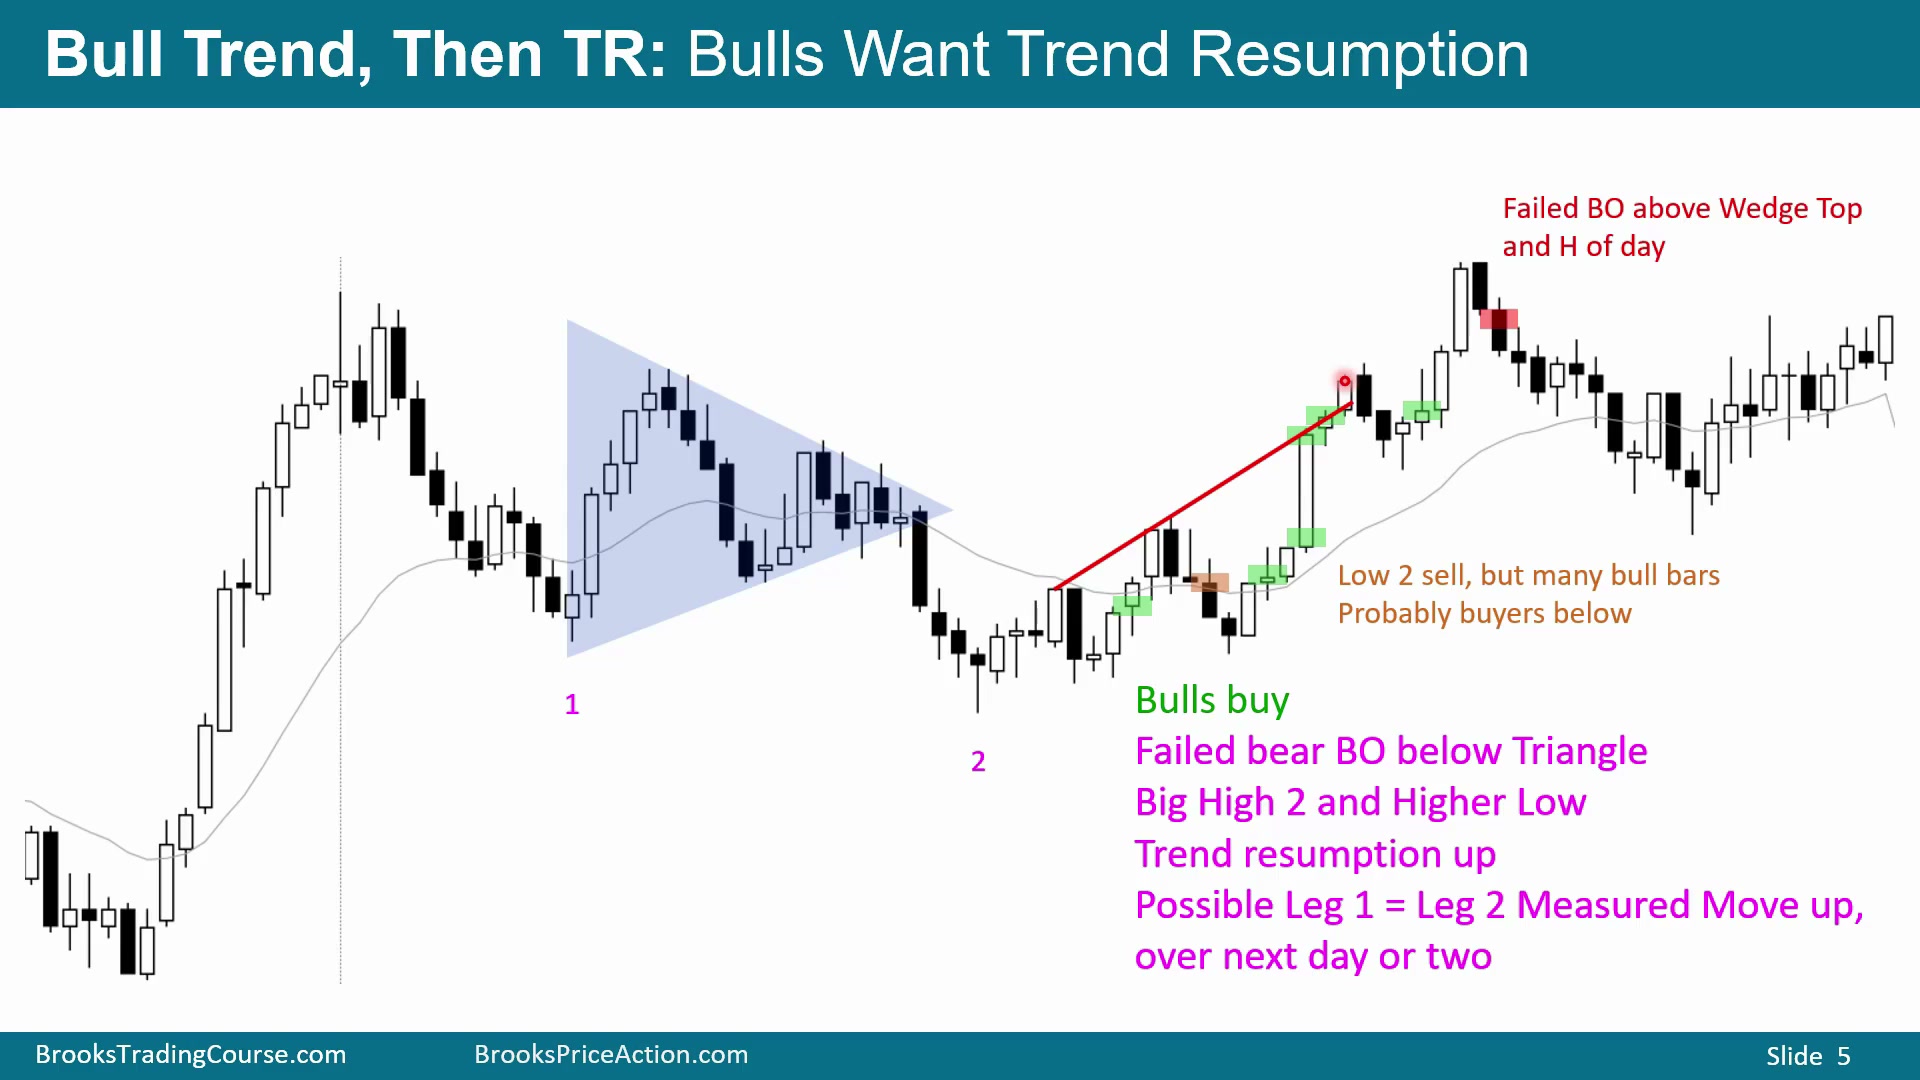
三角形处在 BreakOut Mode:向下突破和向上突破各有大约 50% 概率,第一次任一方向的突破也有大约 50% 概率失败并反转。图中先向下突破。这个向下突破同时是从高点开始的两段回调:第一腿、三角形回调、第二腿。因此它可以被看成大型 High 2 买入形态,也可能是三角形下破失败。
这个买入信号并不好看,因为它出现在四根连续阴线之后。很多交易者更愿意等到阳线高点上方买入,例如后面几根阳线的上方;如果想要更高概率,则等真正的大阳线突破。图中多头最后得到一根非常大的多头突破 K 线,突破前 10 到 15 根 K 线的高点,并且收盘很高,下一根 K 线也有阳线实体。这种强突破提高了至少第二腿向上的概率。
空头原本尝试 Low 2 做空:第一腿上涨、回调、第二腿上涨,然后尝试向下反转。背景上,空头确实有 lower highs 和 lower lows,形成熊通道;技术上这是一个 bear flag 做空。但图中随后出现四根连续阳线,其中三根实体较好并接近高点收盘。这样的反转大概率只是 minor reversal,空头最好的结果可能只是横盘,最差则是完全失败并向上突破。
强突破之后,多头开始在阳线高点上方买入、买收盘、买 High 1 bull flag。大阳线本身也要求考虑 measured move,例如从低点到突破高点。即使有人把前面的上涨标成另一组 wedge,只要出现这种强突破,通常都应预期第二腿向上。
图中后半段是连续顶部的例子。市场先尝试形成顶部:第一次、回调、第二次;随后强突破,通常会带来第二腿向上。之后又出现 Low 1、Low 2,构成 Low 4 sell setup。它不是单一顶部,而是又一个复杂顶部,两次尝试失败后,市场大概率至少下跌几腿。
开盘抛物线楔形顶部与 Sell The Close
Time: 16:15
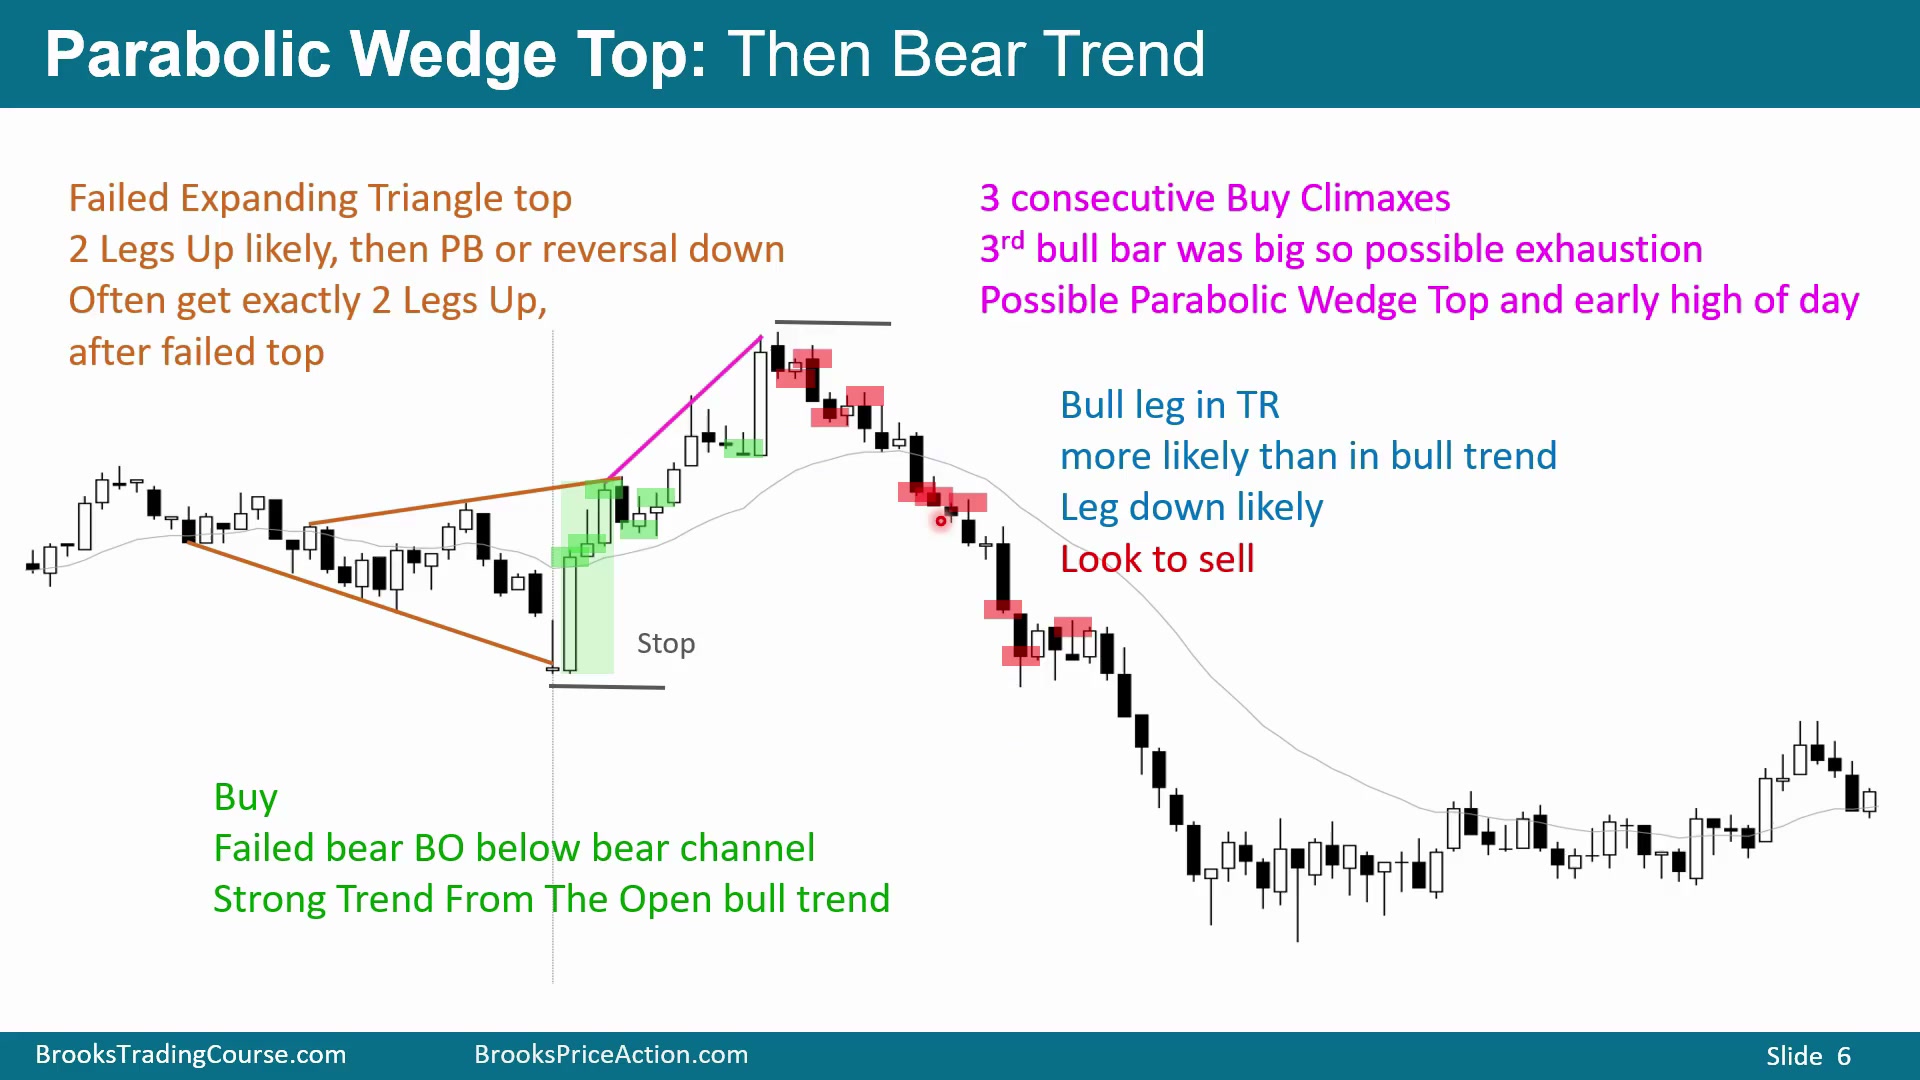
开盘常见的一种形态是 parabolic wedge top。图中前一天是熊通道,也就是 bull flag;可以数出三推下跌:第一推、回调、第二推、回调,今天开盘完成第三推,形成 wedge bull flag。随后市场向上突破并有跟随买盘,一根大阳线足以让市场大概率转为 Always In Long,开始尝试从熊通道中恢复上涨。
多头会在多个位置买入:买强阳线收盘,买后续阳线收盘,在空头 K 线下方买入、押注反转失败,买 High 1 恢复上涨,也买回调突破。可是每当强上涨连续制造 buy climax,又出现第一腿、第二腿以及第三腿买入形态时,必须想到它可能是 parabolic wedge top,并且可能很早形成当天高点。
第三推向上时,如果出现一根特别大的阳线并收在最高点,要考虑它可能是强上涨的耗尽终点。这段上涨可能只是未来交易区间中的一条多头腿,也可能是转入空头趋势前的最后上涨。图中还可以把结构看成 expanding triangle:三推下跌之后又三推上涨。不过,市场在强突破处已经转为 Always In Long,所以第一次向下反转大概率会失败。顶部尝试失败并向上突破后,通常还会有第二腿向上。
问题在于,突破之后留下连续多个 buy climax:前面一组甚至可以拆成两次,后面又有较小的一次,再加一个 bull flag。交易者必须担心第三次上冲后反转向下,并形成早期当天高点。看到这种结构时,要准备卖出。可以在空头 K 线下方卖,也可以更激进地在最后一根阳线上方卖,押注 parabolic wedge top 不会走太远;更高概率的做法,是等清楚的向下反转、跟随 K 线或突破。
图中先尝试形成 bull flag,但随后向下突破并有跟随 K 线,变成 Sell The Close 式下跌。特别重要的是,大空头突破后出现不错的跟随 K 线;这可能成为 measuring gap,为第二腿下跌提供依据。可以卖出收盘,更高概率的位置是突破和跟随之后,也可以卖 Low 2 bear flag:一根阳线形成第一腿上,空头 K 线后又第二腿上,然后向下卖出。
典型 parabolic wedge opening reversal 一旦开始向下反转,通常会在相当紧的熊通道中下跌 5 到 10 根 K 线。如果只跌五六根后横盘或小幅反弹,它可能不是 parabolic wedge top 引发的空头趋势。图中则符合空头趋势案例:先是紧熊通道中的反转,然后继续出现空头突破,多处都可以视为 Sell The Close。
这类开盘反转的关键不是顶部标签,而是反转后的行为。若第三次 buy climax 后只横盘,顶部交易很可能失败;若向下突破后有跟随、形成可能的 measuring gap,并且每次小反弹都变成 Low 2 或 bear flag,空头才真正获得优势。做空也有层次:最早在 wedge 顶部下方卖是风险收益好但概率低;等突破和跟随后卖,概率更高但止损更远、剩余利润更少;等 Low 2 bear flag 再卖,则是在趋势已经更清楚之后参与。
抛物线楔形后的风险收益选择
Time: 20:35
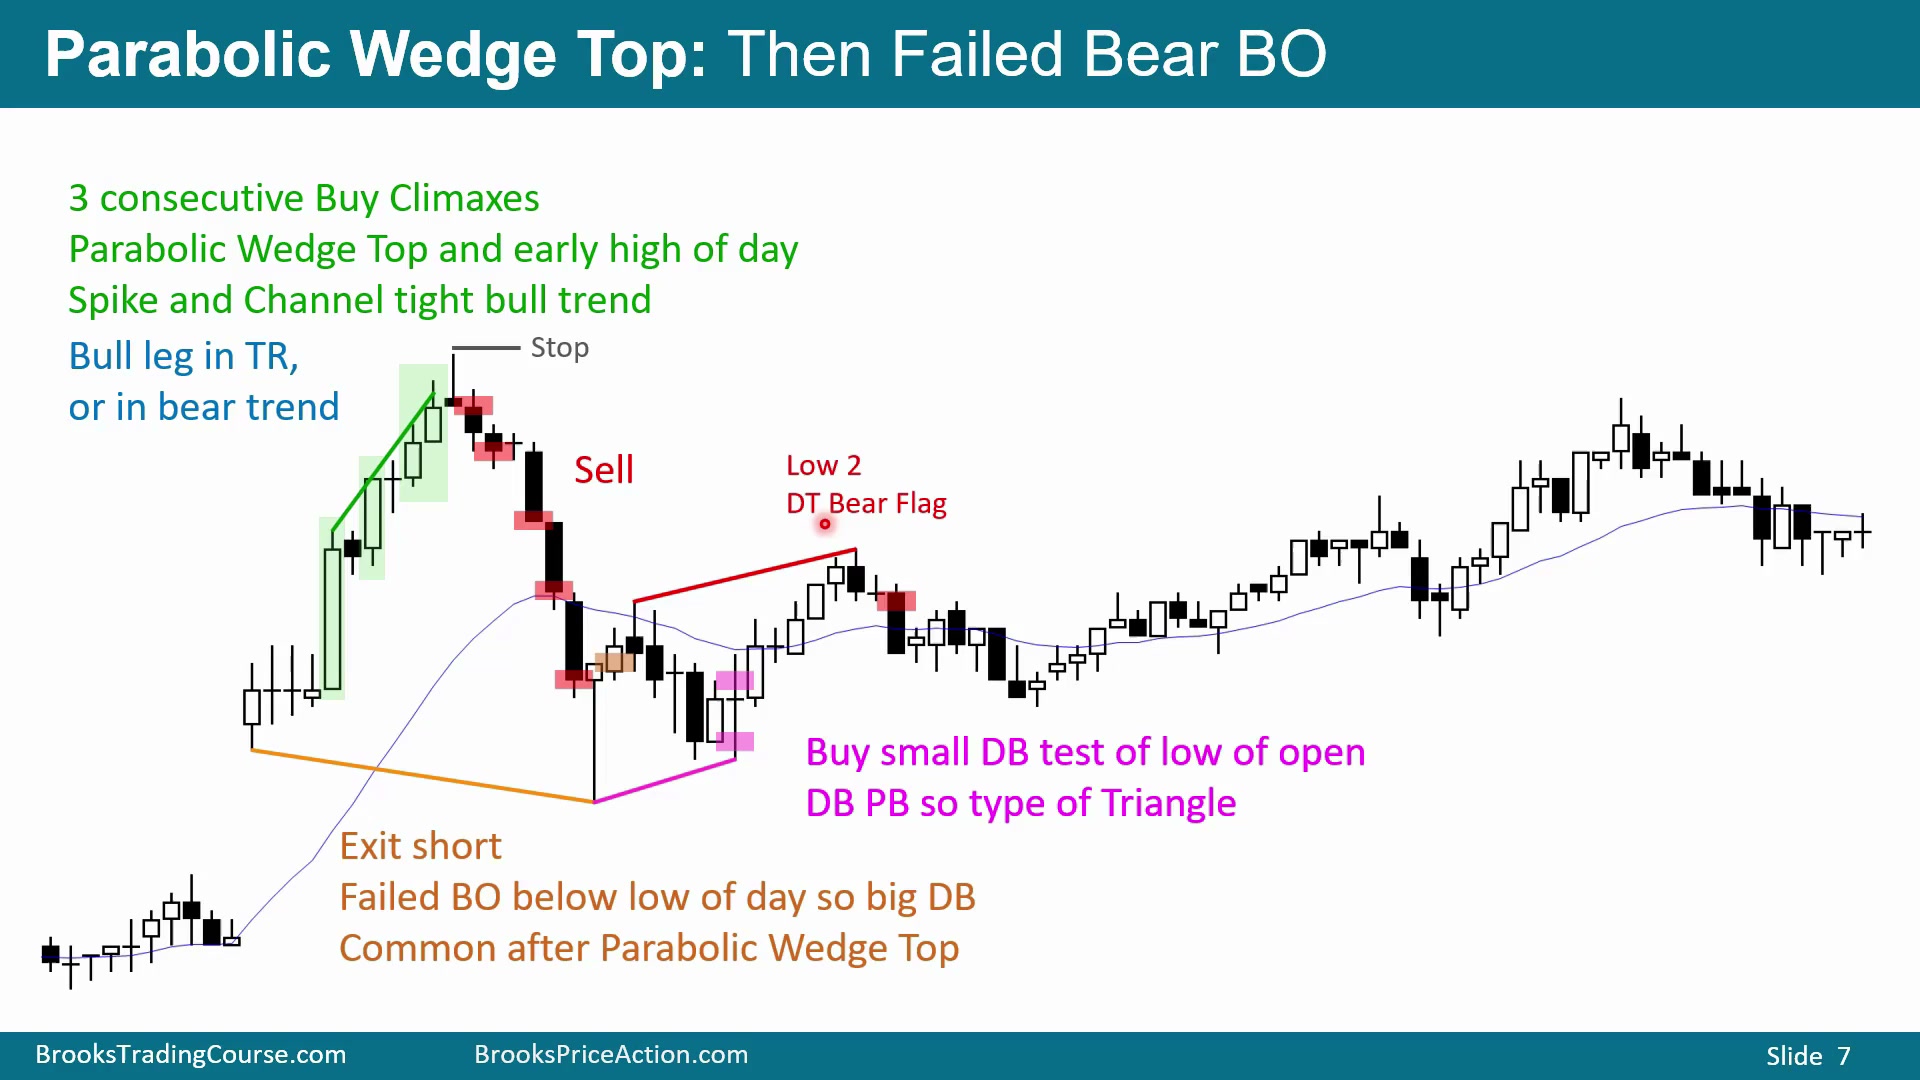
图中上涨可以看成一组 spike and channel。先是一根大阳线后接空头 K 线,再是一根大阳线和 doji,之后又有两根 K 线突破。整体可以数成第一推的 spike、第二推、第三推,因此必须考虑它是否会成为 parabolic wedge 当天高点。
极紧 spike and channel 牛趋势后出现不错的做空信号 K 线。这个做空信号概率并不特别高,市场更可能先横盘;但它仍然是合理做空,因为潜在收益远大于风险。交易者可以早卖,也可以等后面的空头收盘。等待收盘会提高继续下跌的概率,但通常剩余利润更少、止损更远、风险更大。早入场是低概率但风险较小、风险收益更好;晚入场是高概率但风险收益更差。两种选择都合理。
价格跌破当天新低后,图中出现强烈向上反转。parabolic wedge selloff 到达当天低点时,经常会出现这种大反转。市场正在决定:是基于 buy climax 的高度继续下跌形成 measured move,还是横盘,或者反弹进入牛通道;图中选择了后者。
从多头角度看,这是 double bottom 买入。虽然前面熊通道很紧,第一次反转大概率只是 minor reversal,通常先横盘 5 到 10 根 K 线,但这个买入仍然可以接受。后面还有一个熊突破后的回调:图中出现 doji、多个近似 doji,而且知道开盘处有多头买入、低点附近也有多头买入,所以交易者可能再次在买入区买。该阳线虽然也是熊突破回调后的卖出信号,但做空信号很差,多头可能在它低点用限价单买入,或在其高点上方用止损单买入。
接下来结构是 double bottom pullback 和三推下跌:小尾巴可以算第一推,之后第二低点、第三低点。它更像三角形 BreakOut Mode 情况:double bottom、向上反转,再回调测试 double bottom。这个位置是当天低点的合理候选。
反弹途中出现 Low 1,并且上涨缺乏连续的大多头趋势 K 线。虽然有连续阳线,但实体缩小,夹杂 doji 和影线,看起来更像交易区间中的多头腿。价格回到空头腿的 50% 回调附近,也可以看成 double top bear flag 或 wedge bear flag。因此,这里更合理的预期是横盘到下跌,Low 2 或 wedge 位置又成为一个做空机会。
交易区间中的双底高低点与尾盘楔形
Time: 24:10
图中市场开始尝试恢复上涨。向下段并没有连续的大阴线,而是阴线、阳线、阴线、阳线、阴线和 doji 交替出现,所以更像交易区间中的一条空头腿。与此同时,低点逐渐抬高:low、higher low、higher low,市场可能正在形成牛通道,并开始出现 higher high 和 higher low。
因此,图中的 double bottom higher low 是合理买点。两个低点不必完全同价;只要是弱下跌后的双底高低点,多头就会在阳线高点上方买入反转。随后上方又形成多种可数的三推上涨:第一推、第二推、第三推,或用每次空头 K 线分隔来数。略创新高之后,整体仍然像交易区间价格行为。
既然前面空头能在某根 K 线上方卖出并获利,后面也可能在另一根 K 线上方卖出并获利,尤其是这里可以用几种方式画出 wedge bear flag。随后出现一根收在低点的阴线,交易者会在其低点下方卖出,尝试抓向下波段;但他们也知道,更可能只得到 scalp。
市场再次向上反转时,不一定要在空头 K 线上方买;等阳线或第二根阳线高点被突破,买入概率更高。后半段的 higher low 连续出现,高点也不断抬高,牛通道已经很清楚。有些交易者喜欢在 K 线下方用限价单买入,另一些则在市场向上反转时买入。
尾盘位置又出现第一推、第二推、第三推向上,并尝试突破牛通道。市场先尝试一次、再尝试一次,随后出现空头 K 线和第二次做空入场。对于多头,这是退出多仓的好位置;对于想做空的交易者,也可以在收盘前寻找向下 scalp。该结构是 wedge lower high,加上第二次卖出信号:第一次反转向下,第二次反转向下。
开盘连续卖出高潮与抛物线楔形底
Time: 26:37
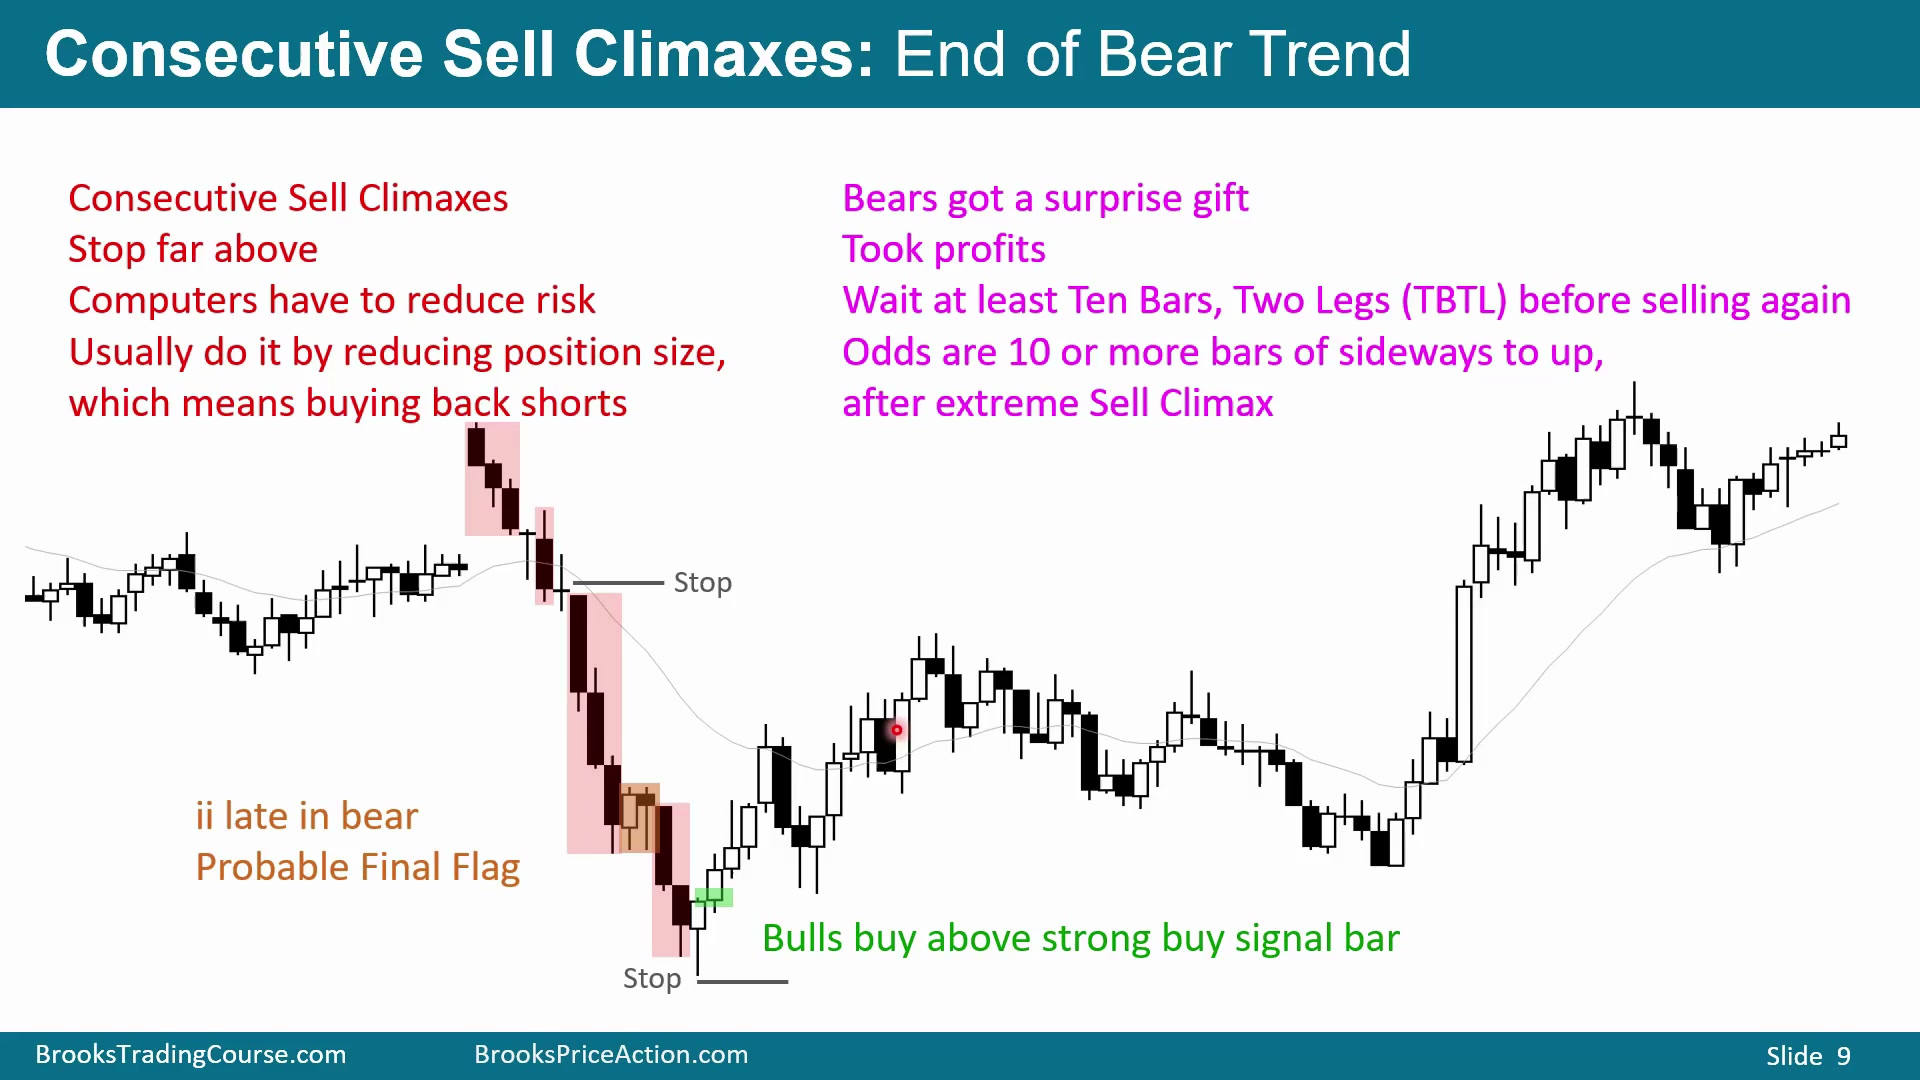
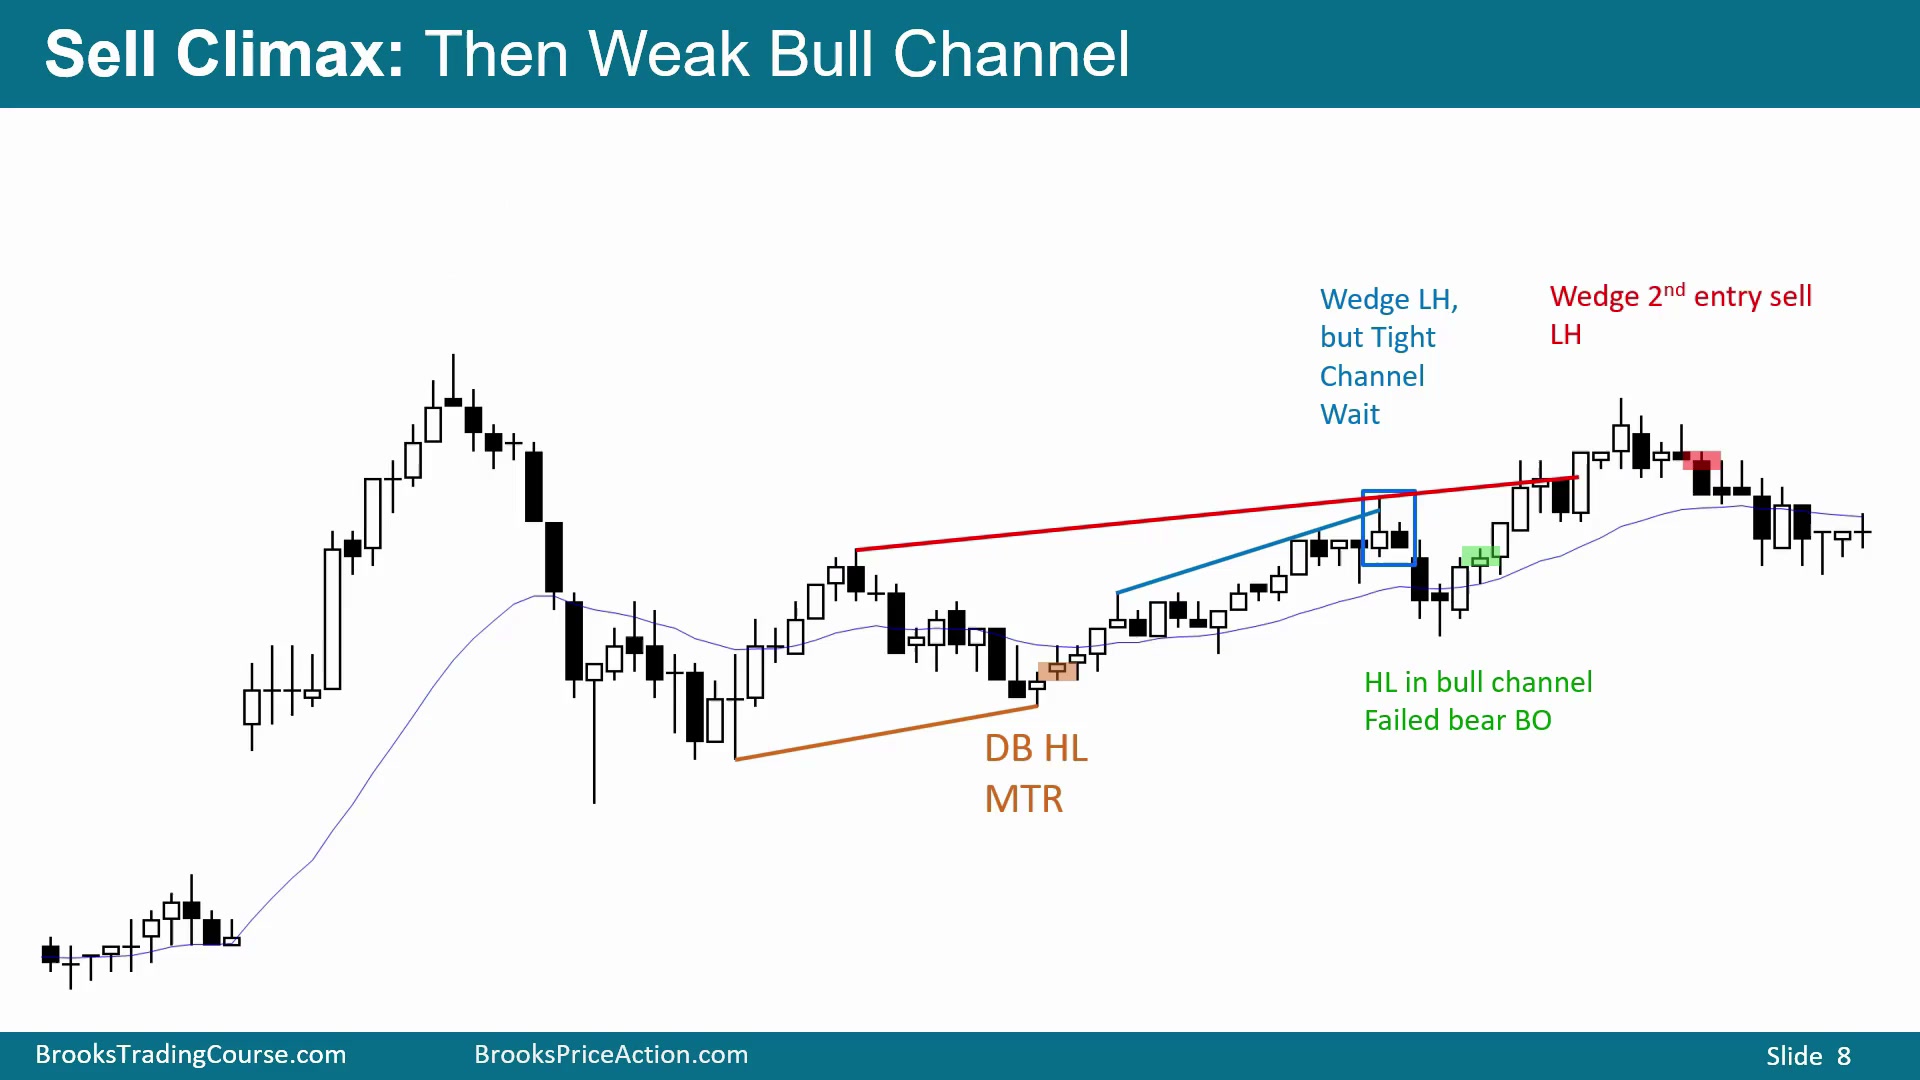
parabolic wedge 不只会出现在上涨顶部,也会出现在下跌底部。图中第一腿下跌可以结束在某根 doji,也可以结束在另一根 doji;之后第二腿下跌、第三腿下跌,形成三段 sell climax。开盘若连续出现三到四个 sell climax,就必须想到 opening reversal:抛物线楔形下跌后向上反转。
这段下跌中几乎任何位置做空都可以被看成 Sell The Close。问题是,如果空头在低位继续卖,止损离得很远,却只预期还会再跌一点,而不是再跌很多。为了控制风险,最简单的方法就是回补一部分空头。连续 sell climax 之后,空头不再期待还有大幅下跌,开始获利了结;他们的买回本身就可能引发反转。
由于这是开盘 parabolic wedge bottom,它可能最终成为当天低点。即使低位空头愿意继续卖,也可能把止损缩到最大 sell climax 顶部附近。最强的空头突破如果正好是趋势里的第三个 sell climax,就要想到:也许还有一腿下跌,但大概率不会再有两三腿;这更可能是空头趋势中倒数第二腿。
图中后面出现 ii bear flag,它可能是 final bear flag。可以卖,但必须准备好向上反转。一旦看到不错的多头反转 K 线,就可以考虑买入。由于前面是非常紧的熊通道,第一次向上反转大概率只是 minor reversal;它可能上涨 5 到 10 根 K 线,图中甚至接近 15 根,然后回测低点并尝试形成 major trend reversal。
第一次 major trend reversal 尝试失败后,市场走出第二腿下跌;后面再次尝试并成功。parabolic wedge bottom 之后,有一根不错的多头反转 K 线,而且止损可以相对紧,这就是不错的买入。此前从高位或低位做空的空头,会被这段快速大跌带来的利润惊到,急于获利了结;这种“突然给了很多利润”的心理,也增强了向上反弹。
parabolic sell climax 之后,市场通常至少上涨几腿、至少 10 根 K 线。图中向上反弹又形成第一腿、回调、第二腿、回调、第三腿,成为 wedge lower high。由于上涨通道很紧,空头未必能立刻走很远;但因为它仍然是紧熊通道后的 minor reversal,通常还会有第二腿向下。
紧熊通道后的高低点反转与止损选择
Time: 30:05
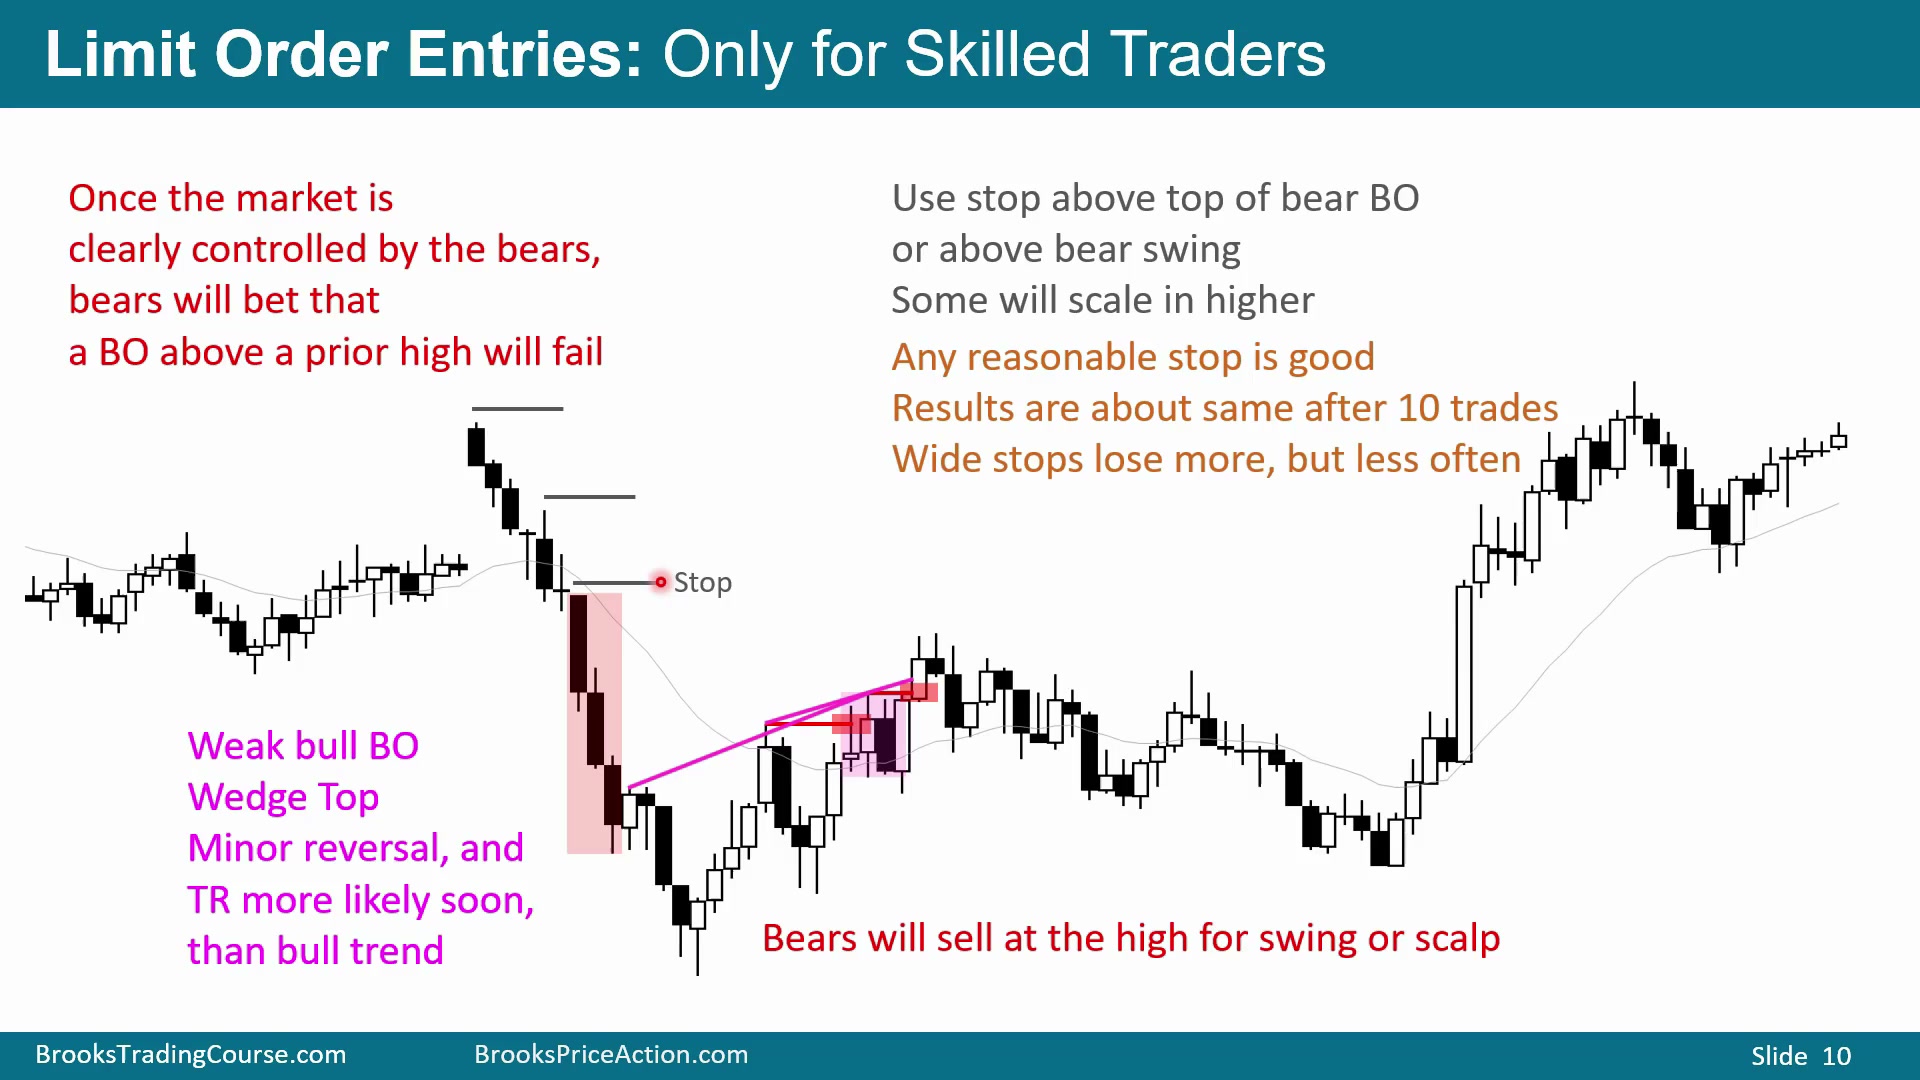
当市场已经明显由空头控制,空头会押注第一次向上反转走不远。图中随后出现一段多头趋势,但 K 线并不特别大,只是可以接受;紧接着出现不错的空头 K 线和另一根空头 K 线。市场形成 micro double bottom 和 higher low,但下跌只有两三根 K 线,上涨也只有四五根 K 线,K 线数量不足以构成真正的 major trend reversal。
所以,这里虽然可以称为 higher low major trend reversal,但更可能只是 higher low minor trend reversal,也就是未来交易区间中的一条多头腿。既然它更像交易区间多头腿,交易者会寻找向下反转:可以在强空头 K 线下方卖,也可以等价格稍微再涨后卖。
空头还会开始在 K 线上方用限价单卖出。逻辑是:如果这只是交易区间里的多头腿,前高上方卖出合理,因为市场大概率很快回落。止损位置有几个选择。最高概率的止损通常放在整段空头腿、空头趋势的顶部上方,但风险最大;也可以放在 lower high 上方,或放在 sell climax 高点上方。若市场要继续形成空头趋势,走出 lower high、新低、lower high、新低并向下通道,它不应该越过 sell climax 的高点。
这些止损都合理。宽止损被打中的频率较低,但单次亏损更大;窄止损亏得少,但更容易被打到。若重复交易十次类似形态,使用合理窄止损或合理宽止损,长期结果通常接近。关键不是追求唯一正确止损,而是选择与入场逻辑一致、风险可承受的位置。
小回调牛趋势中的负缺口
Time: 32:20
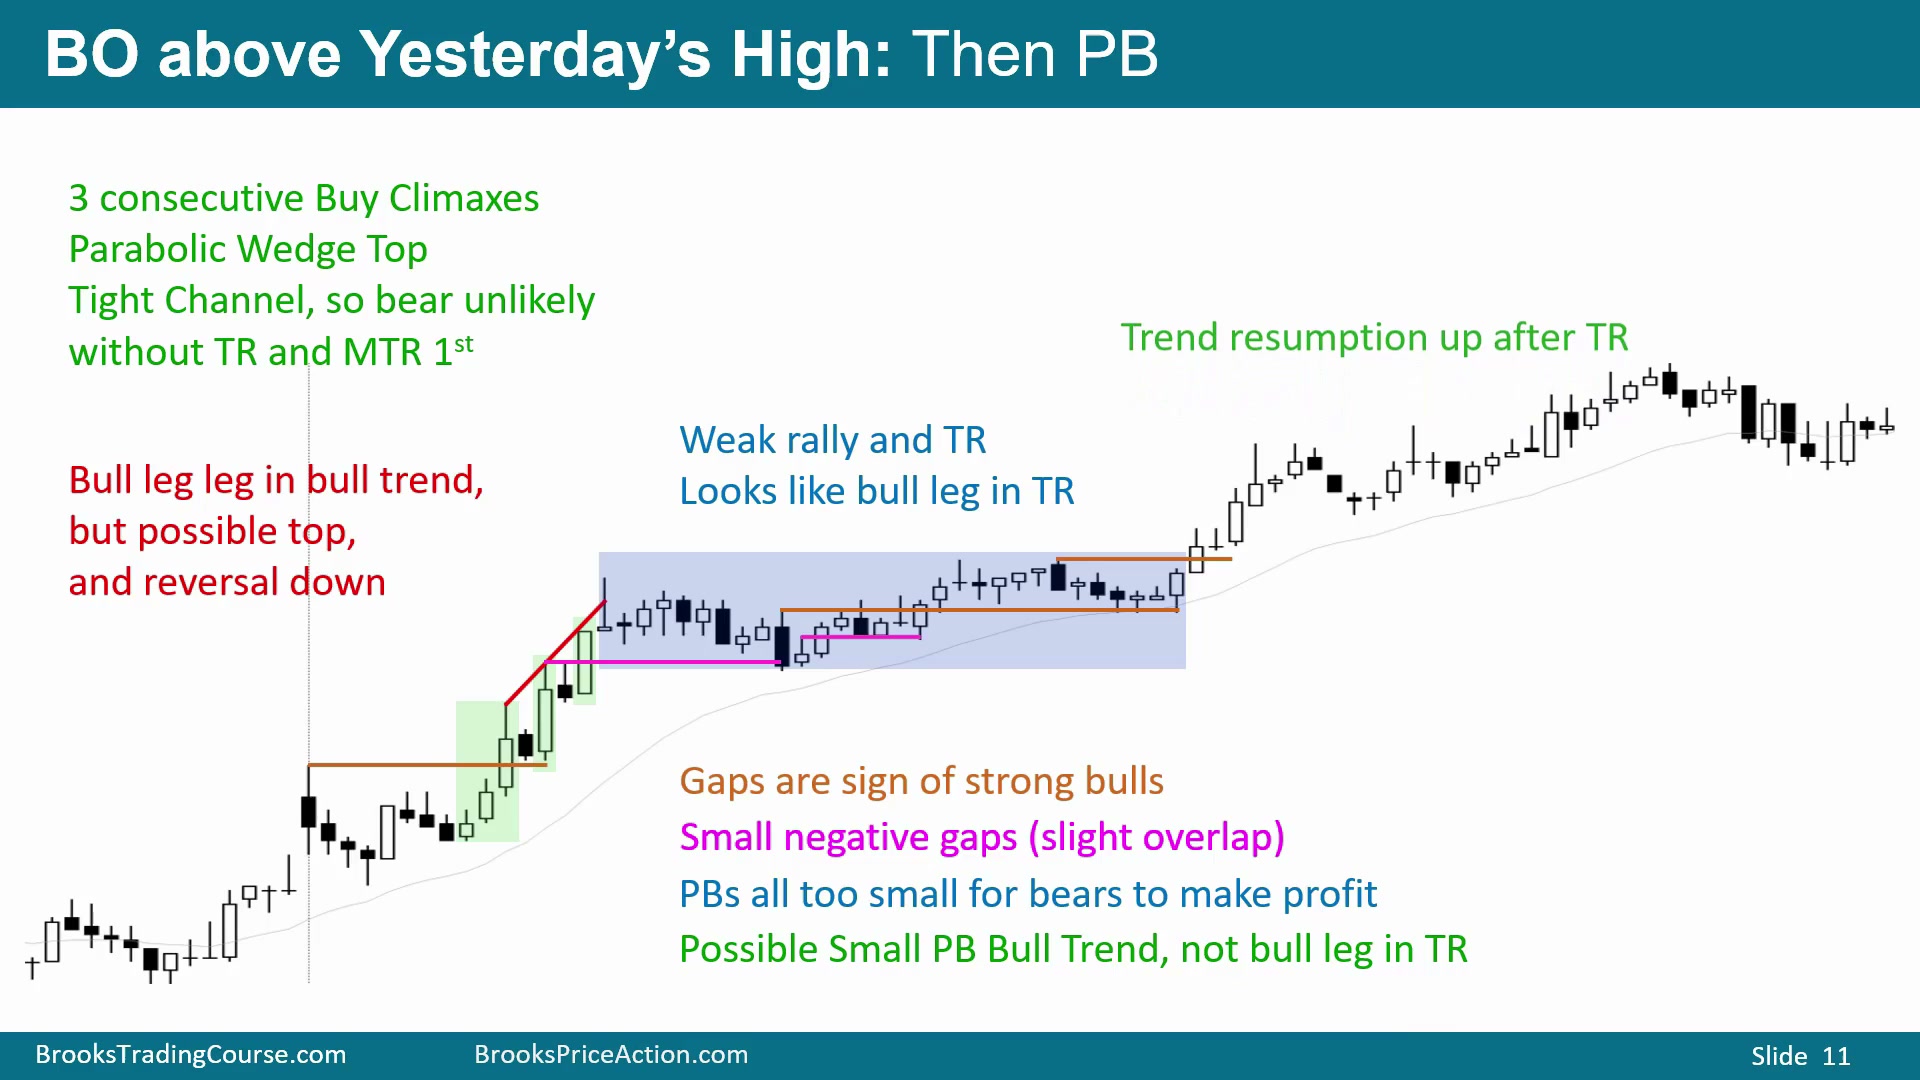
图中开盘后先有 buy climax 和回调,又有 buy climax 和回调,随后继续 buy climax。可以把它数成四个连续 buy climax,也可以认为某个强突破足以重新开始计数,形成三推上涨。因此它是潜在 parabolic wedge top。
但真正的 parabolic wedge top 若要成功,反转后通常应该在相当紧的熊通道中下跌。图中没有这样下跌,而是以较紧的通道横盘。这会降低顶部成功的概率,并提高市场横盘后恢复上涨的可能。后面的上涨尝试也不强:小 doji、大量重叠、每隔几根 K 线就回调。它不像强牛趋势恢复,更像交易区间中的一条多头腿;前面的下跌也不像熊趋势,更像交易区间中的空头腿。
同时,图中又出现几个对多头有利的强势细节。某次回调没有跌破前一高点,这是强牛趋势迹象。抛物线楔形顶部后的卖出没有向下走远,而是大多横盘,对多头有利。回调和突破点之间还留下 gap;即使价格后来略有重叠,也可以看作 negative body gap,说明卖方无法压出足够深的回调。
这些 gap 或负缺口增加了趋势恢复向上的概率。观察空头是否能赚钱也很重要:如果空头在几个可能的止损入场处卖出,后面的回调都太小,几乎无法获利。这说明空头没有足够空间,市场正在形成小回调牛趋势的条件。
因此,虽然上涨表面看起来弱、像交易区间多头腿,但小回调、gap、负 gap 和空头无法赚钱结合在一起,构成 Small Pullback Bull Trend 的成分。合理做法是寻找买入,押注价格继续走高。图中最终确实在交易区间之后恢复上涨。
这里也说明,parabolic wedge top 不能只凭三推就卖到底。如果空头在几个合理入场点都无法得到可获利的回调,而多头每次只允许很小回撤,就要把“弱上涨”重新解释为小回调牛趋势。交易者要同时读两组证据:K 线实体小、重叠多,说明它像交易区间;但回调太小、存在缺口、空头赚不到钱,说明多头仍然控制价格。后者一旦占优,继续找买点比反复卖顶部更合理。
跳空后两根强阴线与均线双底
Time: 35:22
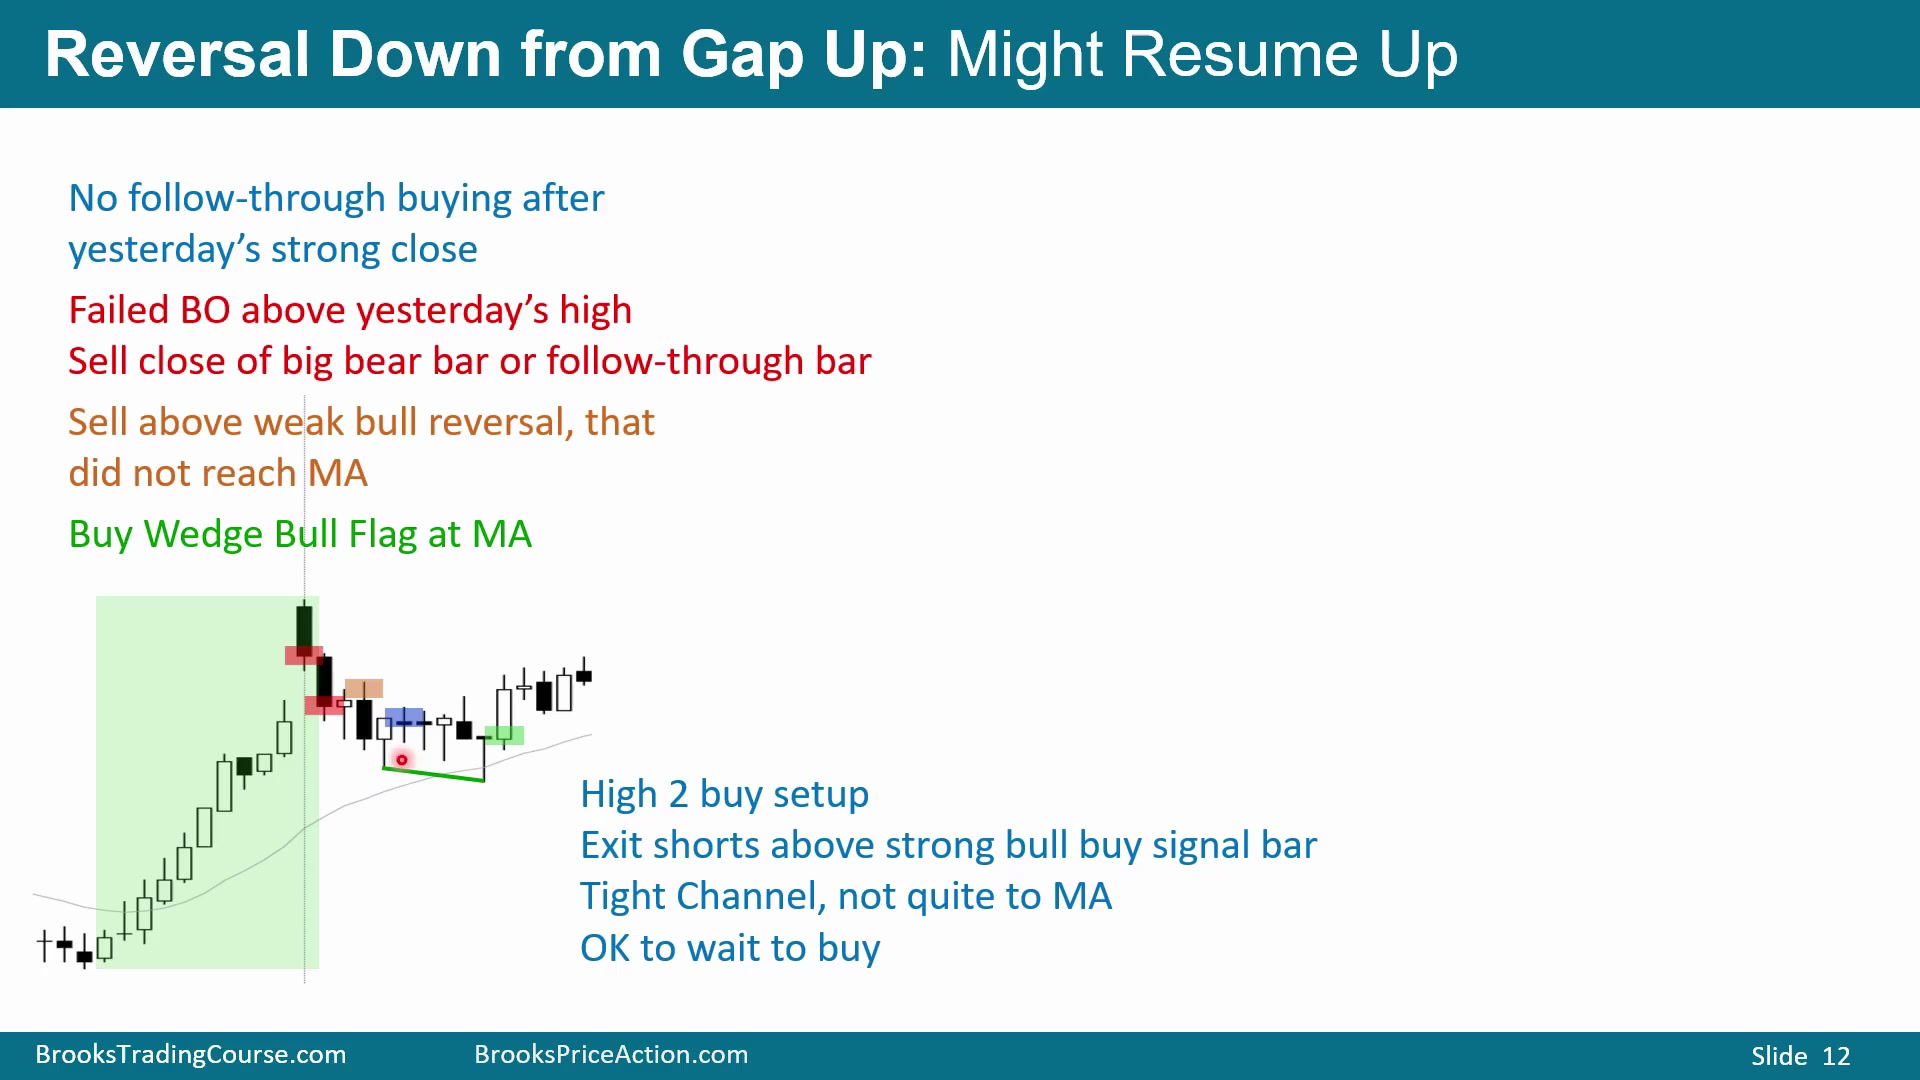
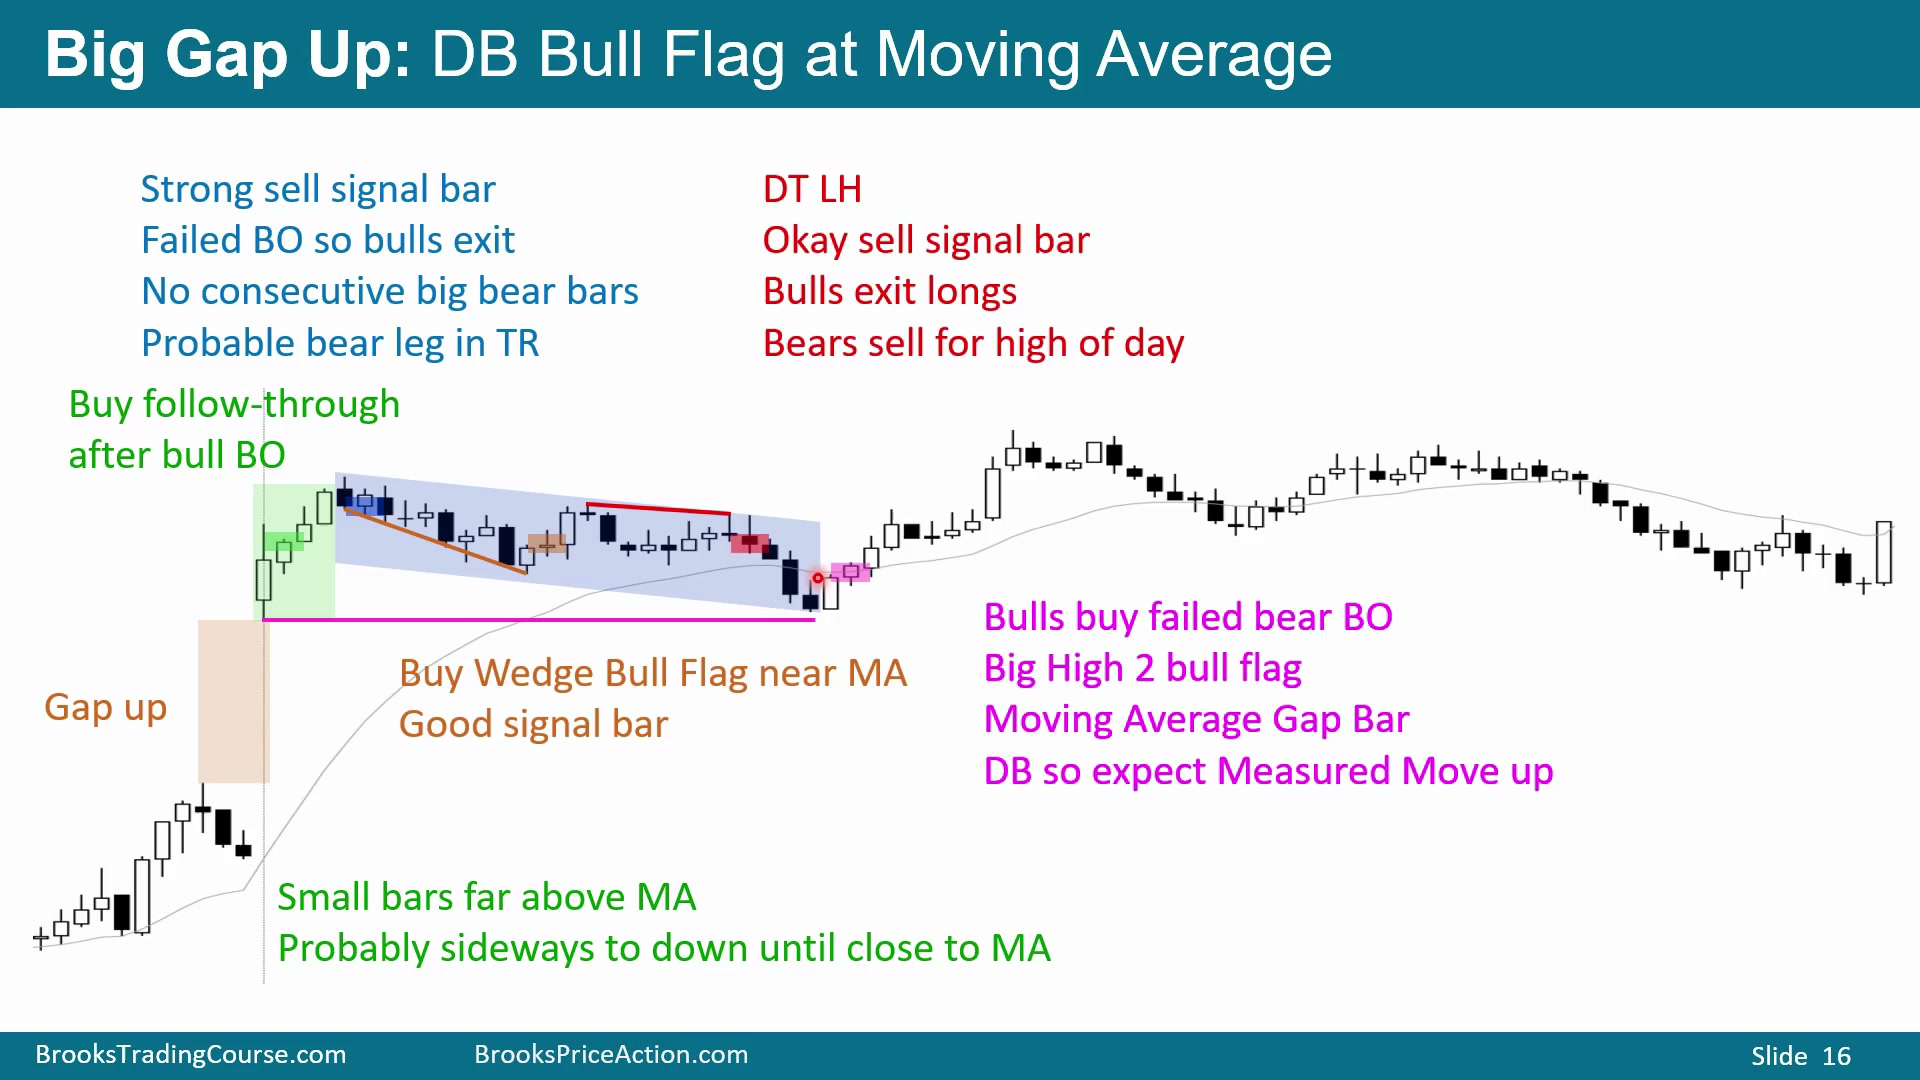
图中跳空高开后立刻出现两根收在低点的大阴线。此时市场大概率 Always In Short,空头会在前一根 K 线高点上方卖出。即使下一根是多头反转 K 线,它也只是小 doji,前面却是两根更大的空头 K 线,所以该高点上方大概率有卖盘。
前一天有强上涨,但今天开盘后的跟随看起来更像空头腿或紧交易区间,多头还没有高概率优势。交易者可以在空头 K 线下方卖出失败突破前一天高点,也可以卖收盘,押注至少还会再跌一点。两根强阴线之后,空头通常会在第二根收盘后立刻挂限价单卖它的高点;图中随后价格上破该高点,空头成交,至少有 scalp 空间。
从多头角度看,下跌形成第一腿、回调、第二腿,随后出现小 double bottom 和 High 2 bull flag。这里可以做多,后面又有一个小 High 2:High 1 失败,High 2 触发。不过,多头止损仍在低点下方。若前面已经做空,看到这些反转迹象,应考虑在几根关键 K 线上方离场,因为走势并不像会快速大跌,更像横盘。
左侧背景也支持谨慎看空:前一天上涨非常强,今天虽然跳空后反转向下,却没有跌得很远、很快。它可能最终只是 bull flag。更高概率的多头入场,是等真正向上突破和跟随;但空头至少应准备退出。图中还有小 double bottom 下破失败后向上反转,可以称为 wedge bottom,也可以简单看作均线附近的 double bottom 和 High 2 bull flag。这是在开盘中合理的多头买点。
开盘下跌到均线后的牛趋势日尾巴
Time: 37:40
开盘连续出现大阴线时,市场短线是 Always In Short。但如果左侧还有极紧牛通道,向下空间通常不大,均线附近大概率有买盘。交易者会等待价格跌到支撑后向上反转;开盘时最常见的支撑之一就是均线。
图中开盘下跌到均线支撑,随后形成 opening reversal 并上涨。这段小下跌可能最终只是在日线阳线底部留下下影线。多数日线阳线都有下影线,它们常常由早盘先下跌、随后反转上涨形成;多数大阴线日线也有上影线,通常由早盘先上涨、随后反转下跌形成。
向上突破后,市场形成 spike,随后进入回调,可能开始向上通道。交易者会寻找回调买入;图中再次回调到均线附近后,多头继续在反转向上时买入。这个案例强调,开盘连续阴线本身并不够,必须结合左侧极紧牛通道和均线支撑判断。
高开横盘到均线后的双底突破
Time: 39:00
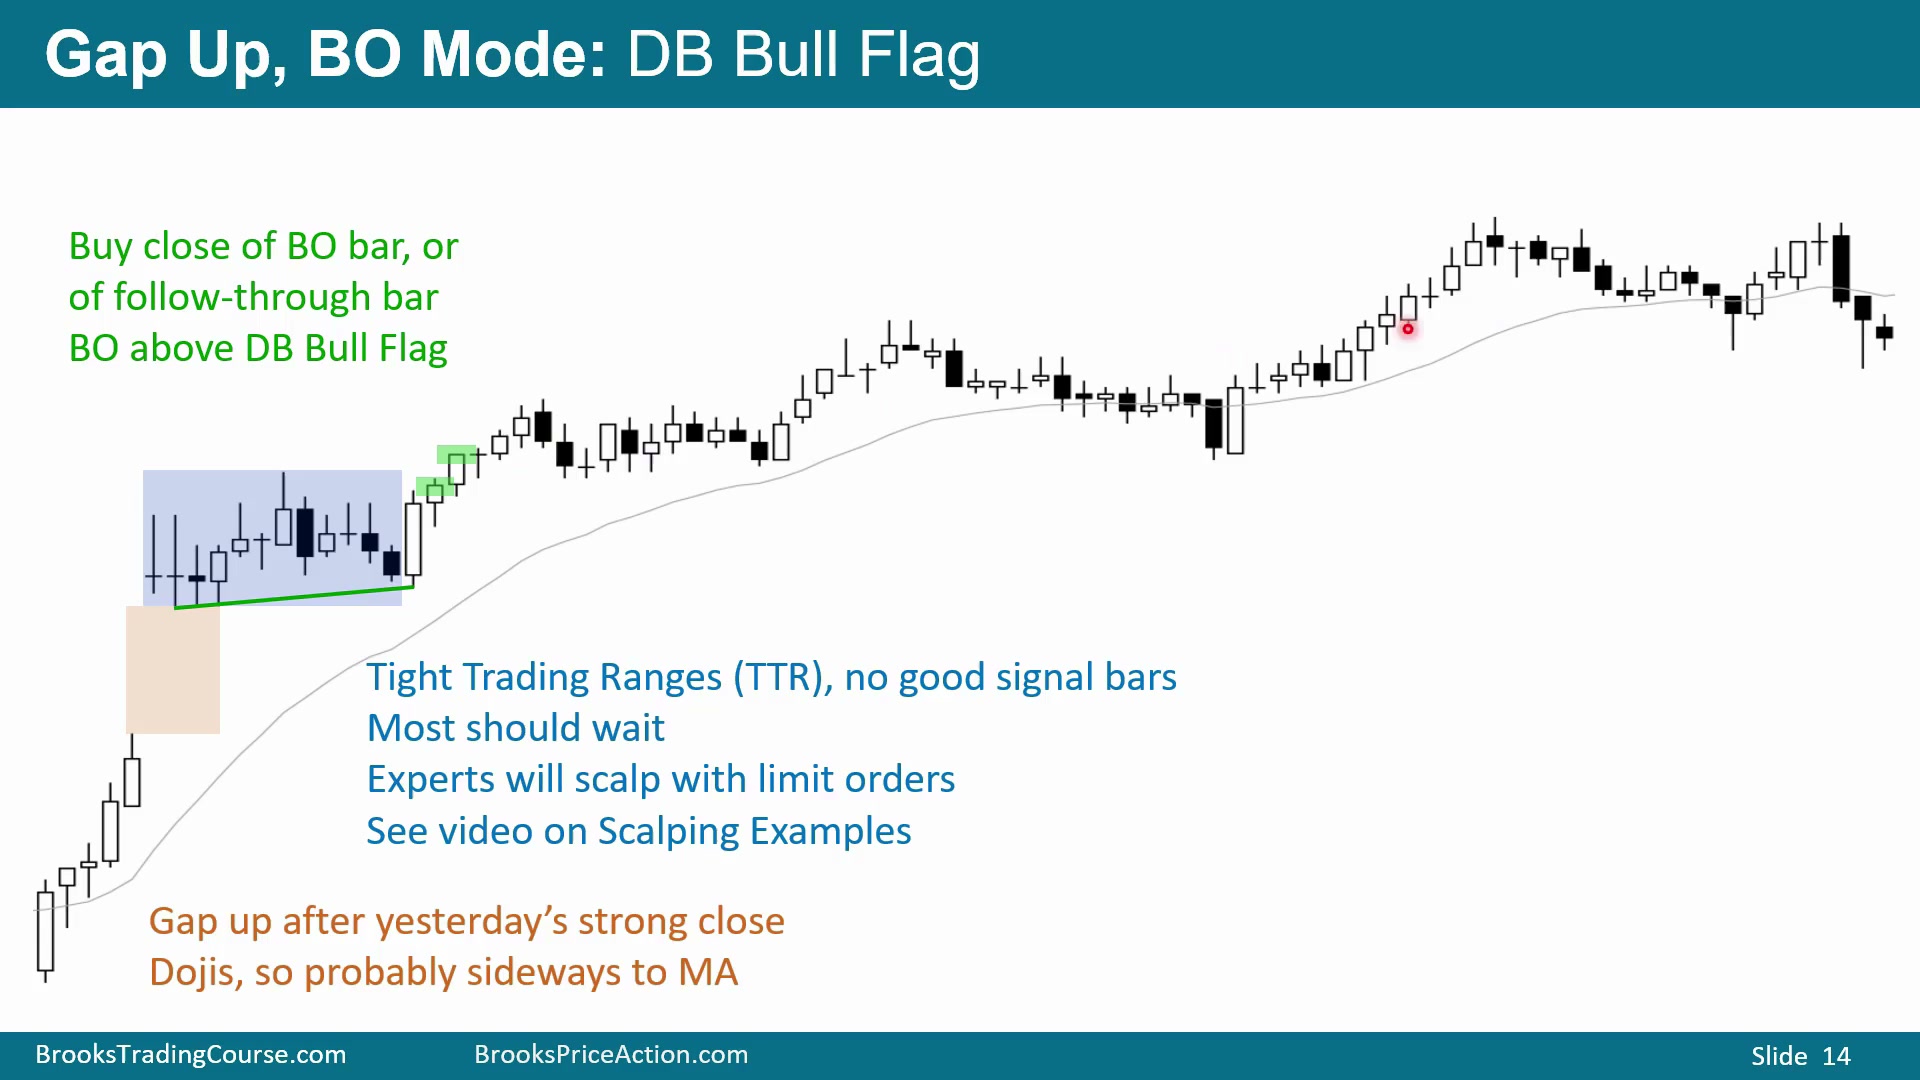
前一天尾盘是相当强的 Buy The Close 上涨,今天高开。但开盘前三根都是 doji,前六根里五根是 doji,后面又继续出现 doji。这样的开盘没有急于买入的理由,更可能先横盘,直到价格接近均线。
图中市场确实形成紧交易区间。虽然可以在某根阳线上方买入,也可以等待;double bottom 和小 High 2 已经出现,但买入信号 K 线并不好。更高概率的做法,是等向上突破、等跟随 K 线,或等市场明确转为 Buy The Close。
随后价格在均线附近向上突破 double bottom bull flag。这样的突破通常至少带来两腿上涨。市场在开盘后一两个小时内通常会形成一段波段,而该波段通常持续两到三个小时;因此这里可能是未来两三个小时上涨趋势的开始。实际走势中,它成为持续到收盘的上涨趋势起点。
紧交易区间中的高低点通道与失败下破
Time: 40:20
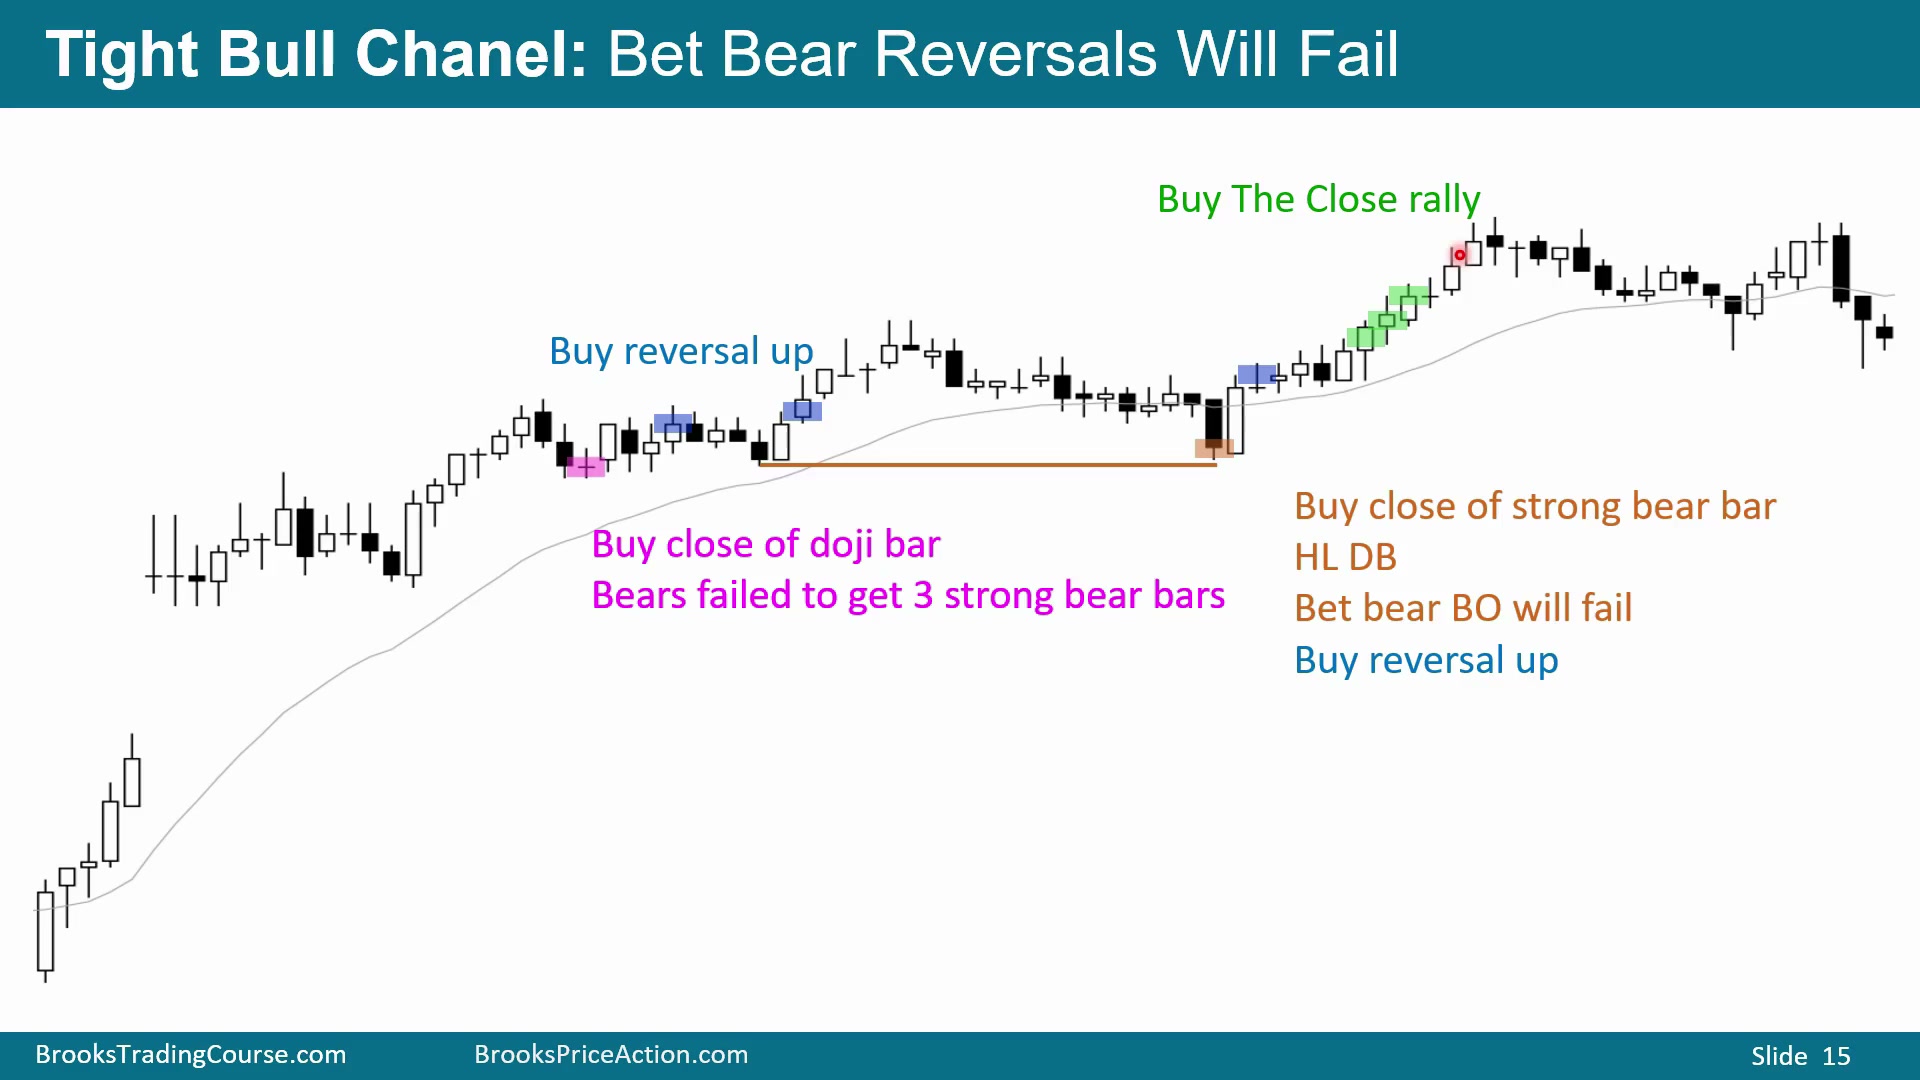
图中虽然有大量 doji 和多个紧交易区间,但价格结构仍然是高点抬高、低点抬高:high、higher high、higher high,higher low、higher low、higher low。市场仍处在牛通道中,因此做空要非常小心。回调幅度都不大,更好的策略是等待回调和反转尝试,然后押注反转失败,买入重新向上的走势。
每一次向下反转尝试都可能只是新的 bull flag。图中多次尝试向下后又向上反转,可以在反转处买入,也可以等强两根 K 线反转确认。某次下破均线失败后,市场出现强的两根 K 线反转,这是更清楚的多头证据。
空头一度得到两根空头 K 线。通常交易者希望看到三到四根连续阴线,才会判断空头真的获胜;正因为只有两根,很多多头会在第二根阴线收盘买入,押注空头拿不到第三根。随后也会在恢复上涨时买入阳线高点突破。
图中尝试向下突破,但没有跟随 K 线,反而反转向上,并且形成略高于前低的 double bottom higher low。此时更合理的押注是空头失败、市场继续走高。尾盘附近市场变成 Buy The Close 牛趋势,交易者持续买收盘;但连续五六根 Buy The Close K 线之后,要准备反转向下,通常在第一根空头 K 线下方退出。
横盘全天与均线缺口后的小反转
Time: 42:30
这个案例也高开后横盘到均线附近,但最终全天都停留在紧交易区间中。开盘看起来对多头不错,先有三到四根阳线,某根收盘后可判断市场 Always In Long,并且像 Buy The Close 上涨。不过 K 线很小,还有明显影线,随后出现空头 K 线,因此更可能横盘到下跌,回到均线附近。实际走势也发展成非常紧的交易区间。
市场一度尝试跌破均线并形成跟随,但下一根 K 线又向上反转。连续阳线重新让市场 Always In Long,可以在 inside bar 高点上方买入。与此同时,图中也出现不错的卖出信号 K 线:一根收在低点的阴线,加上 micro double top 和小 double top。因为上涨足够弱,且存在影线、小 K 线和空头 K 线,市场很可能横盘到下跌并测试均线;早先买入的多头会在该空头 K 线下方或附近退出。
观察下跌本身,同样没有连续大空头趋势 K 线。虽然有一根不错的阴线,但没有持续强阴线;即使下跌持续几个小时,它更可能只是未来交易区间中的空头腿。多头会把下跌数成 wedge bull flag:三到四推下跌后买入向上反转,止损放在前面多头腿底部下方。
空头则看到 double top lower high major trend reversal:先是牛趋势,随后空头突破,然后 double top lower high 和紧交易区间。这个形态有约 40% 概率形成向下波段,也意味着约 60% 概率不会成功。图中确实有突破和跟随,但随后又向上反转,并形成略高于当天低点和开盘价的 double bottom higher low,所以多头会买入反转。
此外,价格在均线上方运行 20 到 30 根 K 线后,出现一根 K 线高点与均线之间有缺口的 gap bar。这样的均线缺口 K 线通常至少会引发 minor reversal 向上,甚至可能形成 measured move 向上。
牛通道上破失败后的深回调
Time: 45:10
前一天先强烈下跌,之后以牛通道收盘。牛通道本质上是 bear flag,因此要考虑向下突破。图中市场尝试向上突破牛通道,但通道上方突破大约 75% 的时候会在约五根 K 线内反转回通道底部;这里仅几根 K 线就反转向下。
上破处还有一组 buy climax:两根很大的多头趋势 K 线。它也可能成为 measuring gap,但因为它是在突破 bull channel 顶部,必须警惕这是陷阱。图中开盘反转向下前,先出现两腿上涨:第一腿、回调、第二腿。虽然当时市场 Always In Long,但这个位置危险,因为它可能是 second leg trap。
既然这是 bear flag 的向上突破,而且大多数情况下会反转向下,交易者会等待做空信号 K 线,例如图中的空头 K 线。多头可以在这里退出,空头也可以卖出。市场虽然一度 Always In Long,但很快跌回通道内,并连续下跌约六根 K 线。此时不宜急着买入,因为下跌通道很紧,而且下方还有目标。
在较宽通道中,要假设回调会很深。图中前面的回调曾回撤多头腿约 75%,另一次也超过 50%。因此,这次回调大概率至少会跌到 buy climax 底部附近,而不是稍微回撤就结束。
Buy The Close 后的加仓、保本与尾盘退出
Time: 47:00
图中强阳线收盘是合理买点,多头会买这根收盘,也会买后面的收盘。多数多头在牛通道上破失败后,会在空头 K 线下方退出;但继续持有多头、押注通道延续也可以接受。前提是必须准备好非常深的回调。
如果买入强阳线收盘,是基于以后可以在更低位置加仓,并期望价格回到第一入场附近,从而第一笔保本、第二笔盈利,那么止损必须合适。止损放在 buy climax 下方通常不够好,更合理的位置是在最近一个主要 higher low 下方,也就是最近多头腿底部下方。
Buy The Close 市场出现大反转和深回调后,交易者会寻找阳线上方买入,例如图中几个位置。但并不是每个位置都好。第一处两腿下跌后尝试买入,但熊通道太紧,不理想;后面出现第一腿、回调、第二腿和 micro double bottom,且可以买在阳线高点上方,是可以接受的买点。即便如此,止损仍然要放在更低的主要低点下方。
加仓的第二笔入场不能离第一笔太近。第二笔的目标是盈利,同时让第一笔在第一入场附近保本退出;因此第二入场最好至少比第一入场低两到三倍 minimum scalp。以 Emini 为例,minimum scalp 是 1 点,那么在阳线高点上方加仓时,第二入场最好比第一入场低约 3 点。
后面仍然是通道,交易者会在每个新高卖出。图中新高处,一些多头会在第一笔入场附近保本退出,另一些会等明确向下反转。后面出现不错的多头突破,至少还可能再涨一点;随后又出现第二次做空入场,而且两次都有空头卖出信号 K 线。由于当天剩余时间不多,这是很好的多头退出位置,也可以成为短线做空位置。
波段入场常常只得到 scalp
Time: 49:35
这些案例的入场逻辑都是按波段交易设计的:开盘反转、强突破后的 measured move、parabolic wedge、交易区间中的失败突破、Buy The Close 后的深回调和加仓管理。实际结果中,许多波段交易最后只给了 scalp 利润,这很正常。重点不是事后知道走势会走多远,而是在入场时根据结构、概率、止损和目标,判断它是否具备波段交易的条件。