al-brooks-course
50C - Scalping
Readable self-study lecture notes for 50C - Scalping.
Source Media
ticks 指标与 gap open bar
Time: 00:09
ticks 是一种市场内部指标,多数券商都会提供。纽约证券交易所有大约 3000 只股票;如果 IBM 当前成交价高于上一笔成交价,它在 ticks 指标中记为 +1;如果 Apple 当前成交价低于上一笔成交价,则记为 -1;价格不变记为 0。ticks 指标就是这些 +1、-1 和 0 的总和。
ticks 可以帮助寻找 scalp。若 ticks 持续在 0 上方,市场偏多,交易者通常寻找买入;若 ticks 在 0 下方,市场偏空,交易者寻找卖出。ticks divergence 也有用:极强市场中,Emini 价格不断创新高,但 ticks 高点越来越低,常常提示即将反转。
本课还讨论 gap open bar。任何时间级别上,如果当前 K 线开盘高于上一根收盘,或低于上一根收盘,就是 gap open bar。连续 gap up bar 且为多头趋势 K 线,属于多头信号,通常会带来更高价格;连续 gap down bar 出现在空头 K 线序列中,则说明卖压非常积极,通常会带来更低价格。
ticks 数值如何计算
Time: 02:01
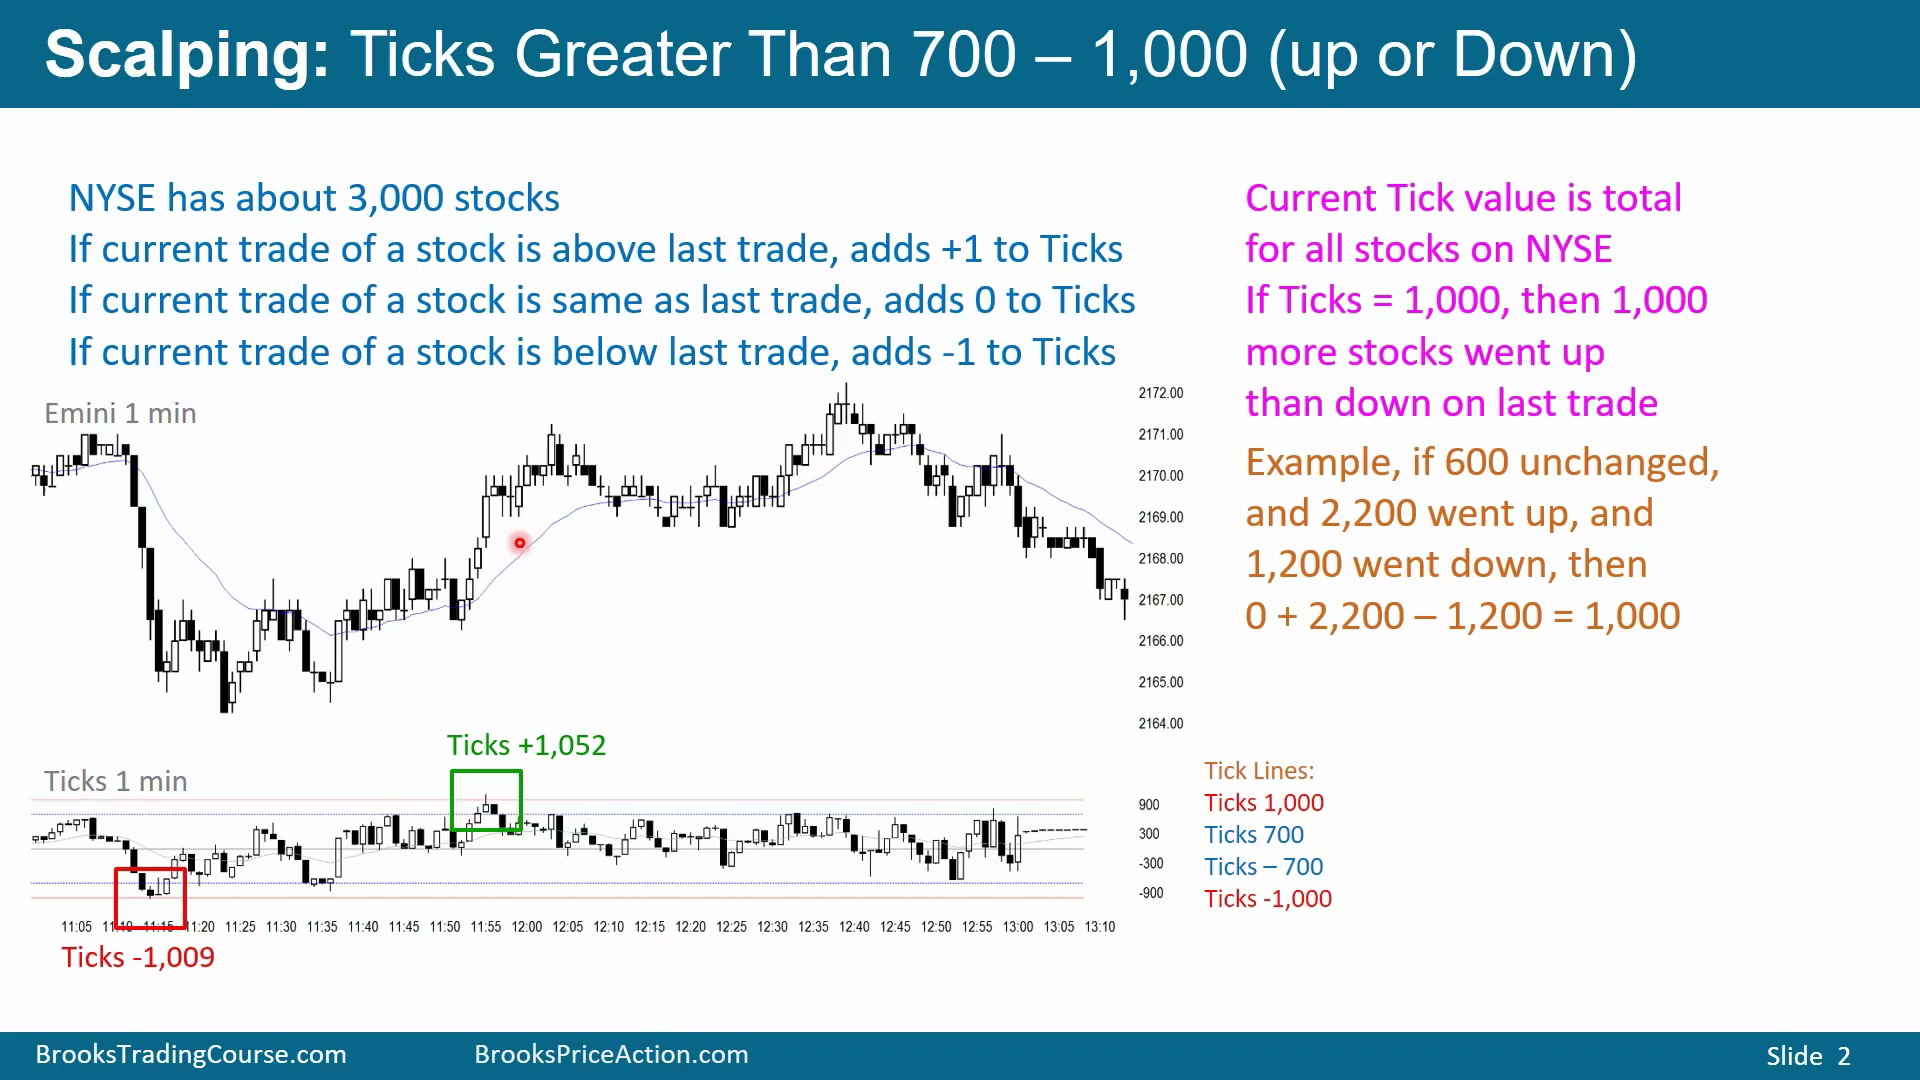
图中上方是 Emini 1 分钟图,下方是 1 分钟 ticks 图。红线分别是 -1000 和 +1000,蓝线是 +700 和 -700。纽约证券交易所约 3000 只股票,每只股票当前成交若高于上一笔成交,ticks 加 1;若等于上一笔,记 0;若低于上一笔,减 1。当前 ticks 值就是这些股票即时变化的总和。
如果 ticks 等于 1000,表示上一笔交易中上涨股票比下跌股票多 1000 只。举例说,某一瞬间 600 只股票不变,2200 只上涨,1200 只下跌,那么 ticks 是 0 + 2200 - 1200 = 1000。图中下方 -1000 附近则相反,表示下跌股票比上涨股票多约 1000 只。
Emini 是基于 S&P 500 的期货合约,不是纽约证券交易所本身,但两者高度相关。因此,当大多数股票上涨时,指数和 Emini 通常也更容易上涨;当大多数股票下跌时,Emini 也更容易下跌。
这些读数不是价格本身,而是市场广度的即时快照。+1052 并不代表 Emini 涨了 1052 个单位,而是上涨股票比下跌股票多 1052 只;-1009 则表示下跌股票比上涨股票多 1009 只。Emini 跟踪 S&P 500 期货,NYSE ticks 来自更广泛股票集合,两者不是同一个市场,但相关性高到足以作为短线判断工具。
熊突破早期的极端负 ticks
Time: 04:40
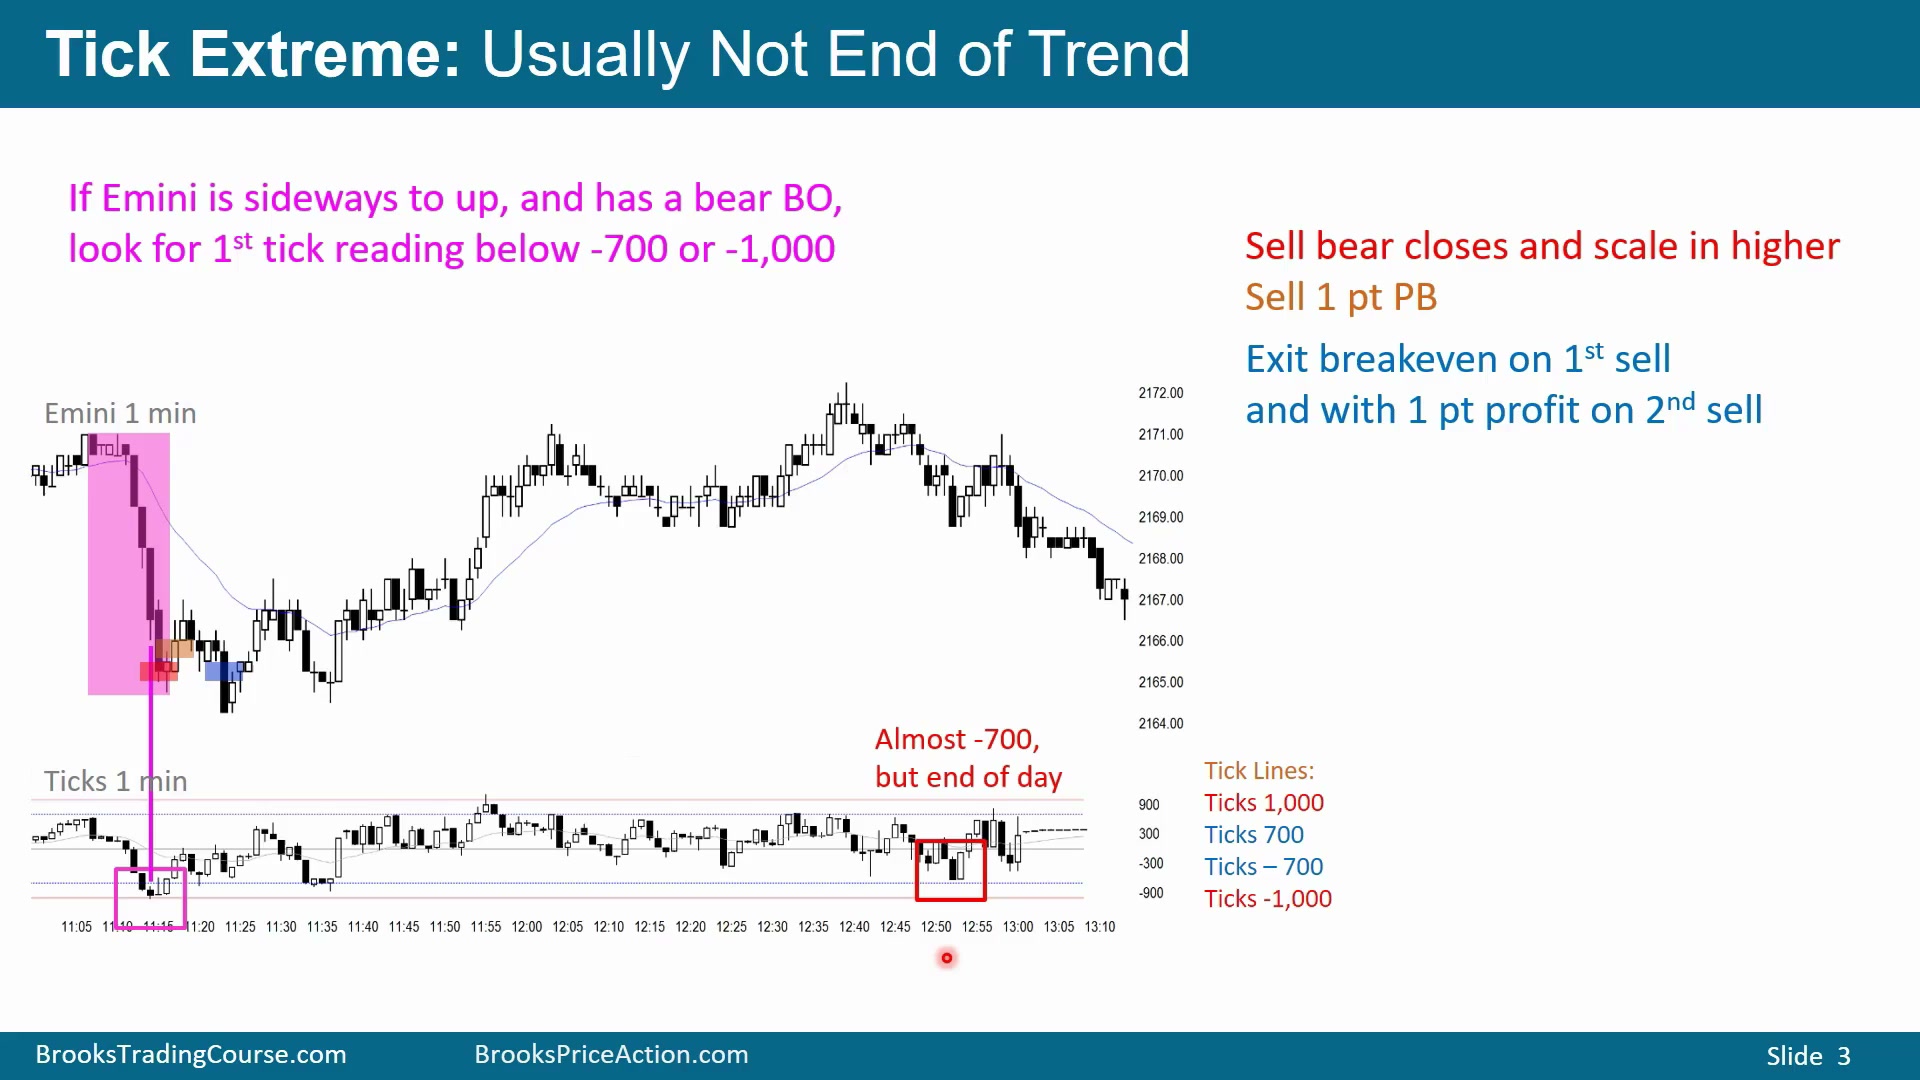
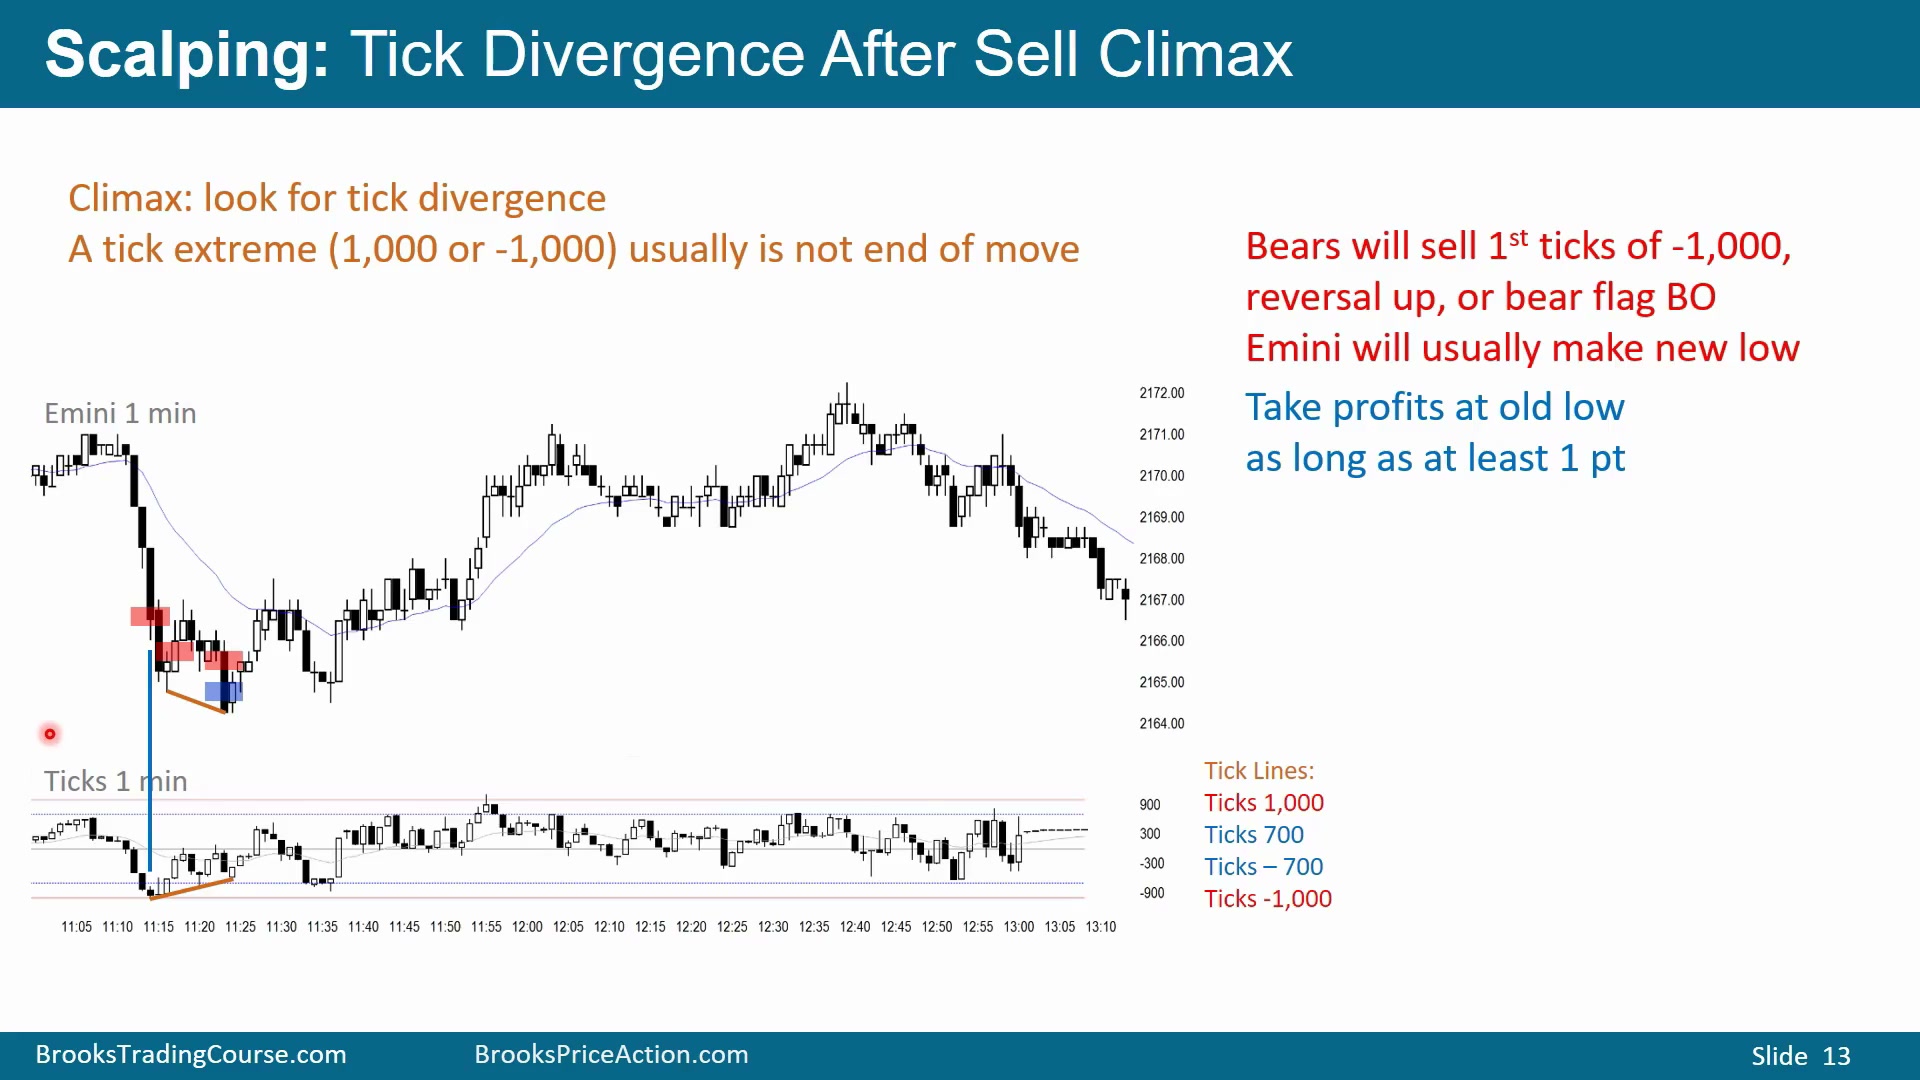
如果 Emini 先横向到向上,然后出现空头突破,交易者会关注第一次跌破 -700,甚至跌破 -1000 的 ticks 读数。这说明下行动量很强,多数股票都在下跌;此时第一次向上反转通常会失败,市场至少会再低一点。
图中的空头突破很强,即使不看 ticks,也能判断第一次反转向上大概率失败并形成新低。看到新空头突破并且 ticks 跌破 -1000,有些 scalper 会立即市价卖出,或卖下一根 K 线收盘,或在反转 K 线上方卖出,押注需要出现“ticks 更高低点、价格更低低点”的 divergence 后,才更可能反弹。
在 Emini 中,这类交易做 1 点 scalp 概率较高。若卖出收盘后价格反弹,交易者可能在高 1 点处加空;止损理论上在上方很远,但他不会等到被打,通常会提前退出。他希望第一笔保本,第二笔拿 1 点;也可以在低点附近退出,因为 ticks 极端低点通常不是价格最终低点,价格往往还会再低一点。若临近收盘,例如 12:50 Pacific Time,剩余交易时间不多,用限价单在反弹中继续卖就更冒险。
极端 ticks 后 scalper 会找各种做空理由
Time: 07:00
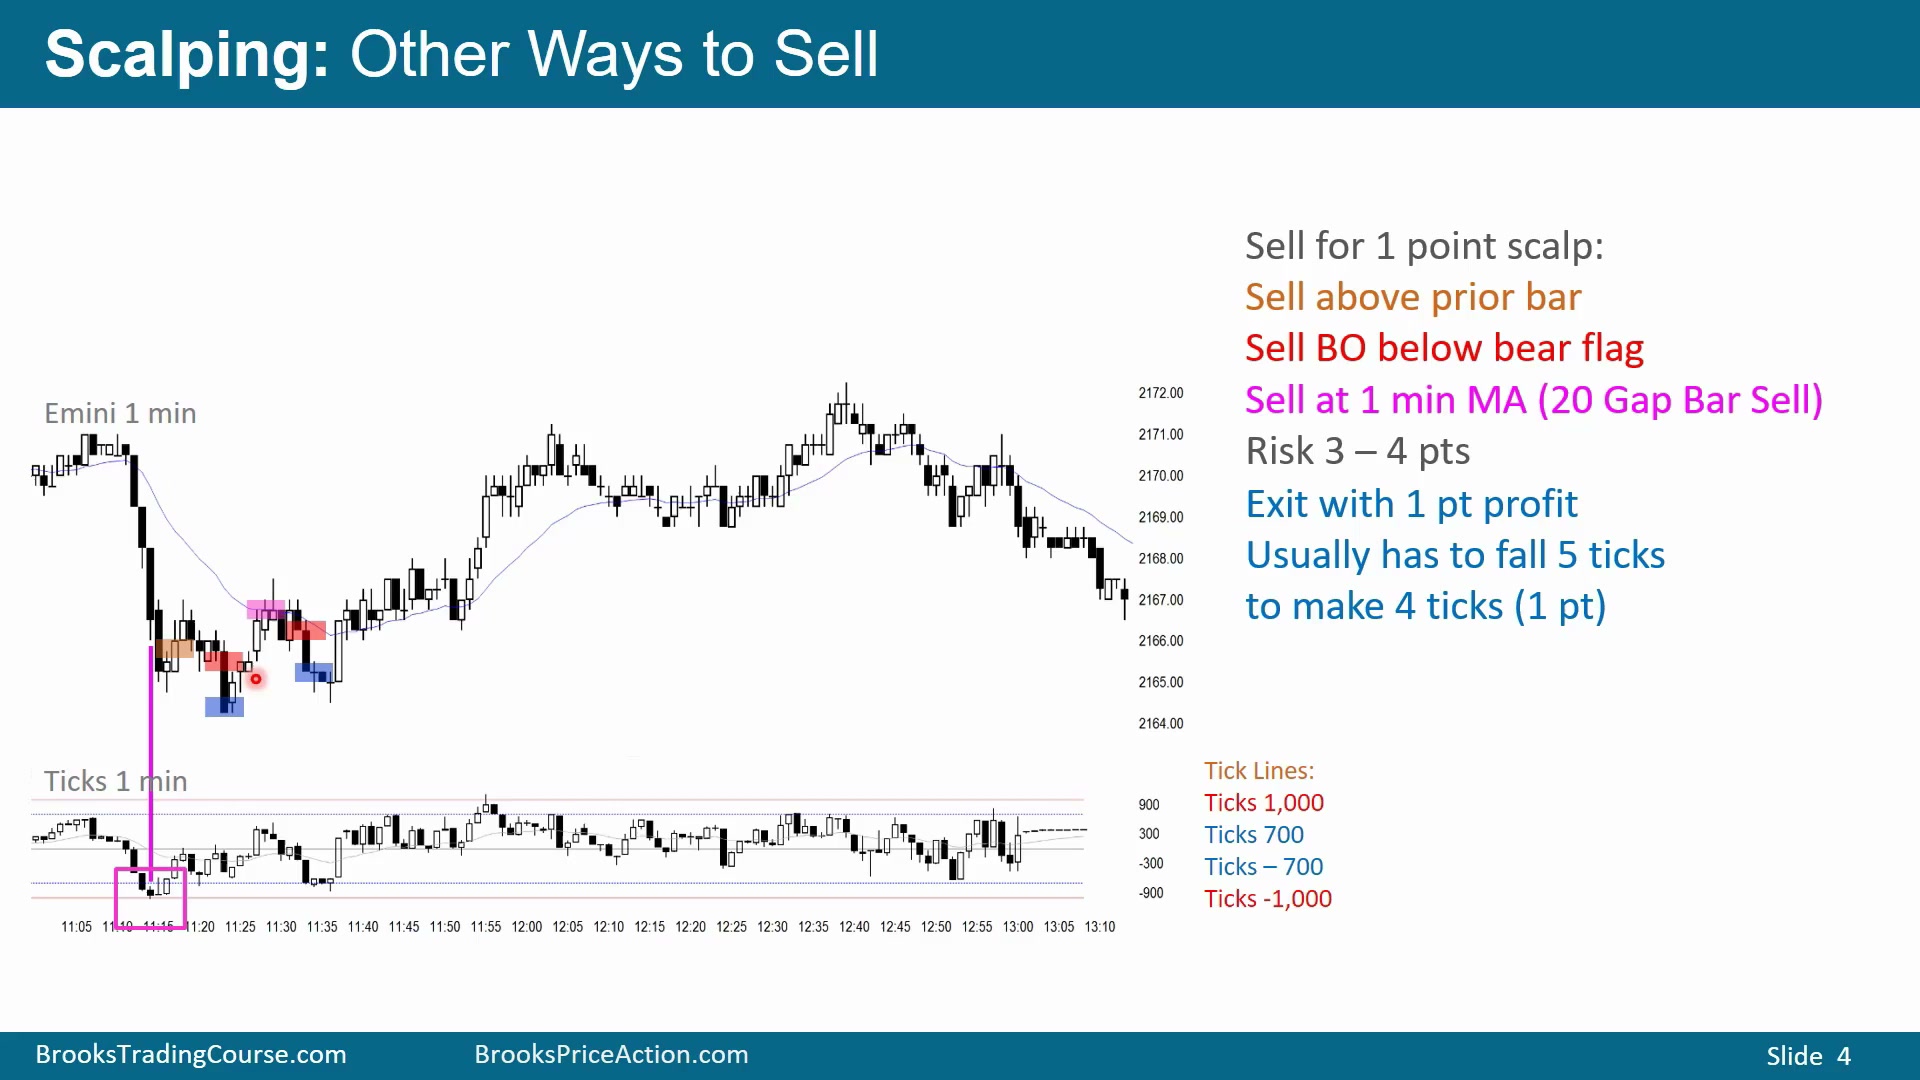
初始空头突破中出现极强 ticks 读数时,空头会用各种理由卖出:卖触及 -1000 的 K 线收盘,卖反转向上,卖小 Double Top bear flag。图中先是 Low 1,再是 Low 2,构成小型双顶空头旗,可以做 1 点 scalp。
即使随后出现强反弹,这仍然是 1 分钟图。第一次回到均线,交易者会寻找做空;连续 6 根多头 K 线后,也可能等第二次向下入场,即卖出收在低位的空头 K 线。多数交易者不应交易 1 分钟图,但经验丰富的 scalper 在看到 ticks 剧烈下跌或剧烈上涨时,确实会这样做。反向地,在强正 ticks 后,他们会预期 ticks 高点通常不是价格最终高点。这里区间看起来大,其实只是 1 分钟图约 6 点区间,拿 1 点 scalp 是合理的。
反转向上时第一次 +700 或 +1000
Time: 08:20
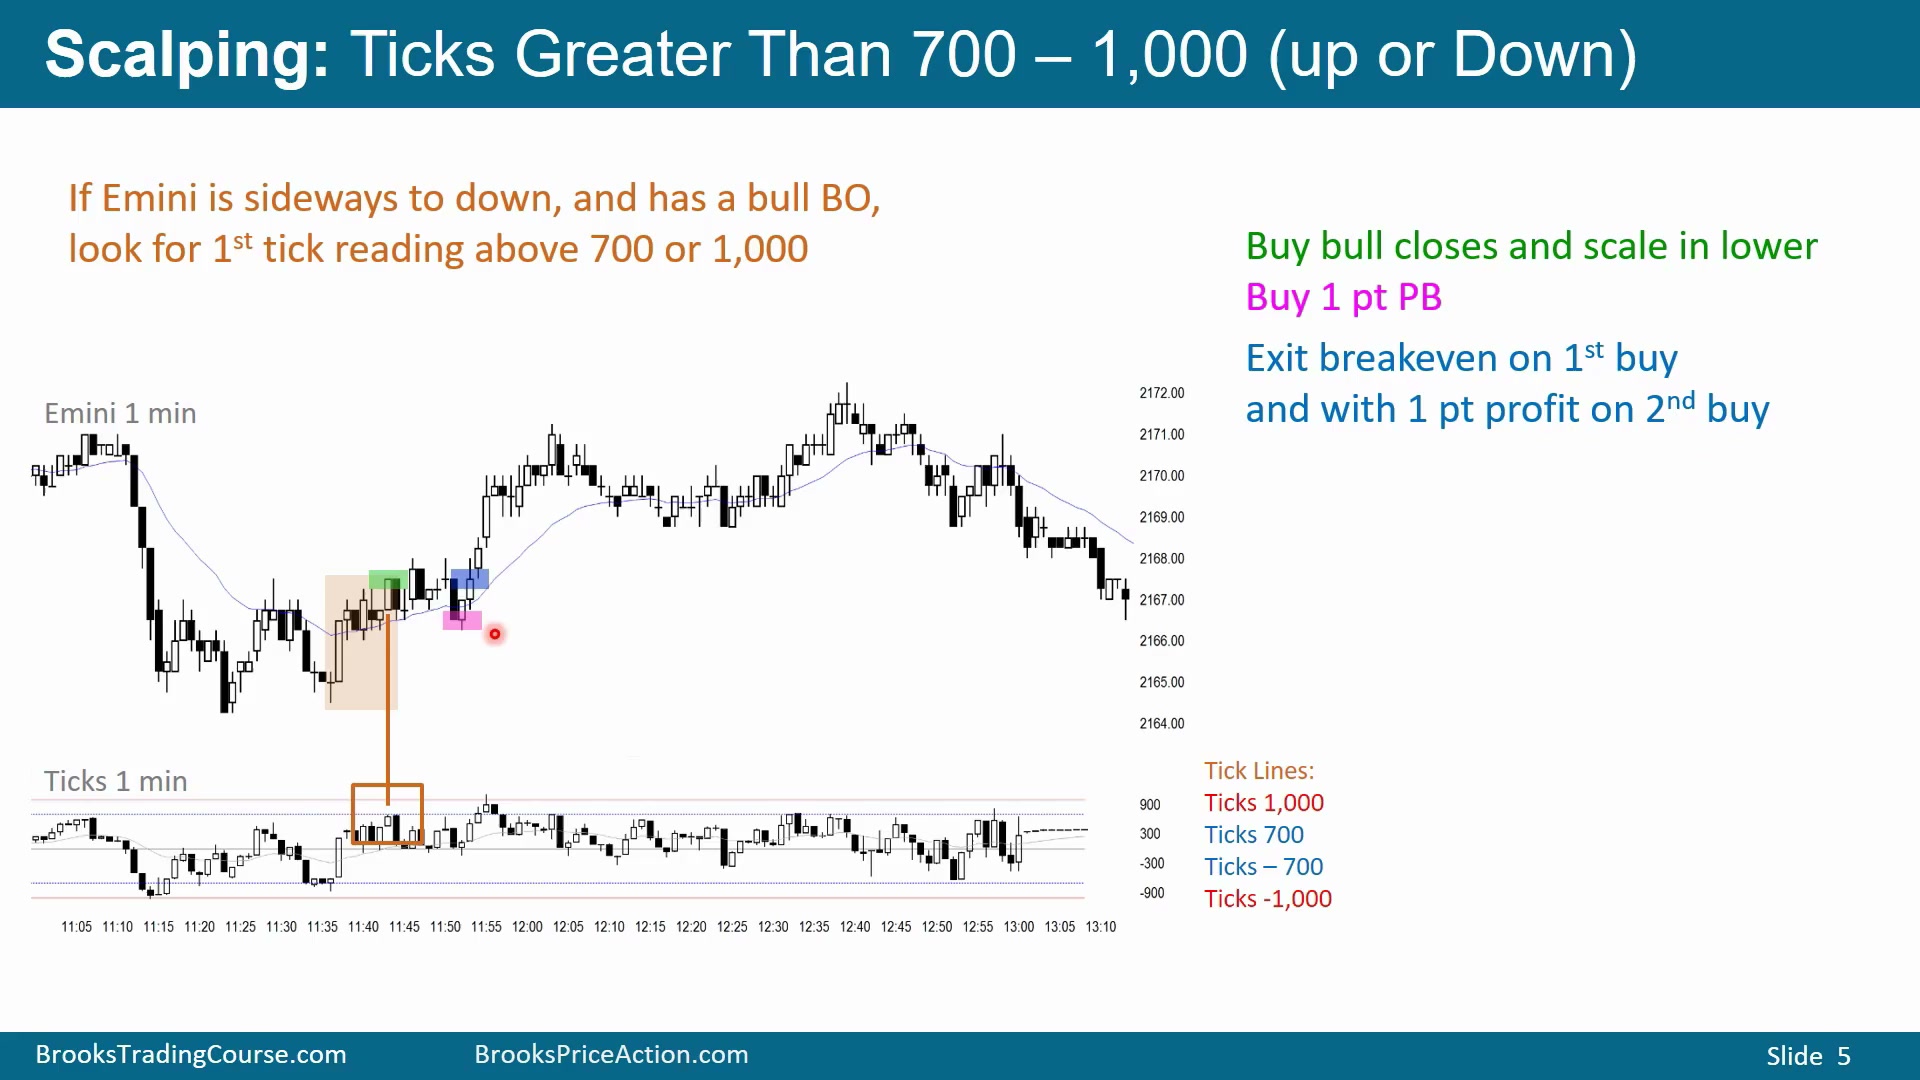
如果市场先横向到向下,然后出现多头突破,交易者会寻找第一次 ticks 高于 +700 或 +1000 的读数。一旦出现,他们预期市场至少会再高一点。图中在熊趋势中触及 +700 蓝线,并形成不错的反转;由于这是 1 分钟图,目标仍是 scalp。
很多交易者会在第一次触及 +700 的反转向上时市价买入,或等待 1 点回调买入,预期市场至少上涨到足够拿 scalp。若买入触及 +700 的 K 线收盘,随后可以在低 1 点处买更多;价格回到第一笔附近时,第一笔保本,第二笔拿 1 点 scalp。
正 ticks 突破后的买入管理
Time: 09:35
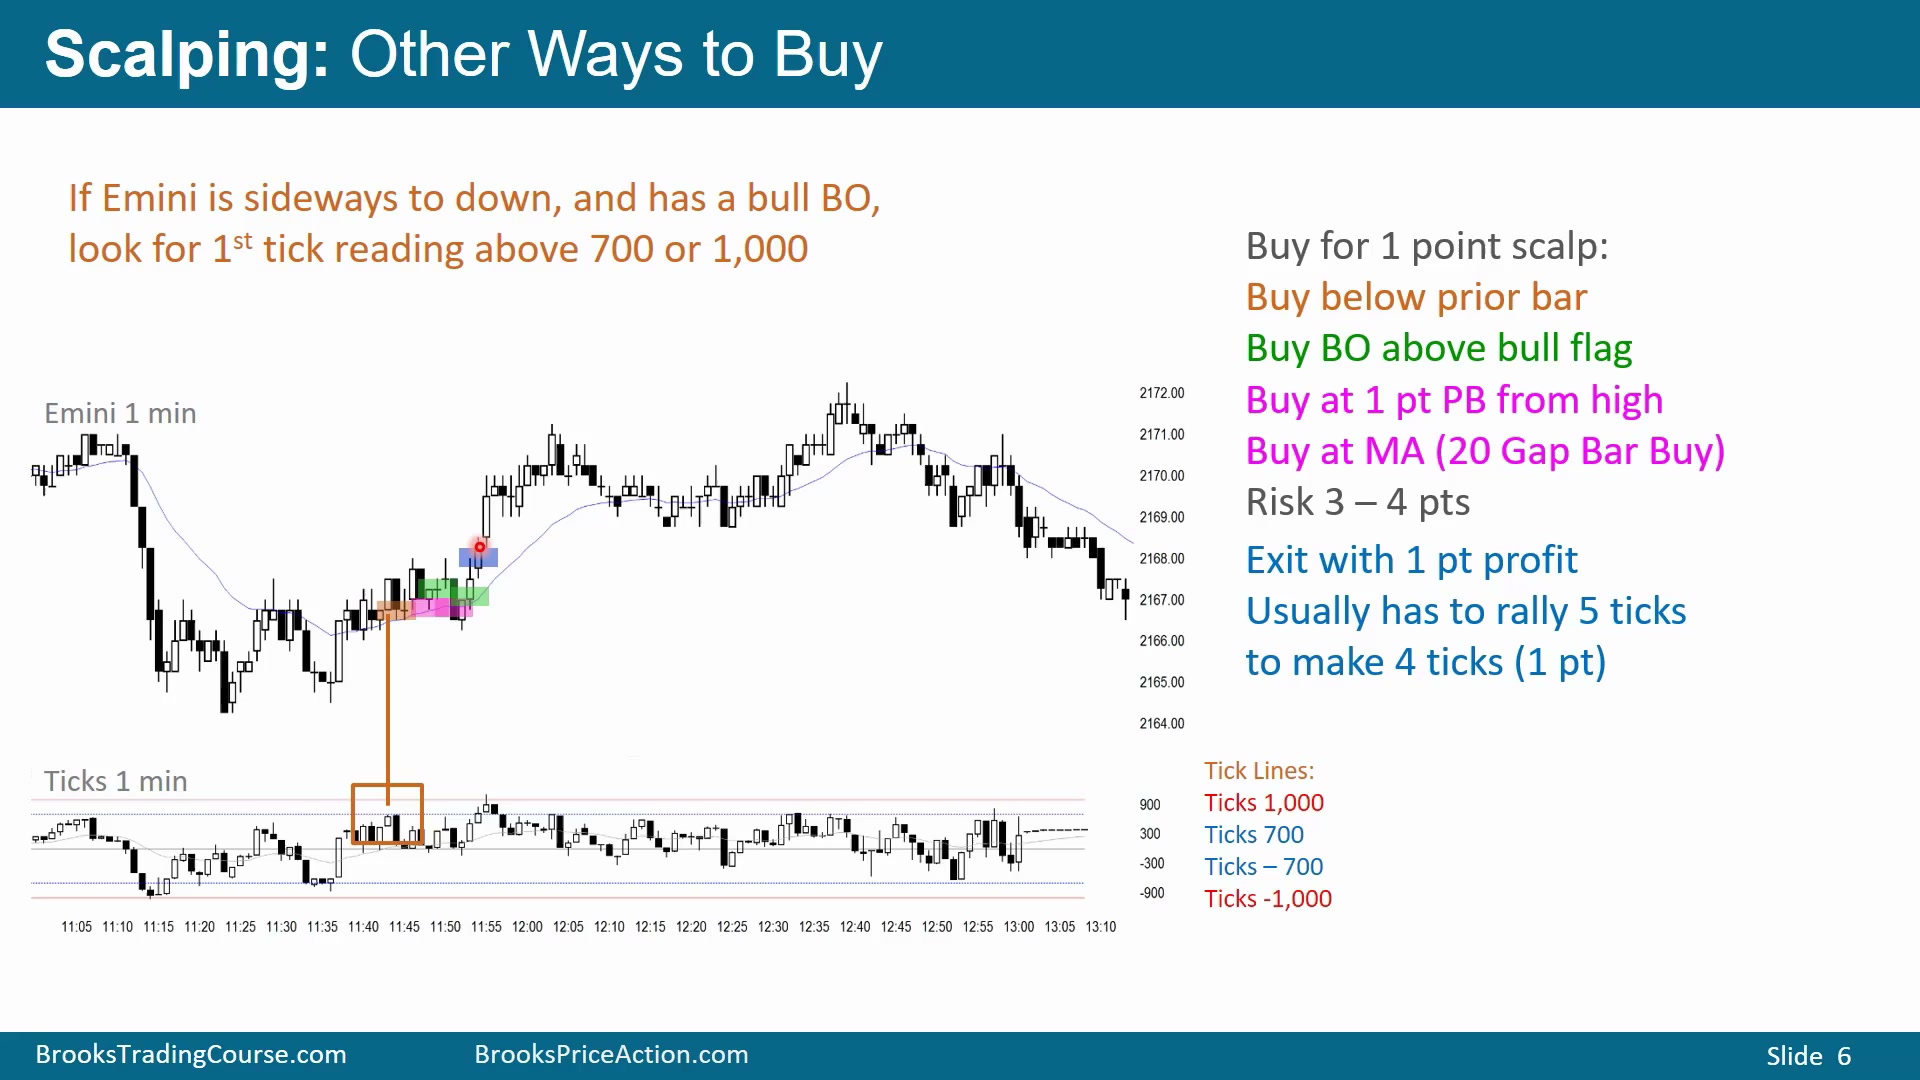
强多头 ticks 后,交易者可以用多种理由买入:买触及 +1000 的 K 线收盘,买该多头 K 线低点下方的坏卖出,买低 1 点,或买 1 分钟均线回调。风险至少要放在下方结构低点,所以可能冒 3 到 4 点风险只为赚 1 点。
只有在管理正确、愿意 scale in、并且能快速判断交易变坏时,这才是盈利策略;这句话里有很多前提。经验 scalper 无论是在 K 线下方买、上方买,都会把目标设为 1 点 scalp。
趋势早期的 +1000 通常不是最终高点
Time: 10:25
图中 ticks 达到并超过 +1000,形成新的 ticks 极端,说明多数股票上涨,非常多头。交易者会市价买、买反转向下、买恢复上涨,押注价格最终会高于 ticks 达到 +1000 时的价格。趋势早期的 ticks 高点通常不是价格最终高点,价格往往还会继续高。
因此,交易者押注第一次反转向下会失败。他们会买多头 K 线下方,买 High 1,买均线回调,或买小牛旗突破,并在高约 1 点处获利。如果在较高位置买入,止损通常放在强多头突破底部下方;若交易有效,价格不应跌回那里。再次强调,这是 1 分钟图,多数交易者不应这样做,但有经验 scalper 会用 ticks 图上的细小线索帮助寻找 Emini scalp。
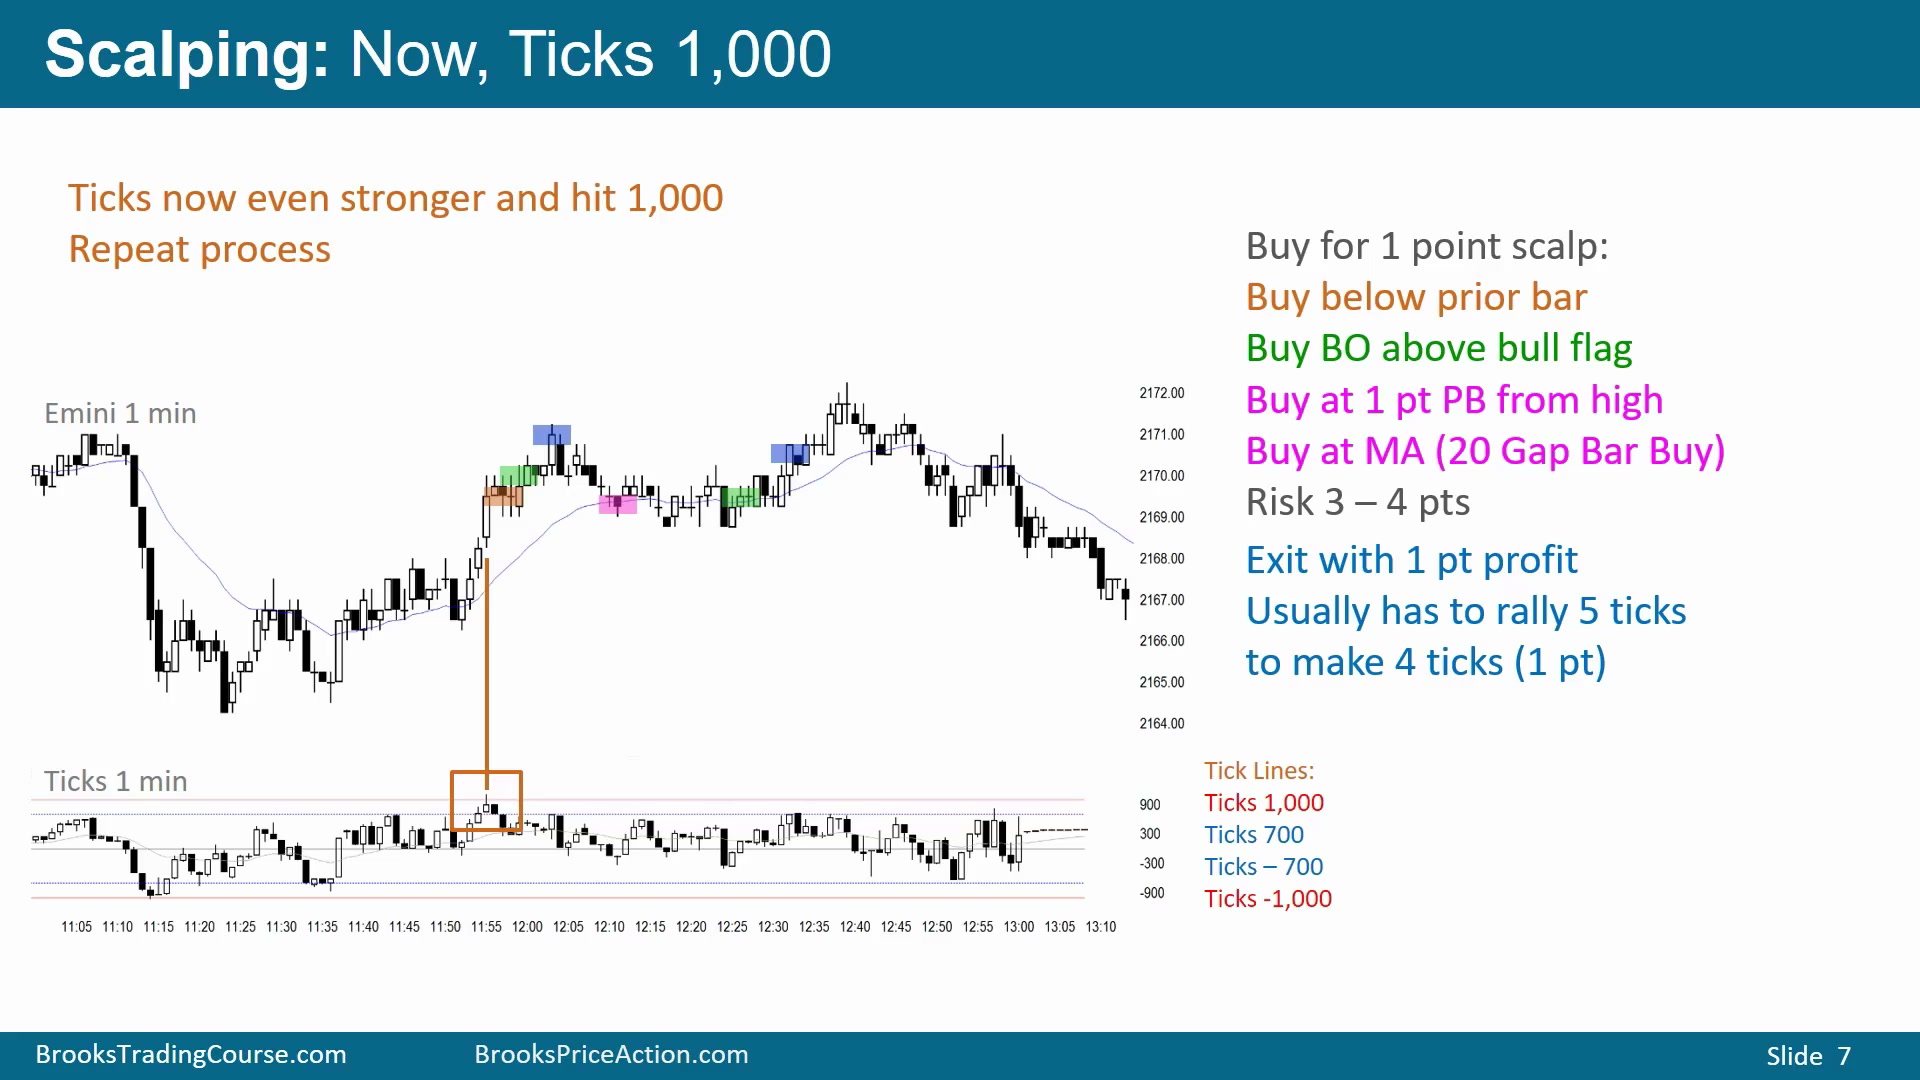
趋势晚期的极端 ticks 可能是耗尽
Time: 12:05
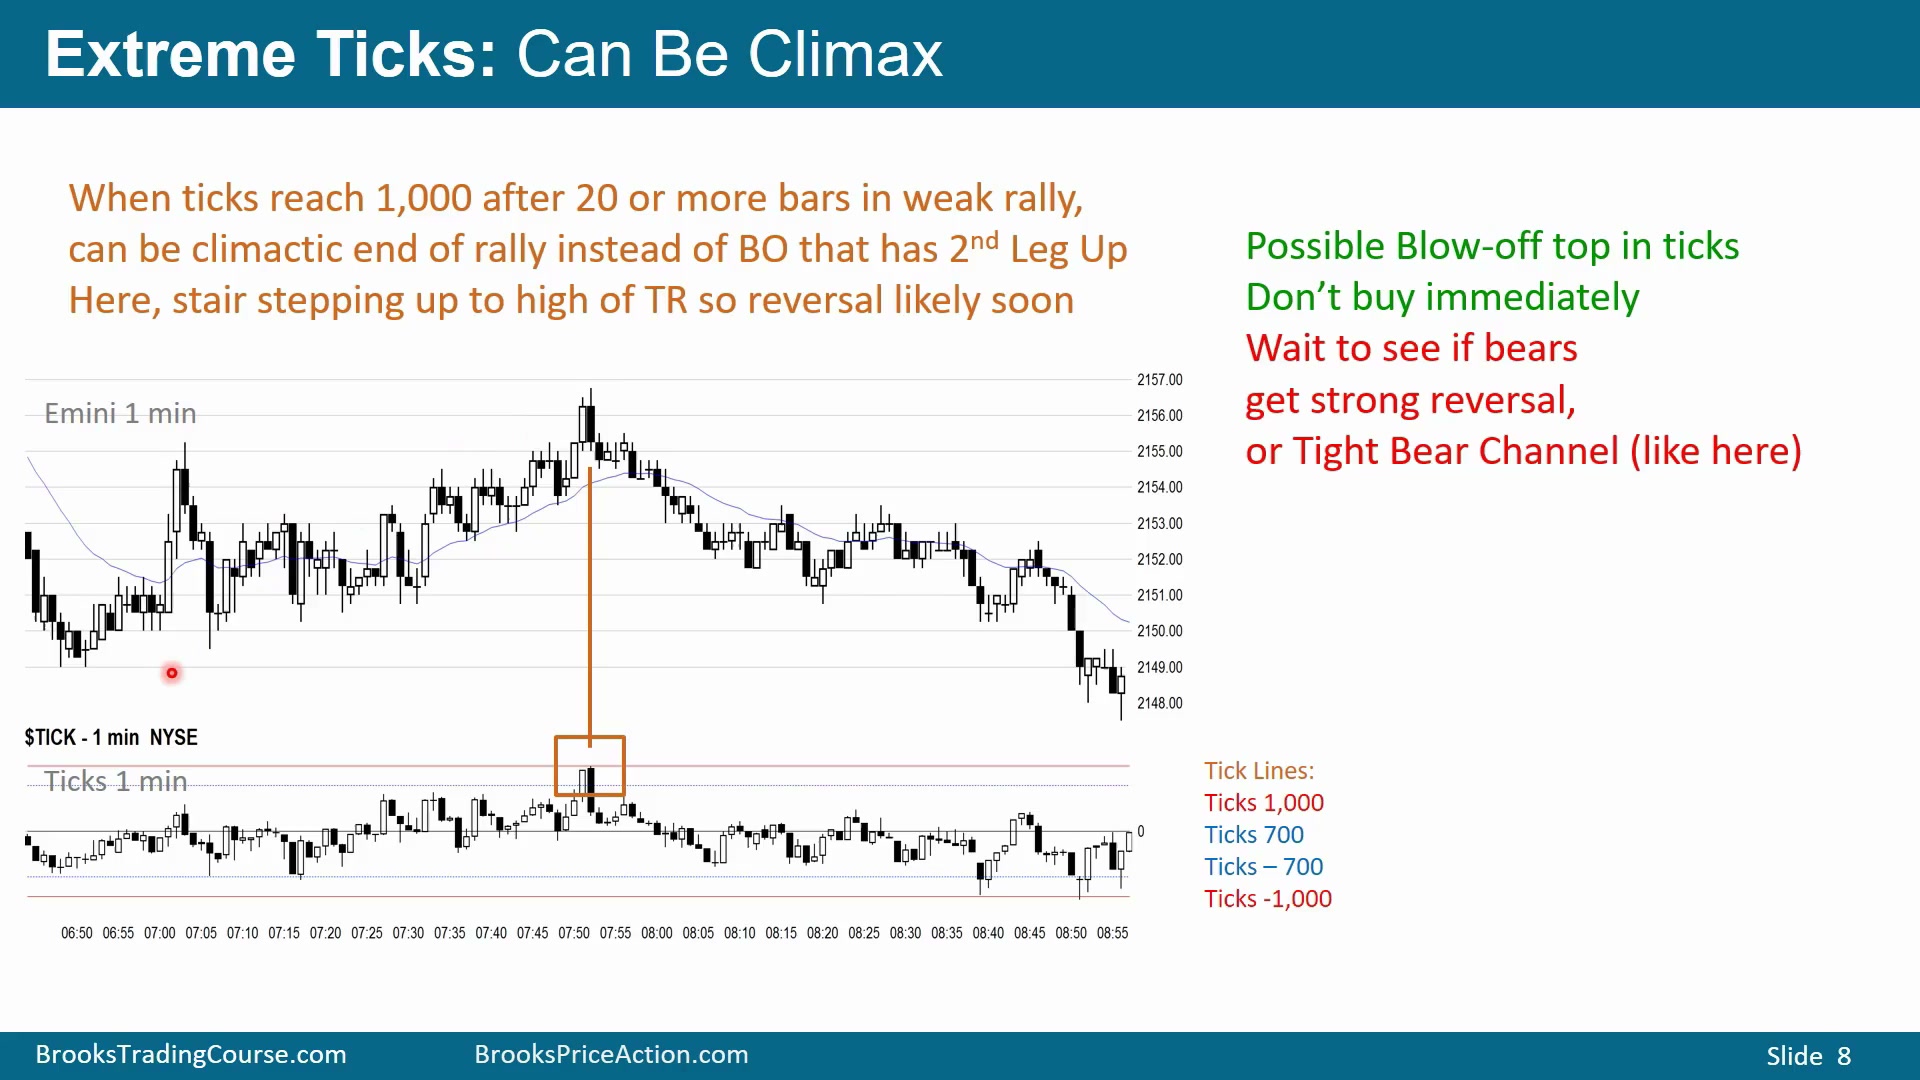
图中再次触及 +1000,但这是上涨 30、40、50 根 K 线后的第一次。上涨呈 stair-step:突破、回调到突破点下方,再创新高,再回调。这样的走势更像 Trading Range 中的一条多头腿;当极端 ticks 出现在趋势晚期时,需要警惕它是趋势的 climactic end,而不是更强上涨的开始。
一般来说,买 ticks 信号最好发生在趋势早期或反转早期;晚期高 ticks 更可能是 blow-off。图中多次创新高后又回调,继续突破这些高点后也很可能再次回调。stairs 越多,市场越可能很快进入 Trading Range,甚至转入熊趋势,所以在此处买新的 ticks 高点是低概率交易。交易者会等待空头是否增强,例如出现 very tight bear channel;若出现,就停止寻找买入。
这里的关键不是 +1000 本身,而是它出现的位置。趋势早期第一次 +1000 常常说明机构广泛买入,价格之后还有跟进;但在已经 stair-step 上涨很久后,新的 +1000 可能只是最后的买入高潮。图中每次突破前高后都回落到 breakout point 下方,显示多头虽然还能创新高,却无法保持强趋势推进。此时继续追买 ticks 高点,概率明显低于在趋势早期买。
趋势晚期的负 ticks 也可能是卖压耗尽
Time: 14:10
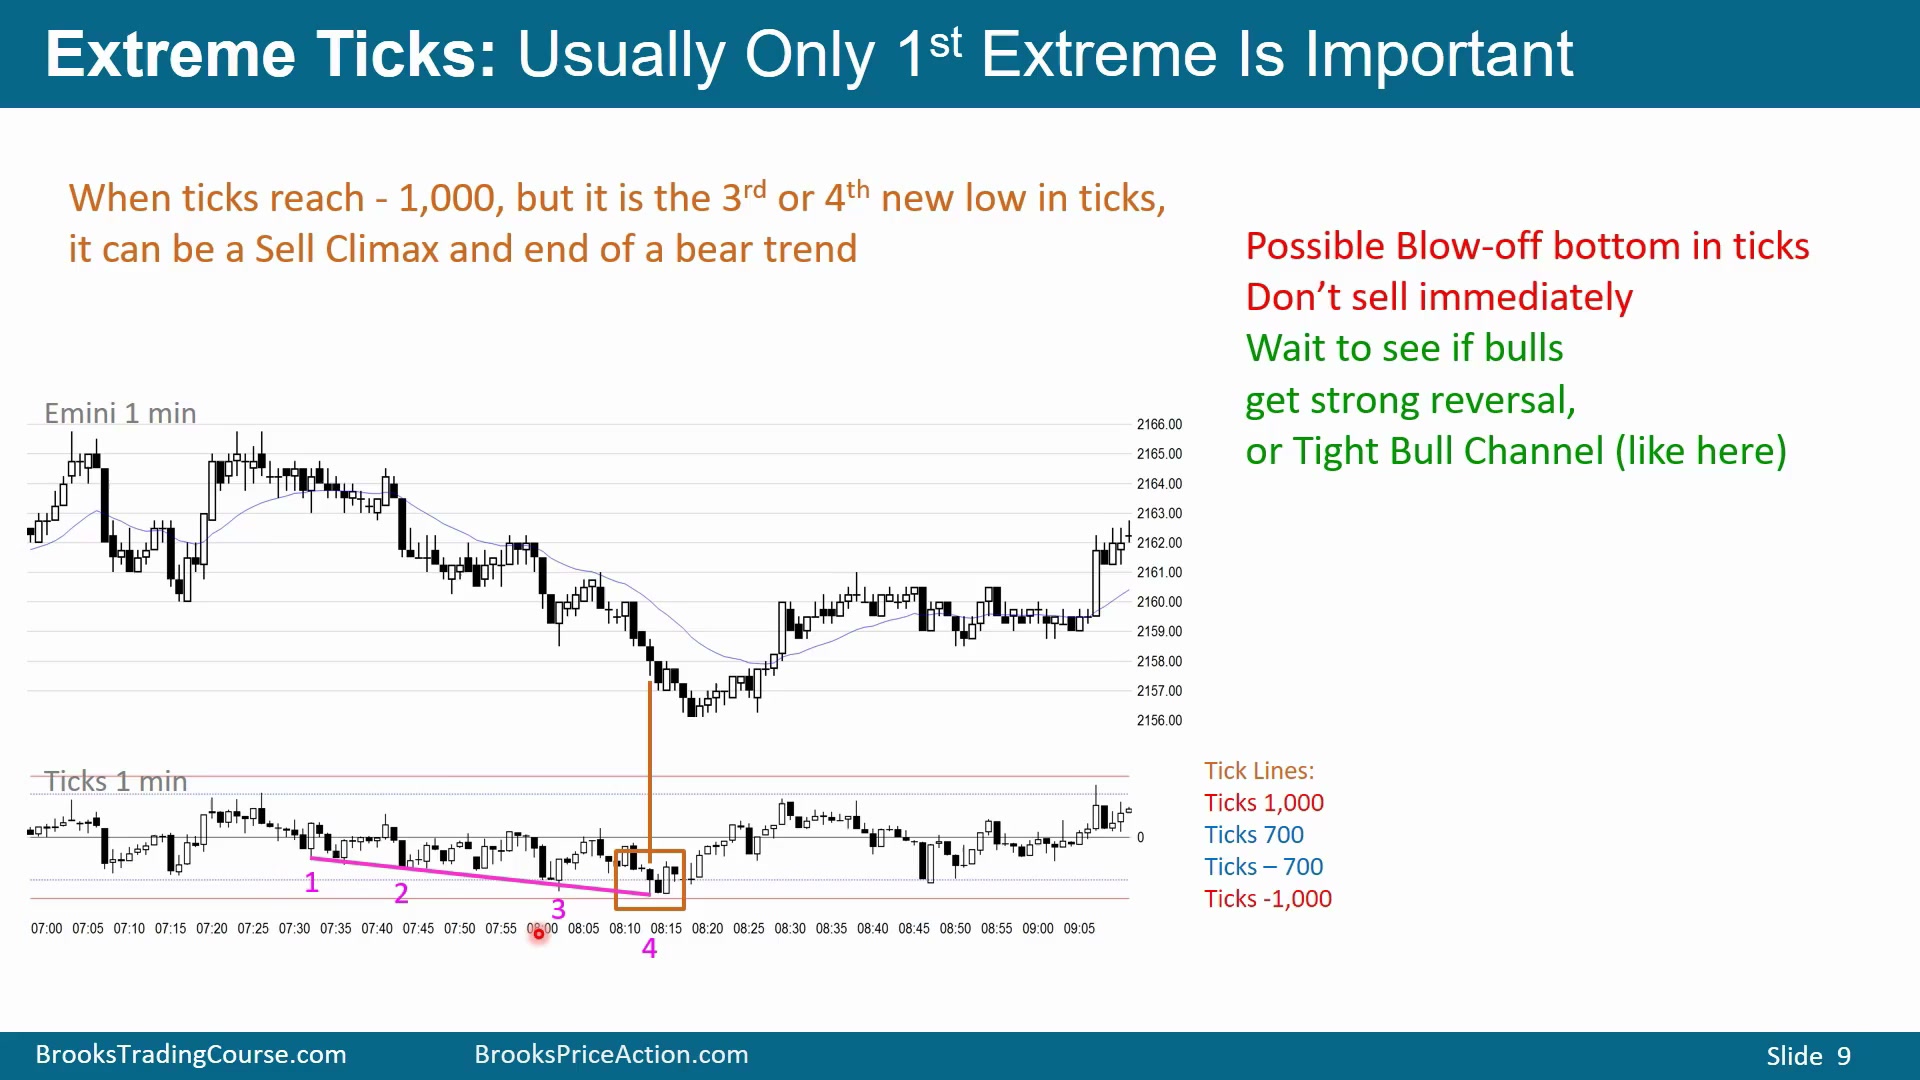
图中 ticks 接近 -1000,而且已经是第四次创 ticks 新低。ticks 反复创新低,价格也阶梯式下跌,这可能是趋势的 climactic end。通常极端 ticks 低点并不是价格最终低点;价格往往还会再低一点,但 ticks 读数形成更高低点,从而产生 tick divergence,并带来至少一段反弹。
关键区别在时间位置。早期趋势中的 -1000 ticks 可能只是空头力量刚开始释放;但如果价格已经一段一段向下走,ticks 也连续多次创新低,新的极端读数就更像 climactic selling。交易者仍不应因为低 ticks 直接买入,而是等价格再创新低、ticks 不再创新低,确认 divergence 后再考虑反弹。 因此,趋势晚期、尤其是价格或 ticks 已经 stair-step 下跌后,接近 -1000 的低 ticks 更可能是趋势耗尽,而不是进入更强熊趋势的加速。
tick divergence 的基本作用
Time: 15:25
tick divergence 指价格继续形成 Buy Climax 或 Sell Climax,但 ticks 极端逐渐减弱。上涨中,价格新高而 ticks 高点降低,说明买盘广度减弱,常常带来反向 scalp;下跌中,价格新低而 ticks 不再那么负,可能形成买入 setup。
价格新高但 ticks 降低
Time: 15:51
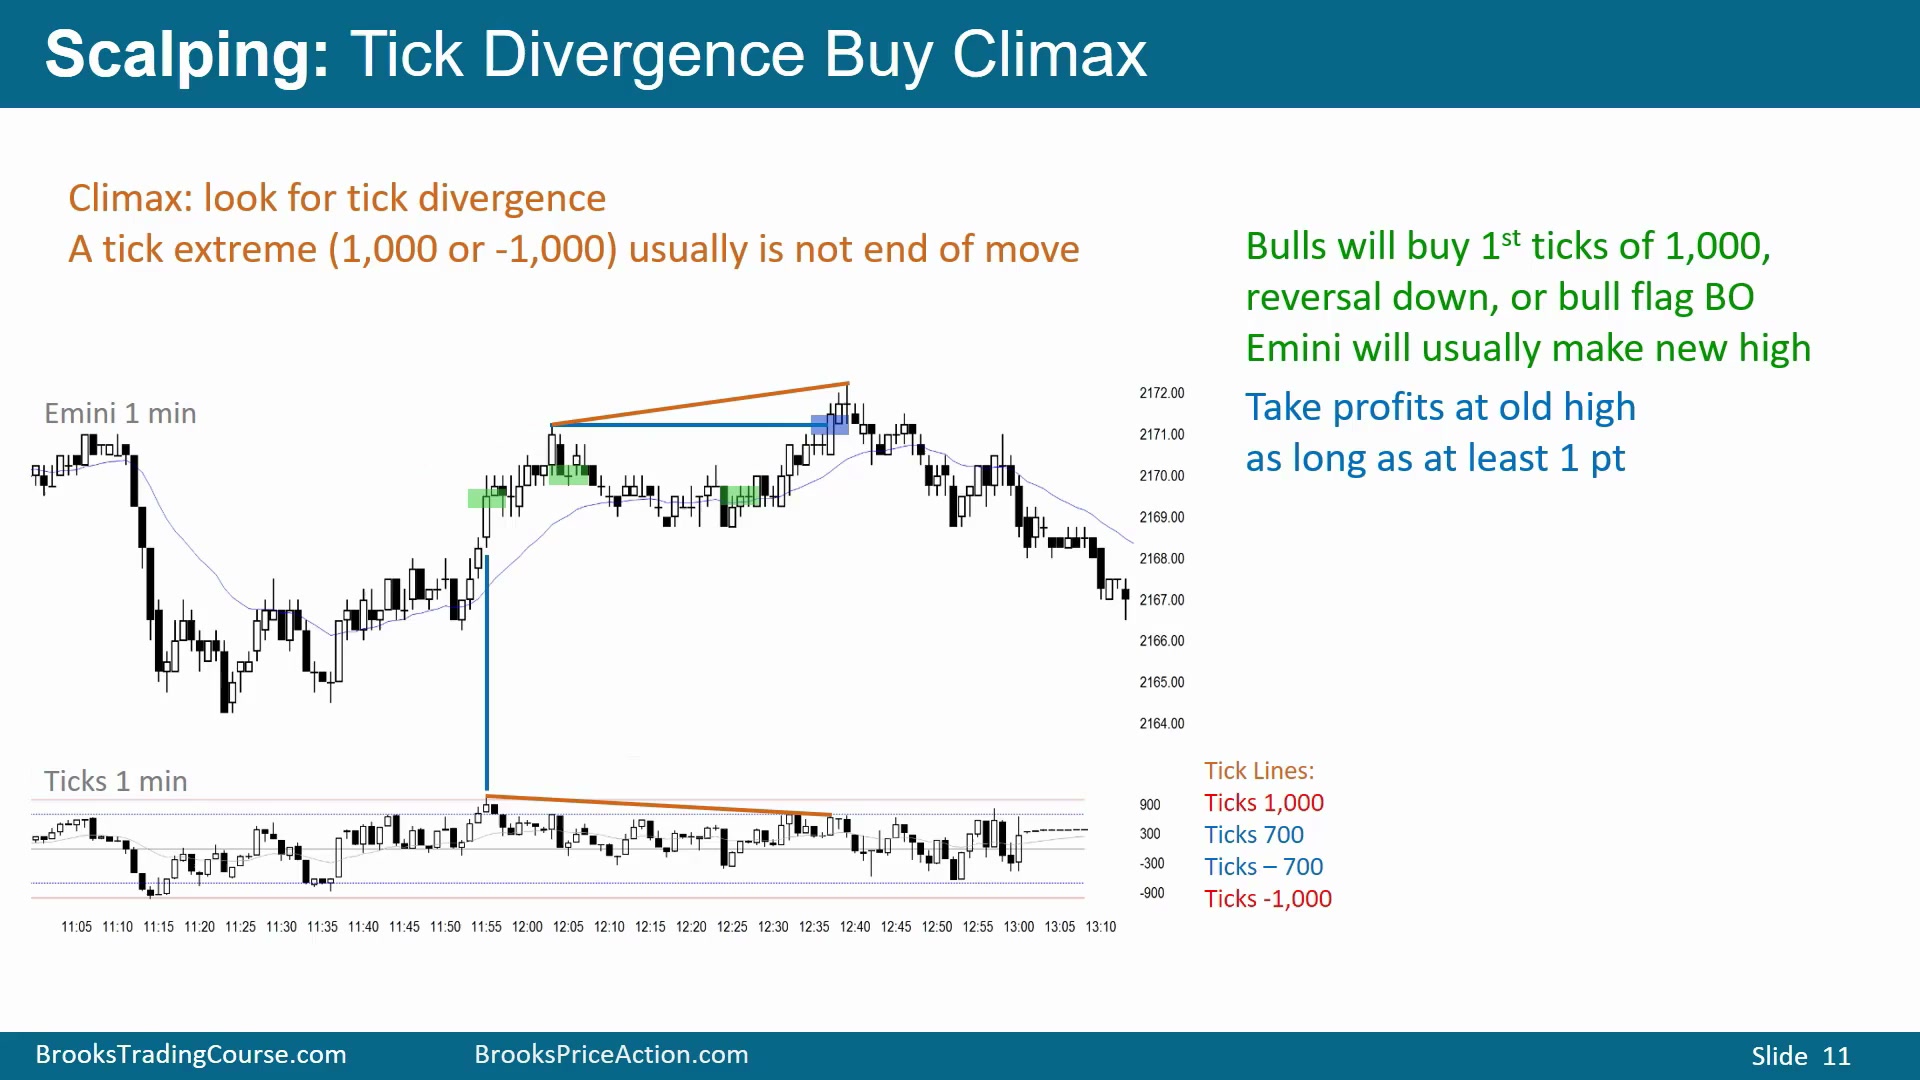
图中 Emini 1 分钟图继续上涨并创新高,但 ticks 早前已触及 +1000,后续价格更高时 ticks 反而形成 Lower High。也就是说,价格更高,但上一笔成交上涨的股票数量少于此前,买盘广度减弱。再次强突破到价格新高时,ticks 仍少于前一次高点,这就是 tick divergence,会提高牛趋势很快转为 Trading Range 或熊趋势的概率。
第一次触及 +1000 通常不是走势终点,价格后来仍可能再涨一点或 30 根后再涨。买第一次 ticks 高点或买第一次反转向下的多头,押注初次反转失败,是另一类交易。若这些多头买入后价格回落,他们可以在至少一个 scalp 更低的位置买更多;第二笔必须低于第一笔至少 1 点,这样价格回到第一笔入场时,第一笔保本,第二笔拿 1 点。
tick divergence 与 prior high fade
Time: 17:40
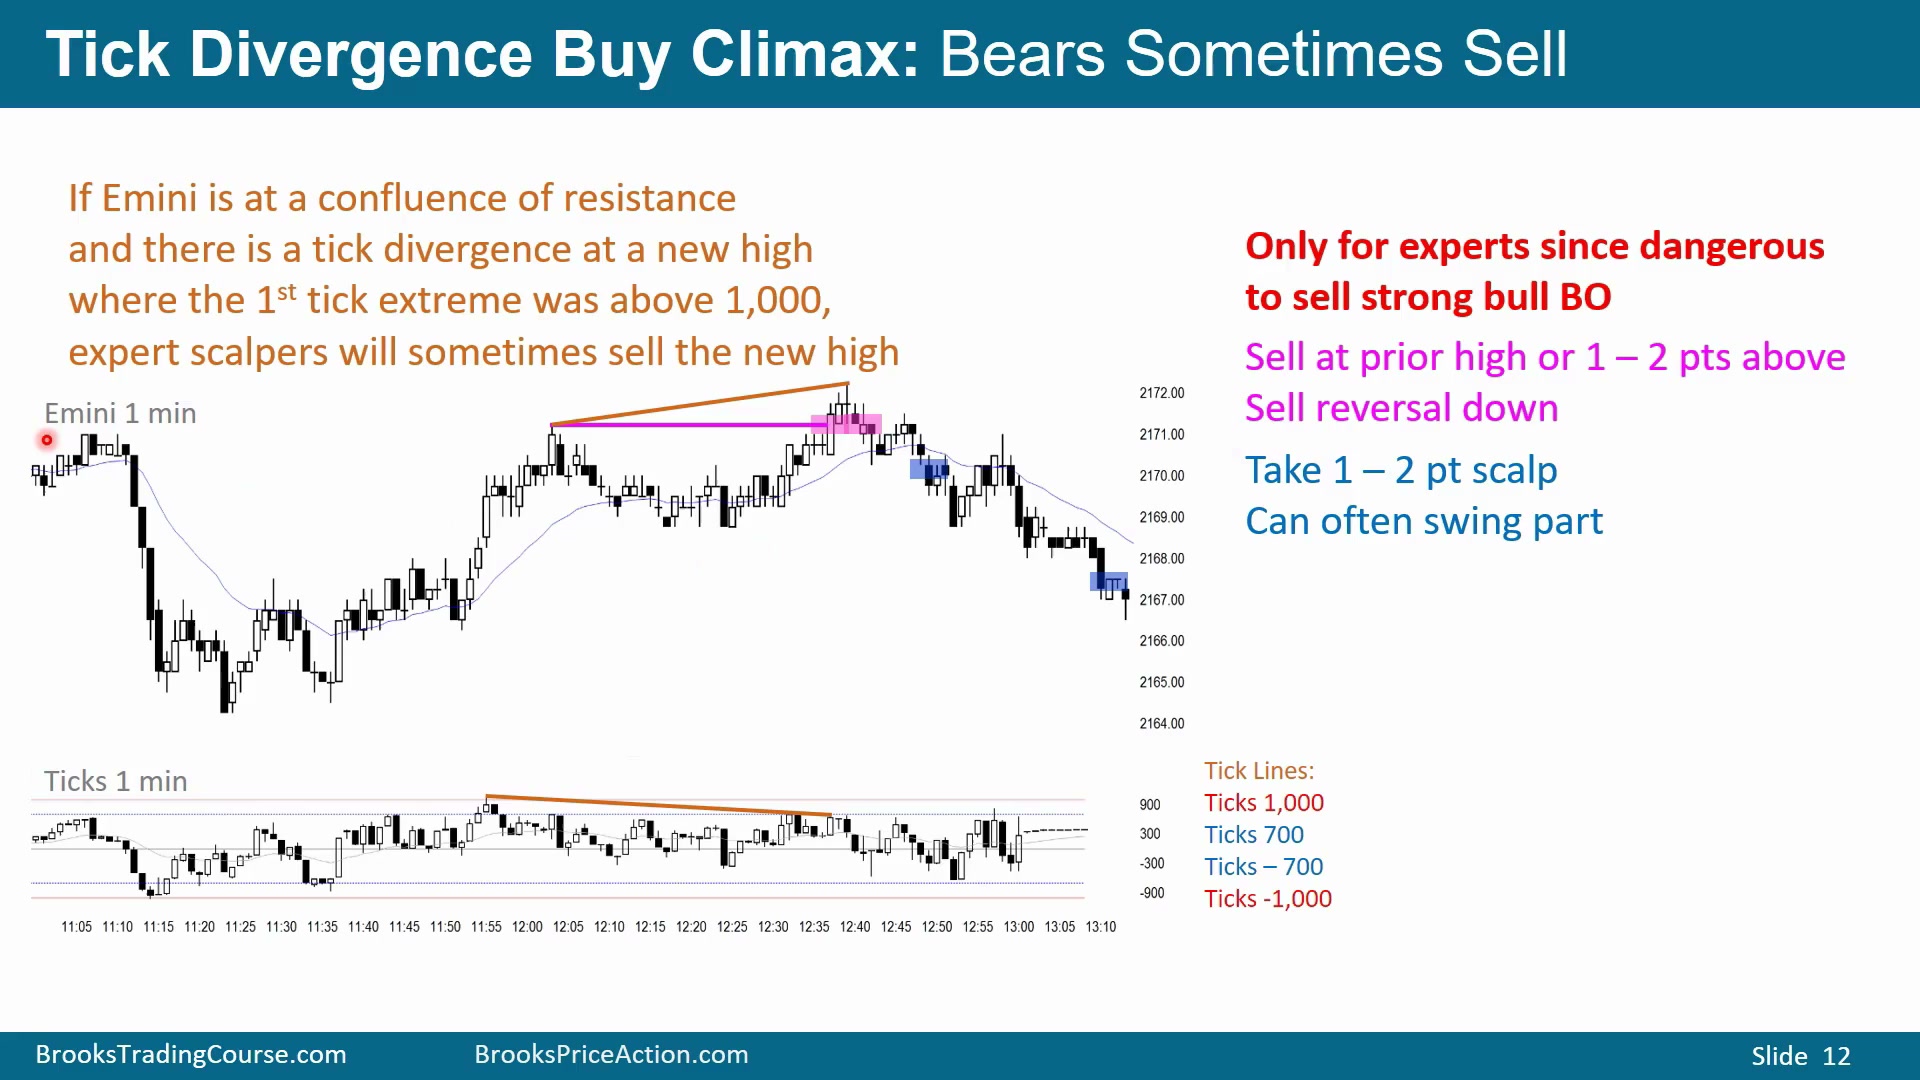
图中 Emini 曾在某价位下跌,后来再次拉回到相近价位时,ticks 高点比前一次更低,形成 divergence;从另一个高点到后一个高点也同样如此。ticks 越来越低,提高了上涨接近尾声、即将转为 Trading Range 或熊趋势的概率。
有些 expert scalper 专门在 1 分钟 Emini 和 ticks 之间寻找这种 divergence,一天只做一两笔,可能用较大仓位拿 1 点 scalp。但这只适合专家。图中 1 分钟牛趋势在局部仍很强,逆势卖 tick divergence 很容易出错。多数交易者不应交易 1 分钟图。
当 ticks 开始下行,价格也出现二十根左右的空头反转和 Trading Range price action,交易者会在 prior high 附近卖,尤其当 ticks 只形成 Lower High。他们可以在 prior high 限价卖,也可以等反转向下;图中 ioi 后出现收在低位的空头 K 线,有些交易者会在其低点下方 sell stop,并尝试拿 1 到 2 点。
图中 friend 的做法是只挑一两处 divergence,而不是每次价格新高都卖。他看的是价格回到 prior high 附近,同时 ticks 形成 Lower High,并且价格行为已经出现区间化迹象。若随后有 ioi 和收在低位的空头 K 线,卖出信号才更完整。即使如此,这仍是强 1 分钟牛趋势中的逆势 scalp,只有专家才应考虑。
强 Sell Climax 后的买入 divergence
Time: 20:20
下跌中第一次新空头突破并使 ticks 接近 -1000,通常不是价格最终低点。交易者会用各种理由做空:卖空头收盘、在 K 线上方卖、卖反转向下,目标至少是 scalp,并预期 Emini 至少再创新低。
如果随后价格创出新低,但 ticks 没有再创新低,而是形成 Higher Low,反转到 Trading Range 的概率就会上升。空头会尝试在前低附近或 1 点目标处退出,避免在 divergence 后持有过久。
支撑汇合处的 tick divergence
Time: 21:15
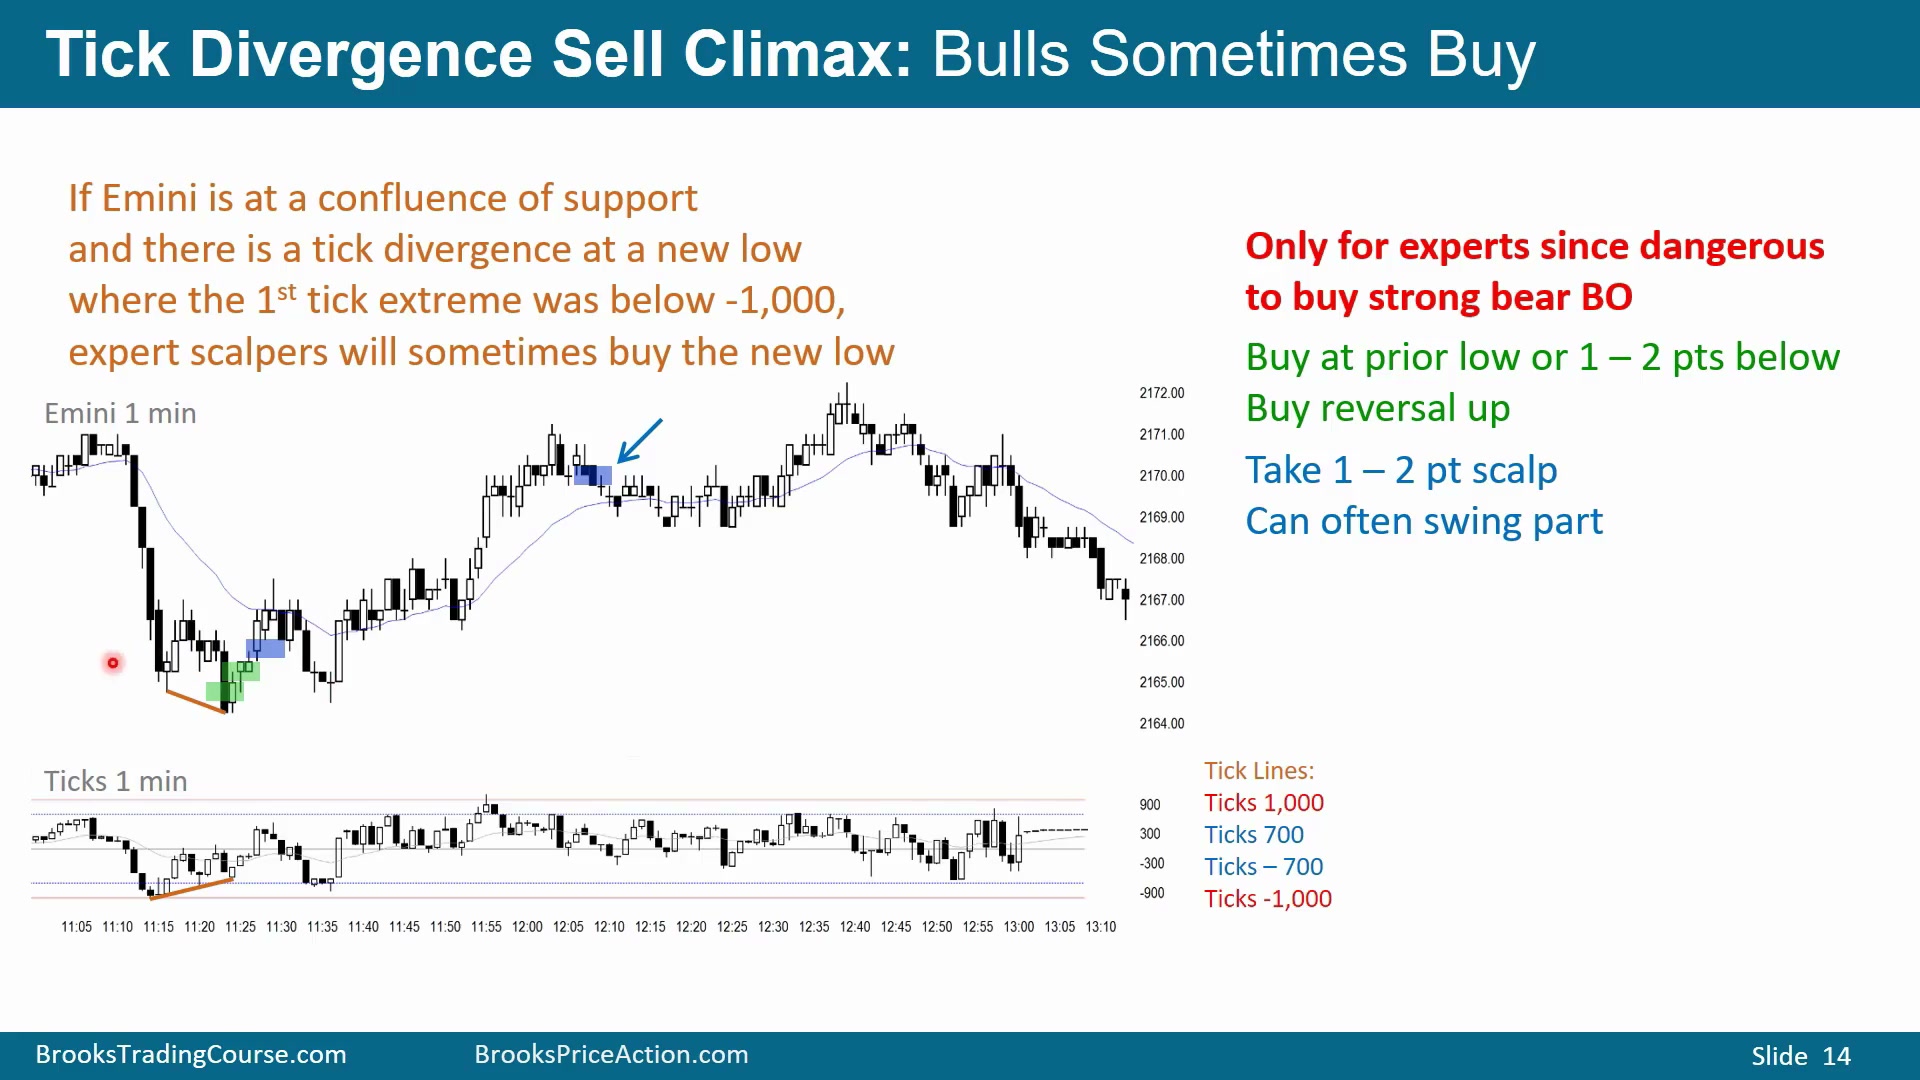
如果 Emini 正处在多重支撑汇合处,例如 5 分钟均线、5 分钟 Wedge Bottom、上涨的 50% 回调等位置,同时出现 tick divergence,这可能是回调结束并恢复高时间级别上涨的信号。多头会开始在 prior lows 买入,预期 divergence 至少带来反弹,甚至恢复 5 分钟牛趋势。
但这仍是在很强 1 分钟熊趋势里买入。仅凭 tick divergence 逆强熊趋势交易,是很难长期谋生的方式,只适合专家。1 分钟图要求交易者快速做出许多决定,多数新手无法在有限时间内准确完成。 这个例子必须把 1 分钟图和更高时间级别放在一起看。若左侧不可见位置其实是 5 分钟均线、楔形底和上涨 50% 回调的重合区,tick divergence 只是增加多头入场理由;若没有这些支撑,单靠 divergence 去接很强熊突破,概率和执行难度都会差得多。
交易管理也要预先决定。scalper 可以只期待 1 点利润,快速退出;swing trader 则必须相信高时间级别牛趋势会恢复,并愿意承受回调中的波动。新手最容易犯的错,是看到 divergence 就以为必须买入,却没有判断支撑背景、目标、止损和退出方式。 专家若买入反转向上,可以只拿 1 点 scalp,也可以在高时间级别支撑足够强时持有 swing。
熊趋势中卖 tick rally
Time: 23:00
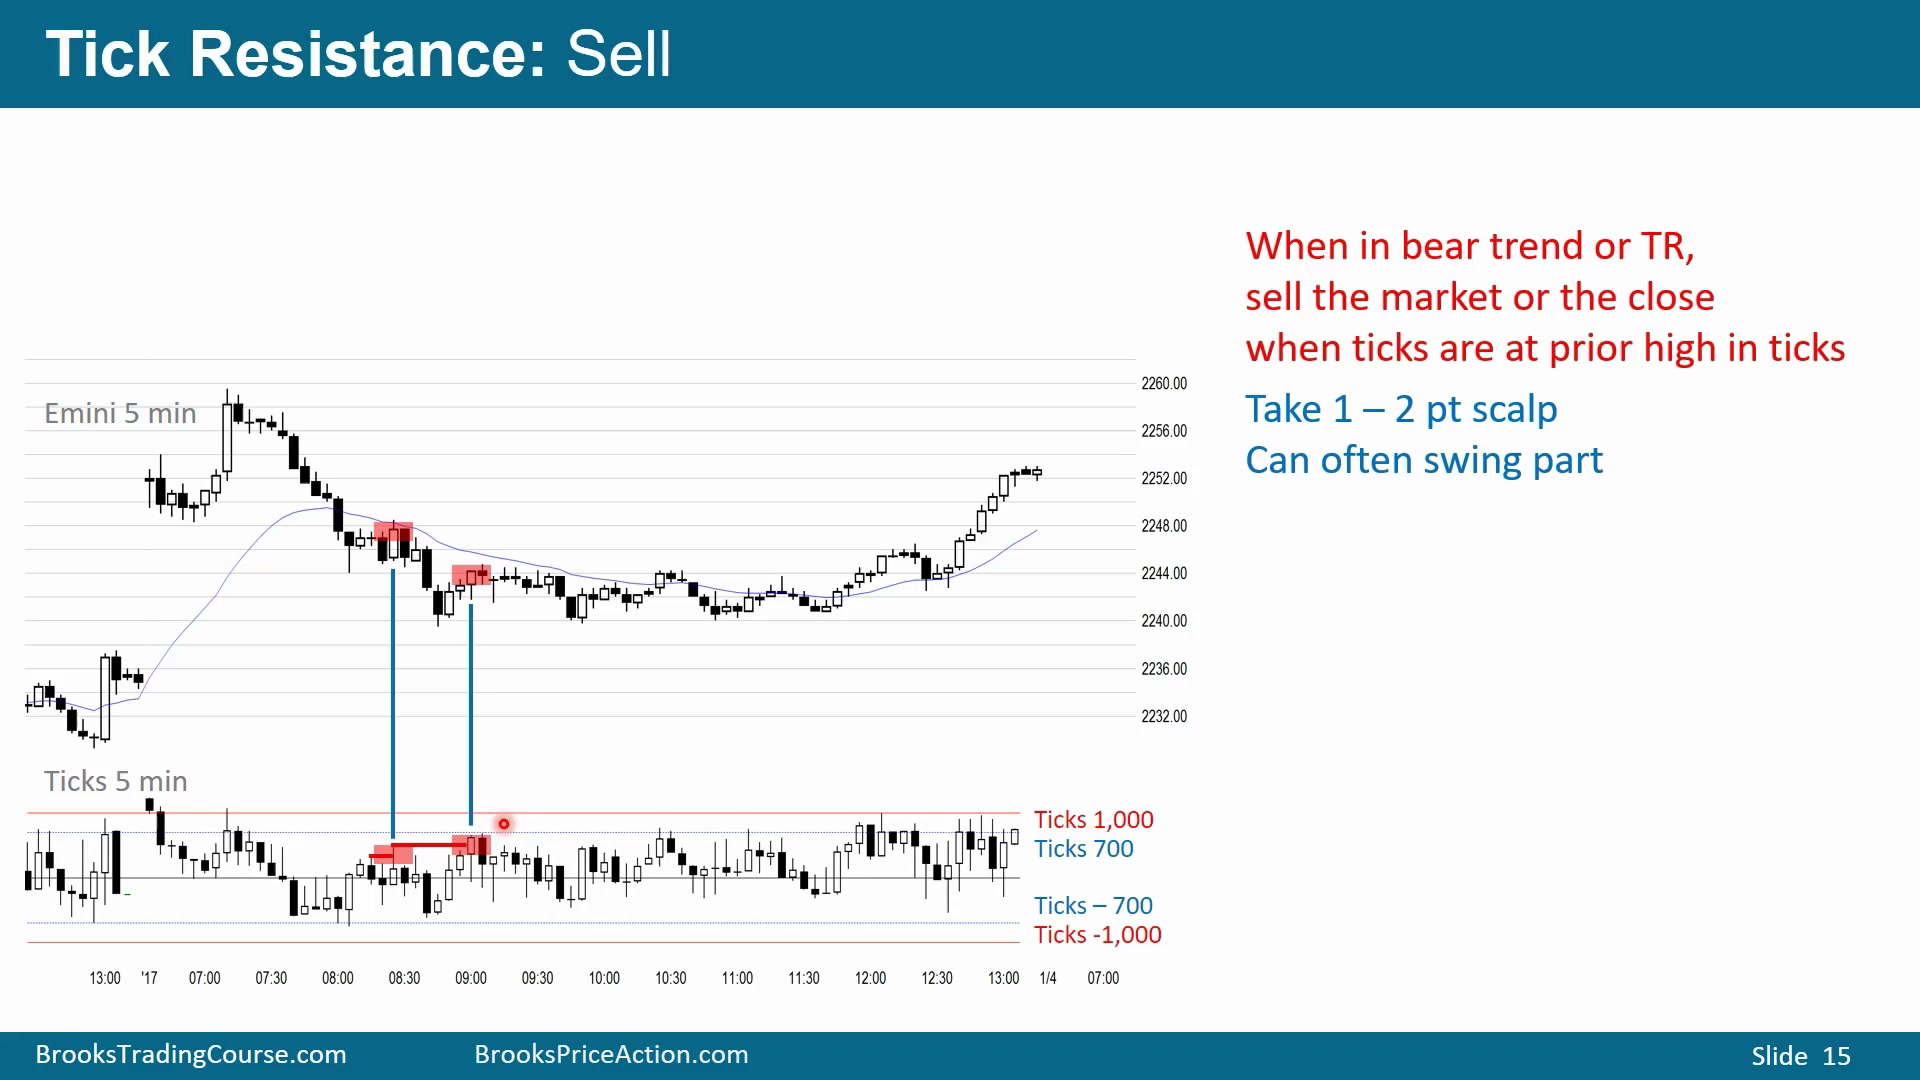
在熊趋势中,有些 scalper 会观察 ticks 的反弹,预期它对应 1 分钟图上的 bear flag,然后寻找卖出。若 ticks 长期多在 0 下方,一个强多头 ticks 收盘高于 0 不一定会引发真正反转;交易者可能在 ticks prior high 附近用限价单卖。
图中 ticks 高于前一个 ticks 高点时,Emini 交易者可能立即市价卖出,预期价格至少再低一点。即使 ticks 创新高,只要背景仍是熊趋势,有些交易者会把它当作 bear flag 内部的反弹,卖出并寻找至少 1 点 scalp。
如果 ticks 大多为负,突然冲到前一个 ticks 高点上方,并不一定代表市场已经转多。熊趋势中的 ticks rally 常常只是 bear flag 内部的买盘释放;当 ticks 一越过 prior tick high,Emini scalper 可以市价卖出,押注价格至少回落到足以拿 1 点。
ticks 偏多支持价格区间向上突破
Time: 24:20
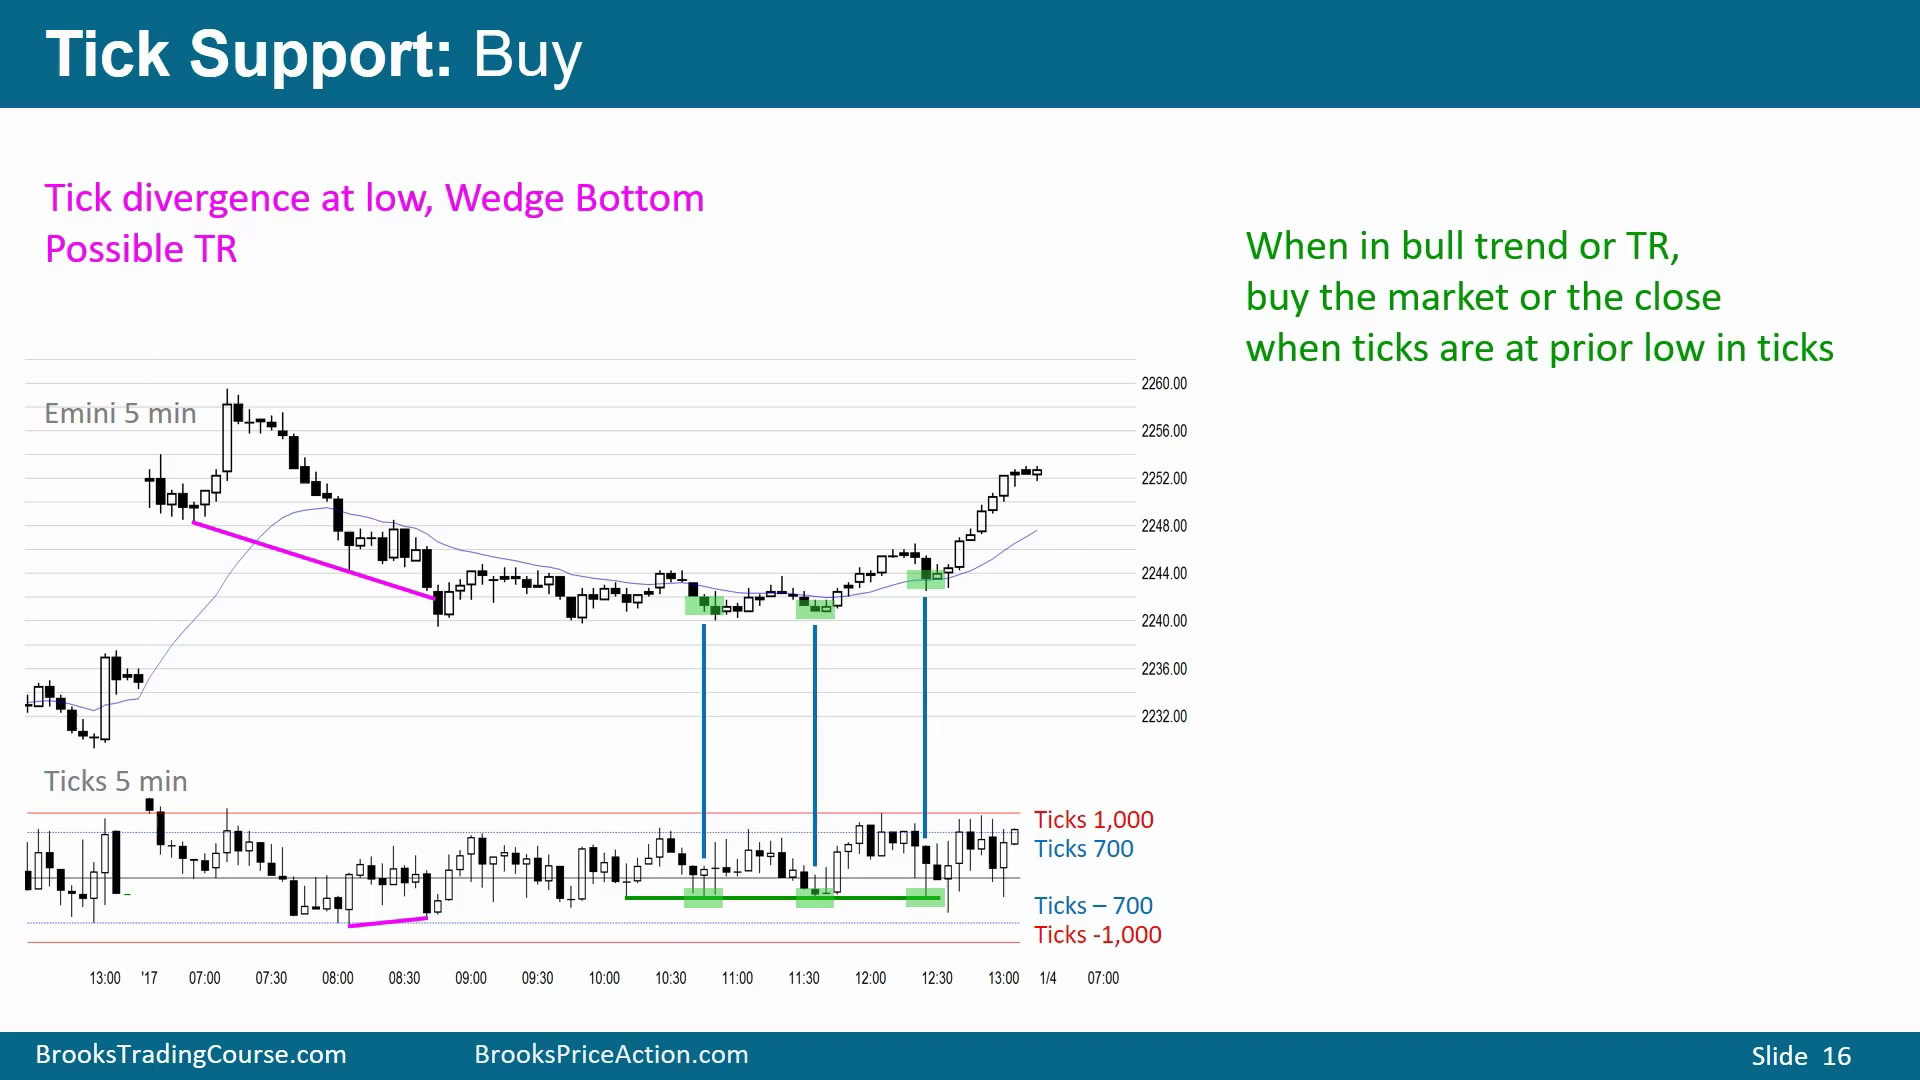
图中价格形成 Wedge Bottom,价格新低但 ticks 是 Higher Low,构成 tick divergence,常常带来向 Trading Range 的转换。随后市场在熊趋势中横向约 20 到 30 根 K 线;经过这么多 K 线后,趋势反转向上与趋势恢复向下的概率接近。
关键是 ticks 大多在 0 上方,价格却仍在均线下方、处于熊趋势中。这提高了向上突破概率。图中还有多次 ticks 接近 +700,却没有接近 -700 的读数,说明 ticks 逐渐转多而价格中性,进一步增加 bull breakout 概率。
在 Trading Range 中,多头会在 ticks 接近 prior low 或略低于 prior low 时寻找买入。每次 ticks 到达某一低位,卖压停止并出现反弹,通常也对应价格反弹。多头可以冒 2 到 3 点风险拿 1 点 scalp;它也可能成为 swing 起点,但本课重点是 scalp。
图中还有一个重要细节:当价格处在区间内时,prior lows in ticks 会变成可交易的短线支撑。每次 ticks 回到同一区域,卖压停止并反弹;多头据此在 Emini 上买小尾巴或买 K 线下方,冒 2 到 3 点风险,目标只是 1 点。若后来价格真正向上突破,这些 scalp 也可能变成 swing,但原始计划仍是小利润。
ticks 转多而价格仍中性
Time: 26:10
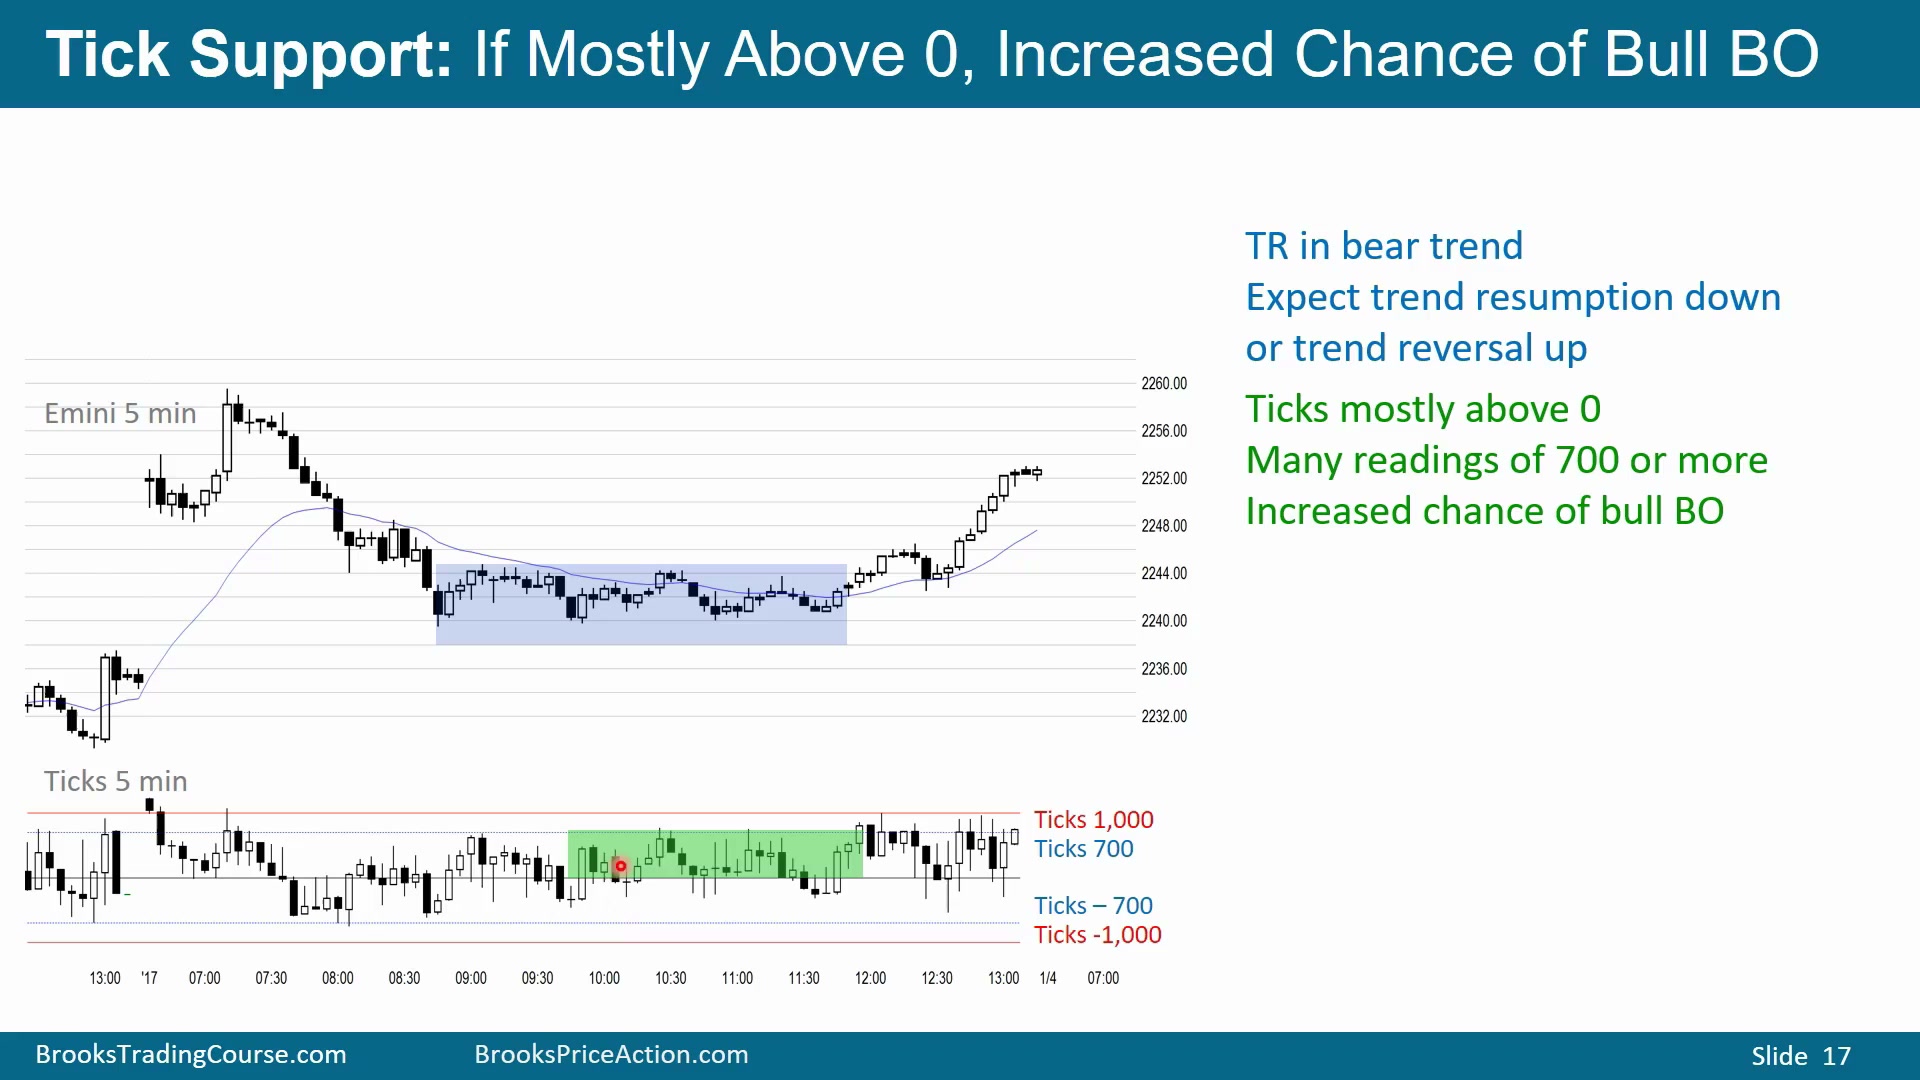
价格仍在熊趋势与均线下方横向 30 到 40 根 K 线时,ticks 却多数位于 0 上方,这提高了牛突破概率。多个 +700 附近读数、没有 -700 附近读数,说明内部市场已经偏多;价格若还没有明显转多,后面更容易出现 bull breakout。
gap open bar 的定义
Time: 26:55
如果当前 K 线开盘高于或低于上一根 K 线收盘,就是 gap open bar。这个信息有时能帮助交易者决定 scalp 或趋势交易,因为它反映上一根收盘后交易者是否急于买入或卖出。
gap open bar 既可能延续也可能反转
Time: 27:08
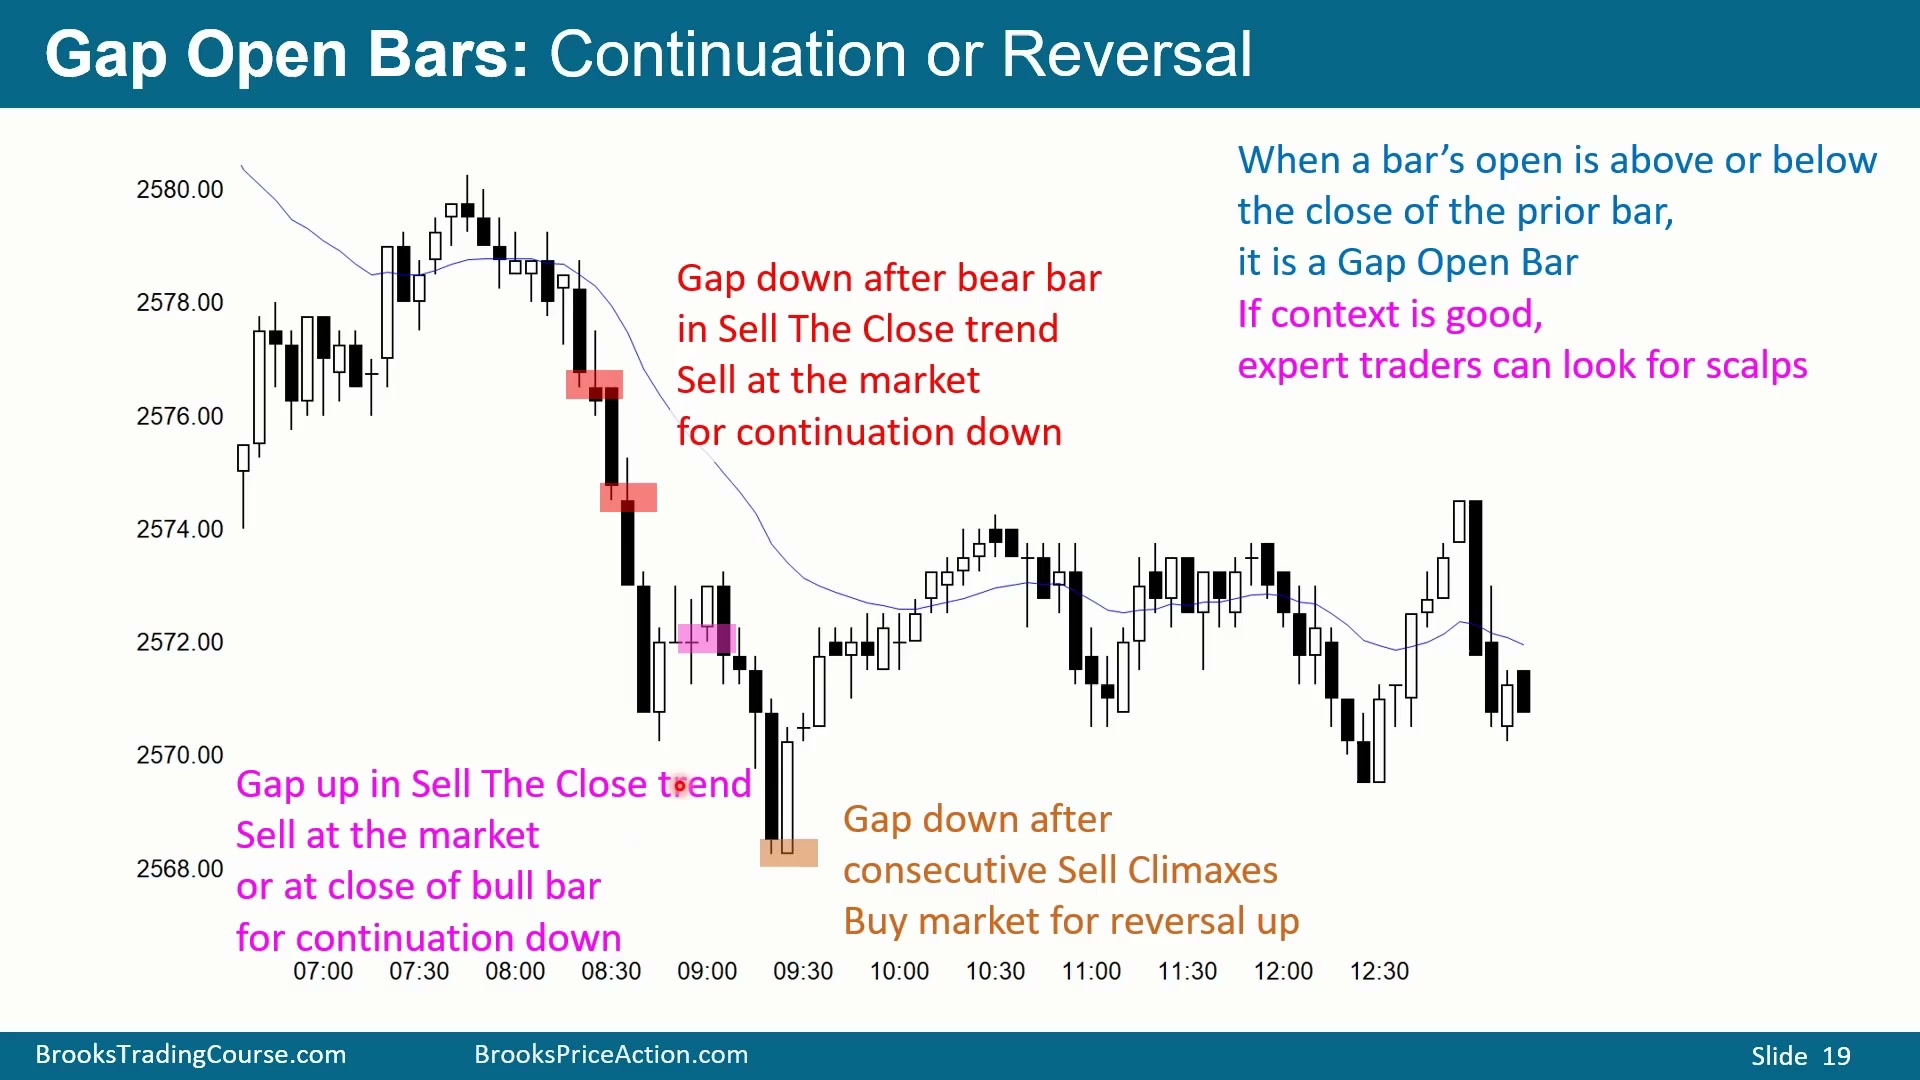
gap open 会提高趋势延续概率,也可能提高趋势反转概率,具体取决于背景。强趋势中,连续同方向 gap open 是趋势强的信号,交易者可以顺趋势入场并期待 swing;在 scalp 中,它也能帮助判断哪一方更急迫。
图中牛趋势后出现牛旗 High 1、High 2,但随后有很大的 outside down bar,向下突破牛旗,看起来不再是牛旗恢复上涨,而是空头突破。下一根 K 线开盘低于前一根收盘,说明大量交易者在前一根收盘后马上卖市价,空头急于卖或多头急于放弃。这是早期熊趋势中强卖压的信号,市场大概率继续下跌并形成几段。
随后再次出现空头 K 线后 gap down,继续说明交易者愿意卖收盘。卖收盘的前提是相信两件事之一会发生:市场直接下跌并获利;或者即使反弹,反弹也只是小回调,会形成熊旗或 Trading Range,价格最终回到原卖出价附近,让交易者至少不亏退出。
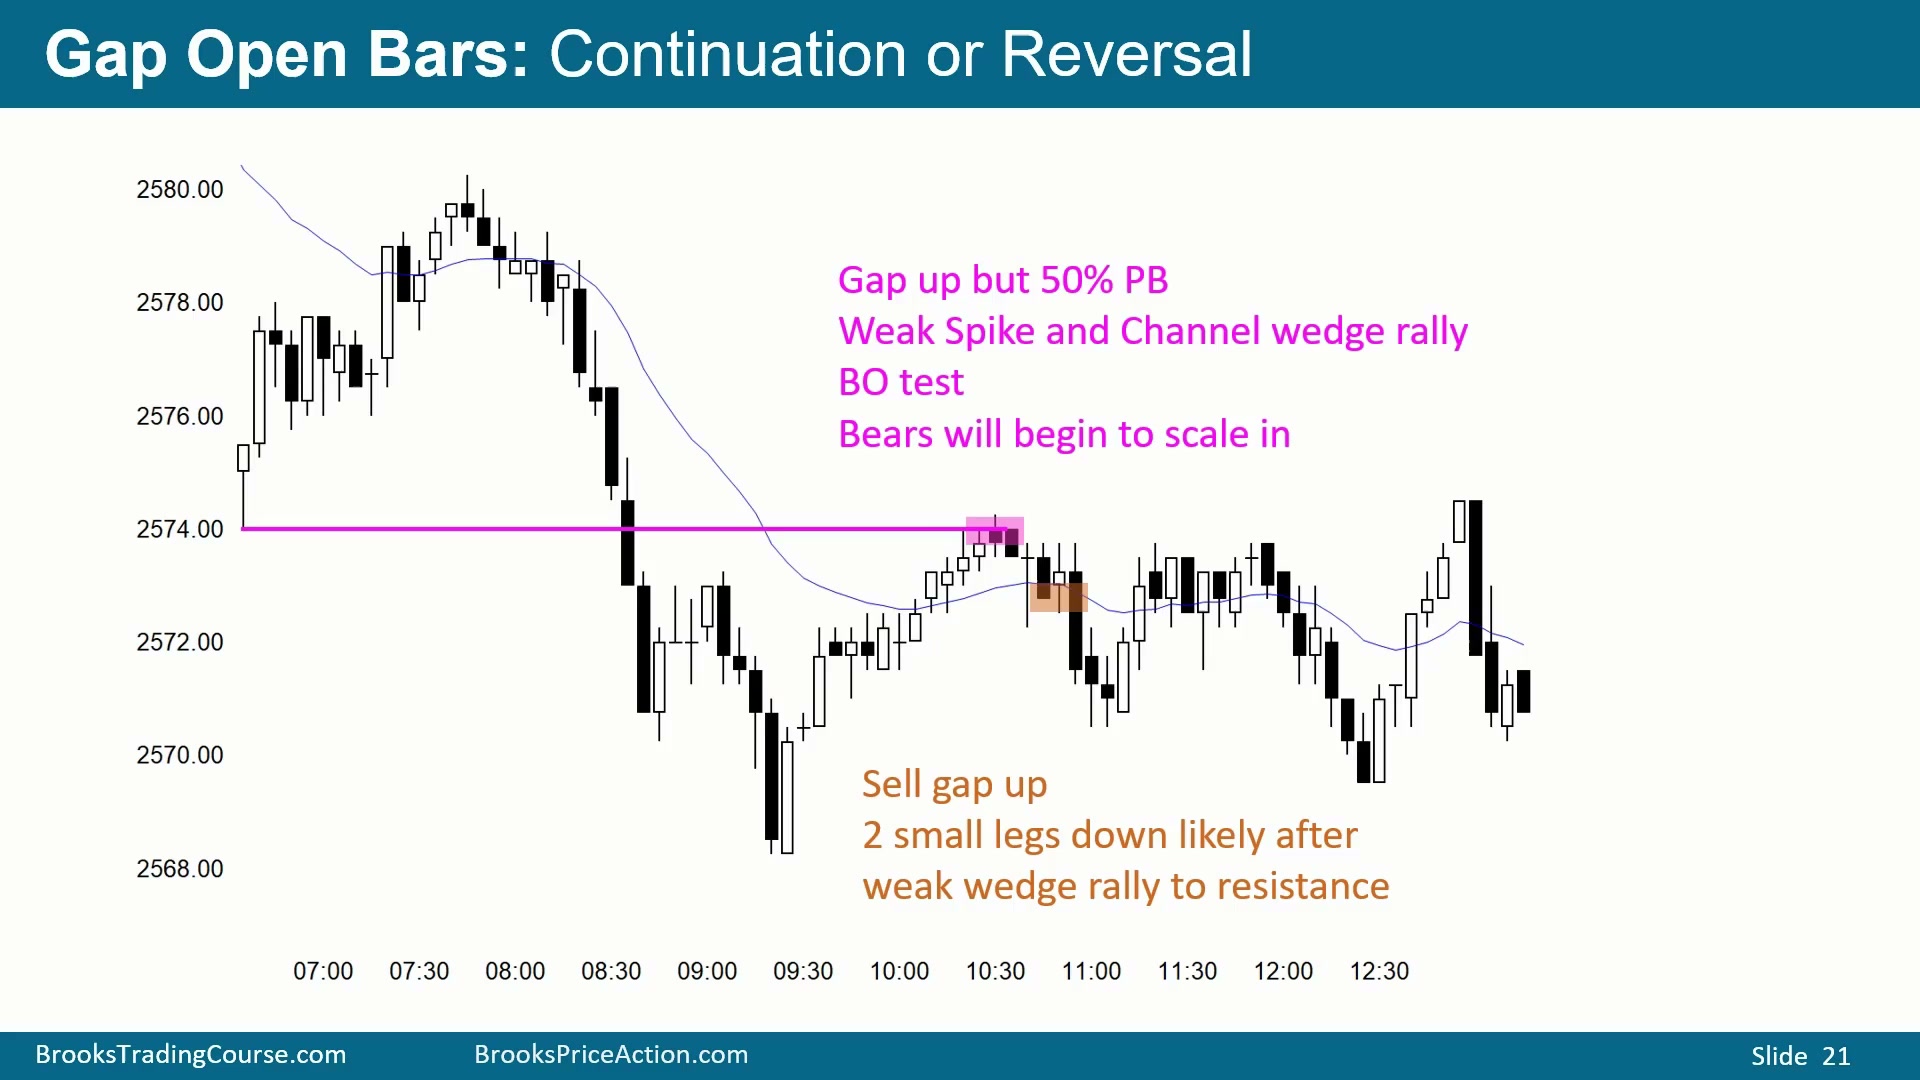
但不是每个 gap 都同义。强熊趋势中若出现 gap up,且多头入场 K 线和跟进都是 doji,这更可能只是 bear flag,而不是强多头反转;交易者可能卖开盘、卖多头 K 线或等反转向下后卖。趋势晚期则相反:连续 Sell Climax 后出现最大空头 K 线和 gap down,尤其在 Low 2 late in trend、可能 Final Flag、两边交易和影线之后,更可能是 exhaustive Sell Climax。经验交易者会认为 gap down 是陷阱,买空头收盘,或看到迅速反转向上时买入,预期空头被困并回补。
早期熊趋势中的 gap down 是急迫卖压:上一根空头收盘刚出现,下一根就低开,说明交易者不等回调,直接按市价卖。连续出现这种行为时,空头会卖收盘,因为他们相信即使反弹,也只是熊旗或 Trading Range,价格会回到原卖出价附近。
但同样的 gap down 若发生在趋势晚期、连续 Sell Climax 之后,意义会改变。图中最大空头 K 线出现在 Low 2 late in trend 和可能 Final Flag 之后,前面已有双向交易、影线和横向 K 线。经验交易者会把这根大空头 K 线看成耗尽,而不是新趋势开始;若下一根还 gap down 但马上反转向上,就更像空头陷阱,空头回补会推动反弹。
所以 gap open bar 的判断顺序是先看背景,再看开盘缺口。趋势早期、连续同向收盘和同向 gap,说明交易者急迫,适合顺势;趋势晚期、连续 climax、明显支撑阻力或两边交易后,同样的 gap 可能只是陷阱,适合经验交易者反向 scalp。
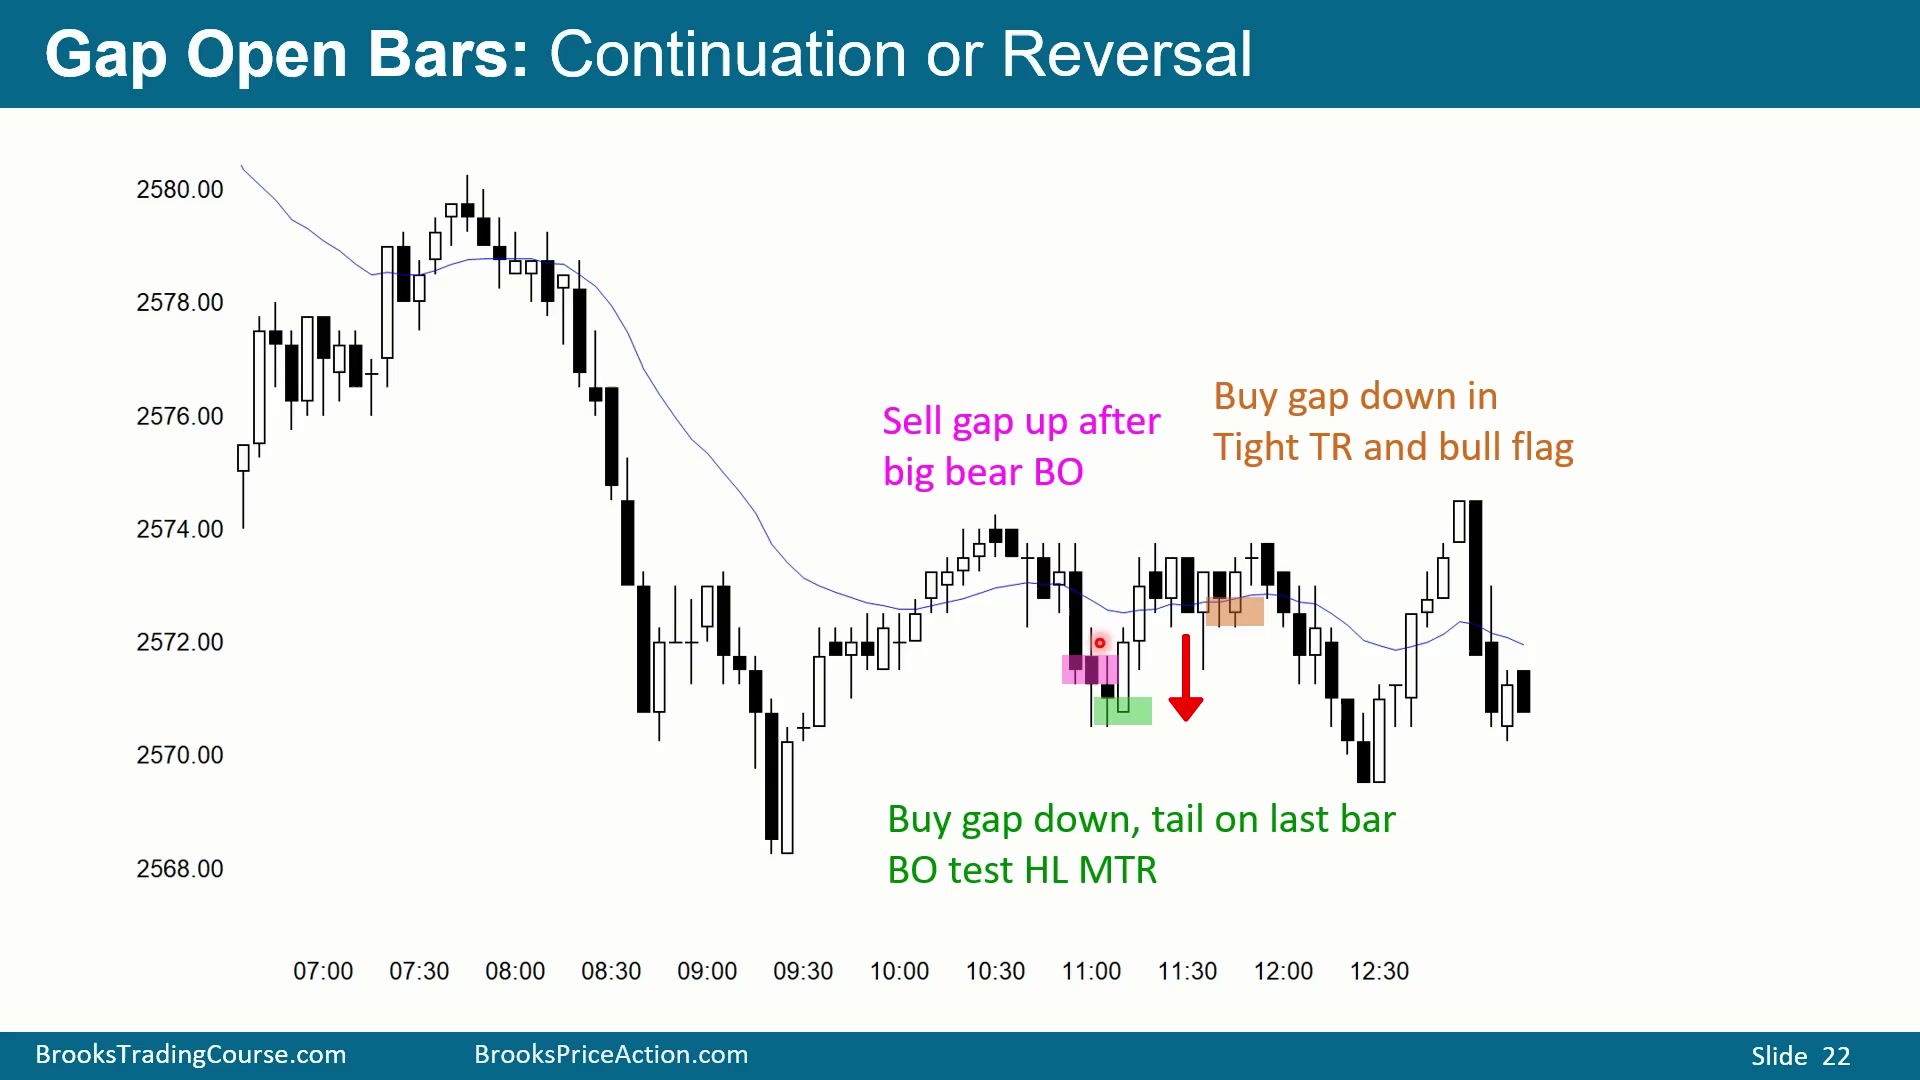
强熊通道后的 gap up 与 gap down
Time: 32:10
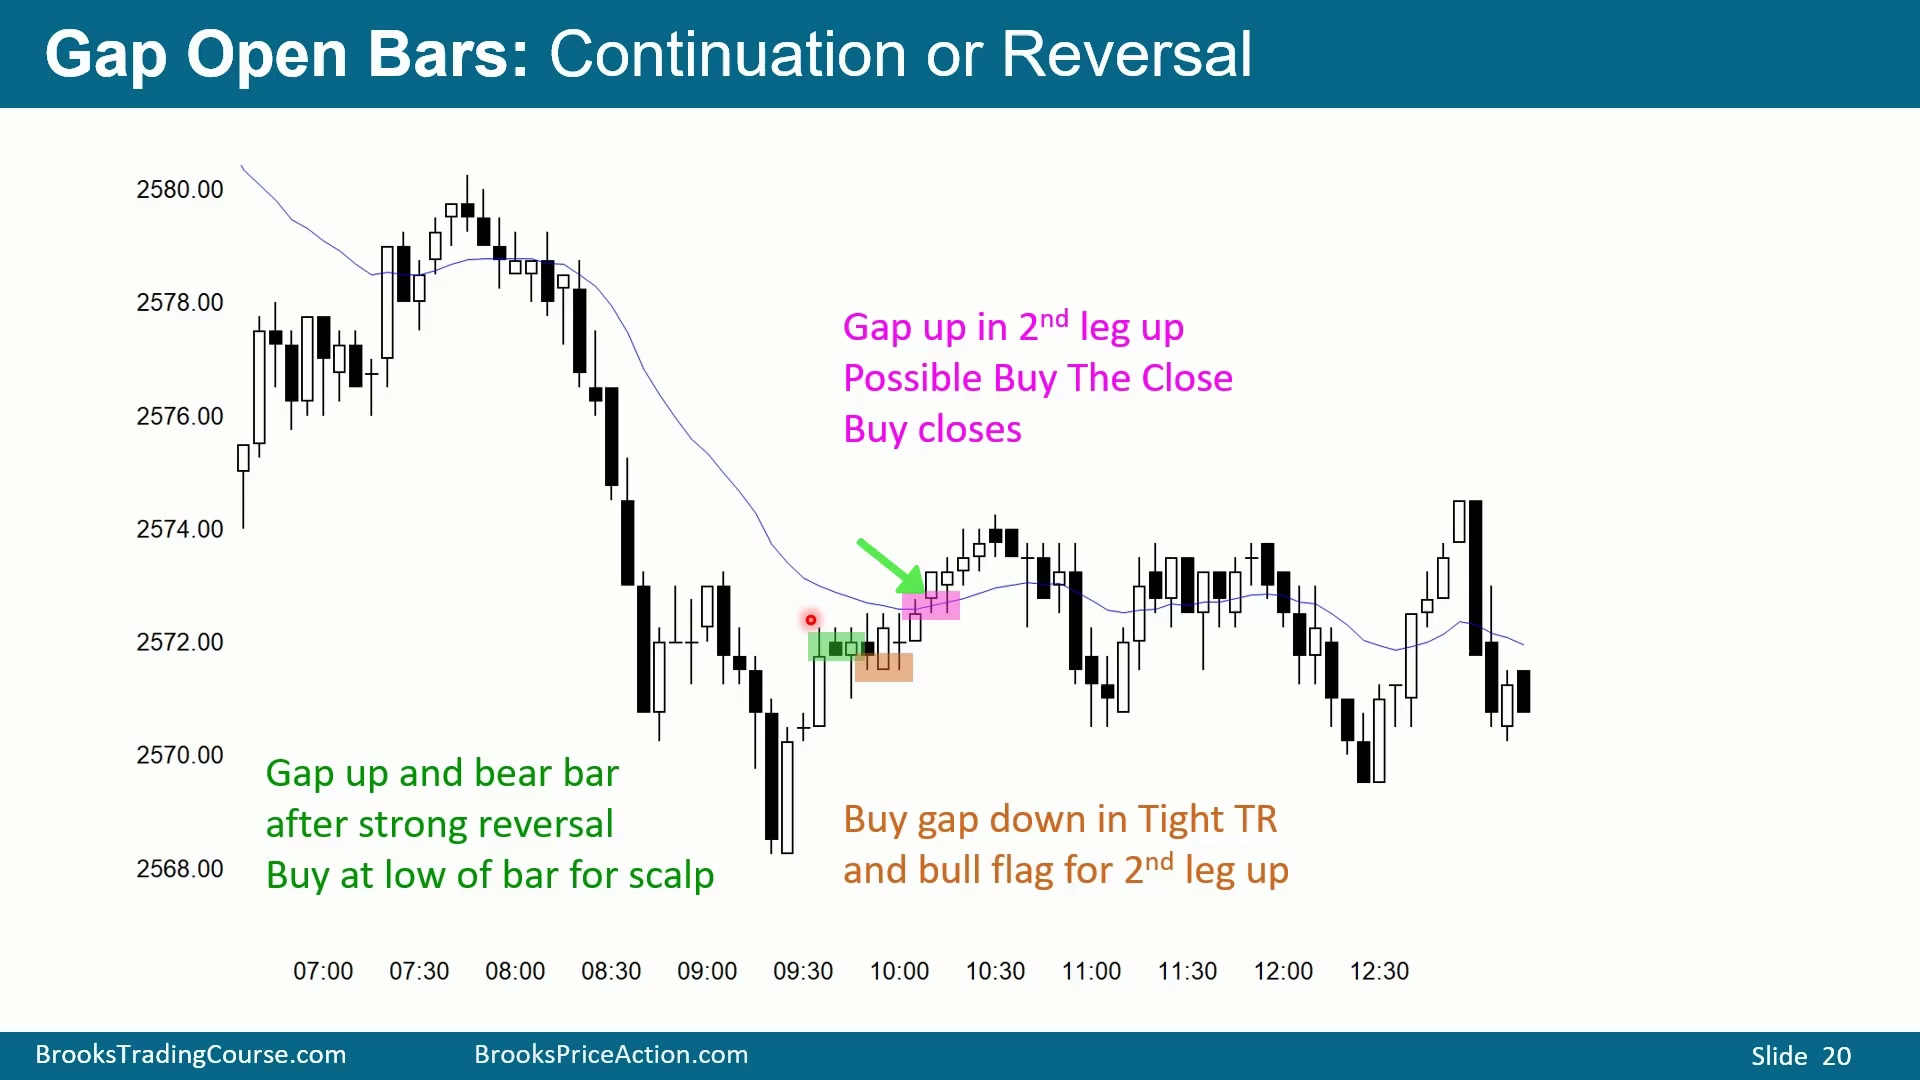
图中出现 gap up:空头 K 线开盘高于前一根多头 K 线收盘,后面又有另一处 gap up。反转很强,但背景是 very tight bear channel,第一次向上反转通常只是 minor reversal。反转强到足以让第二腿向上变得可能,因此有些多头会在 K 线低点买入并愿意更低加仓,押注形成 Higher Low 后至少横向或再上一腿。
小 cup and handle、反转后 bull flag、紧密区间里的 gap down,也会让多头寻找买入理由。若市场试图向下突破 Tight Trading Range,通常走不远;试图向上突破也未必走远。强熊趋势的第一次反转向上仍可能只是小反转,熊趋势恢复后才可能出现真正 Major Trend Reversal。
图中后面有 Higher Low Major Trend Reversal 尝试和 Double Bottom Higher Low。若出现多头 K 线、doji、另一根多头 K 线,并且下一根 gap up,说明买方愿意买收盘,至少寻找 scalp up。
图中的多头买法并不是因为第一次反转会变成牛趋势,而是因为反转足够强,通常会有第二腿。多头可以在低点买并准备更低买,押注形成 Higher Low;若出现 gap down 但前面是 doji、测试通道底、可能 Higher Low Major Trend Reversal,多头会把低开当作失败突破买入。
同时,必须承认 very tight bear channel 的压力。第一次向上反转多半是 minor reversal,之后熊趋势可能恢复;等恢复后,才可能形成更可靠的 Major Trend Reversal。scalper 在这些 gap 上买,通常只计划拿小利润,而不是假设一定有大 swing。
阻力处 gap up 可能是 bull trap
Time: 34:20
图中反弹是 spike、pullback、channel,小时间级别上可能是 Parabolic Wedge。它回测低点、约 50% 回调,并且多根 K 线与均线之间留下 gap,是熊趋势中的 Moving Average Gap Bars,通常会带来熊趋势恢复。熊趋势恢复后,通常还会有 Major Trend Reversal 尝试;图中多头有两次尝试,均失败。Major Trend Reversal 只有约 40% 概率形成向上 swing,约 60% 只是小利润或小亏。
当小多头 doji 开盘高于前一根空头收盘,形成 gap up 时,问题是这是否真能恢复上涨。此前预期 Sell Climax 后会有两腿向上,但现在是一系列 gap bars 到阻力和 minor reversal,市场更可能至少两腿下跌。因此,许多空头把这个 gap up 看成 bull trap,在诱使多头高位买入;激进空头会卖多头收盘或看到 gap up 后市价卖出,目标是至少第二腿下跌到支撑。
这一段反弹到阻力的结构包含多个空头理由:小时间级别可能是 Parabolic Wedge;多根 Moving Average Gap Bars 说明仍处熊趋势;此前 Sell Climax 后预期的两腿反弹已经接近完成;而 gap up 出现在阻力附近。空头因此认为多头被诱导在高位买入,尤其当后面需要至少两腿回到 channel 起点附近时,卖多头收盘或市价卖 gap up 都是专家级 scalp 选择。
弱化熊趋势中的 gap 交易
Time: 36:28
图中多头试图反转但失败。前面某处多头买收盘后,市场从未跌破该收盘,说明买方非常积极;这一次多头也希望大空头突破是 bear trap,并立即反转向上。但背景是紧密熊通道和大量空头 K 线,因此即使形态看起来像 Higher Low Major Trend Reversal,也更可能只是 minor reversal。
当 gap down 出现在大空头 K 线之后,如果前面紧接的是几个 doji、测试通道底部、可能 Higher Low Major Trend Reversal,以及强 minor reversal 向上,很多多头会在开盘低于前收时买入,认为卖压已经弱化,不太会继续大跌。经验交易者知道反转大概率只是小反转,所以目标通常只是 scalp。
价格还在测试此前多次反转的水平。每次市场到达这个价格区域都反转向上,因此多头看到 gap down 会买,押注再次反弹。若处在 Tight Trading Range、可能 bull flag 内部,多头也会买 K 线下方或 gap down,寻找至少小第二腿向上。
图中多头和空头的心理都要保留。多头希望大空头突破像前一个例子一样成为 bear trap;空头希望它像前面的牛旗失败一样继续下跌。实际背景更复杂:紧密熊通道让任何反转大概率只是 minor reversal,但下跌开始出现小实体、doji、测试通道底和重复反转价位,说明卖压正在弱化。
因此,gap down 低开时,多头不是在盲目逆势,而是在测试一个曾多次反转的价格区,同时押注卖方无法继续推进。后面 Tight Trading Range 中,低开到前收下方也会被多头买入,因为他们预期至少还有小第二腿向上;到区间顶部时,则不能再期待大幅上涨,因为同一价格区此前多次引发卖出。
收盘买入尾盘冲刺的风险
Time: 39:45
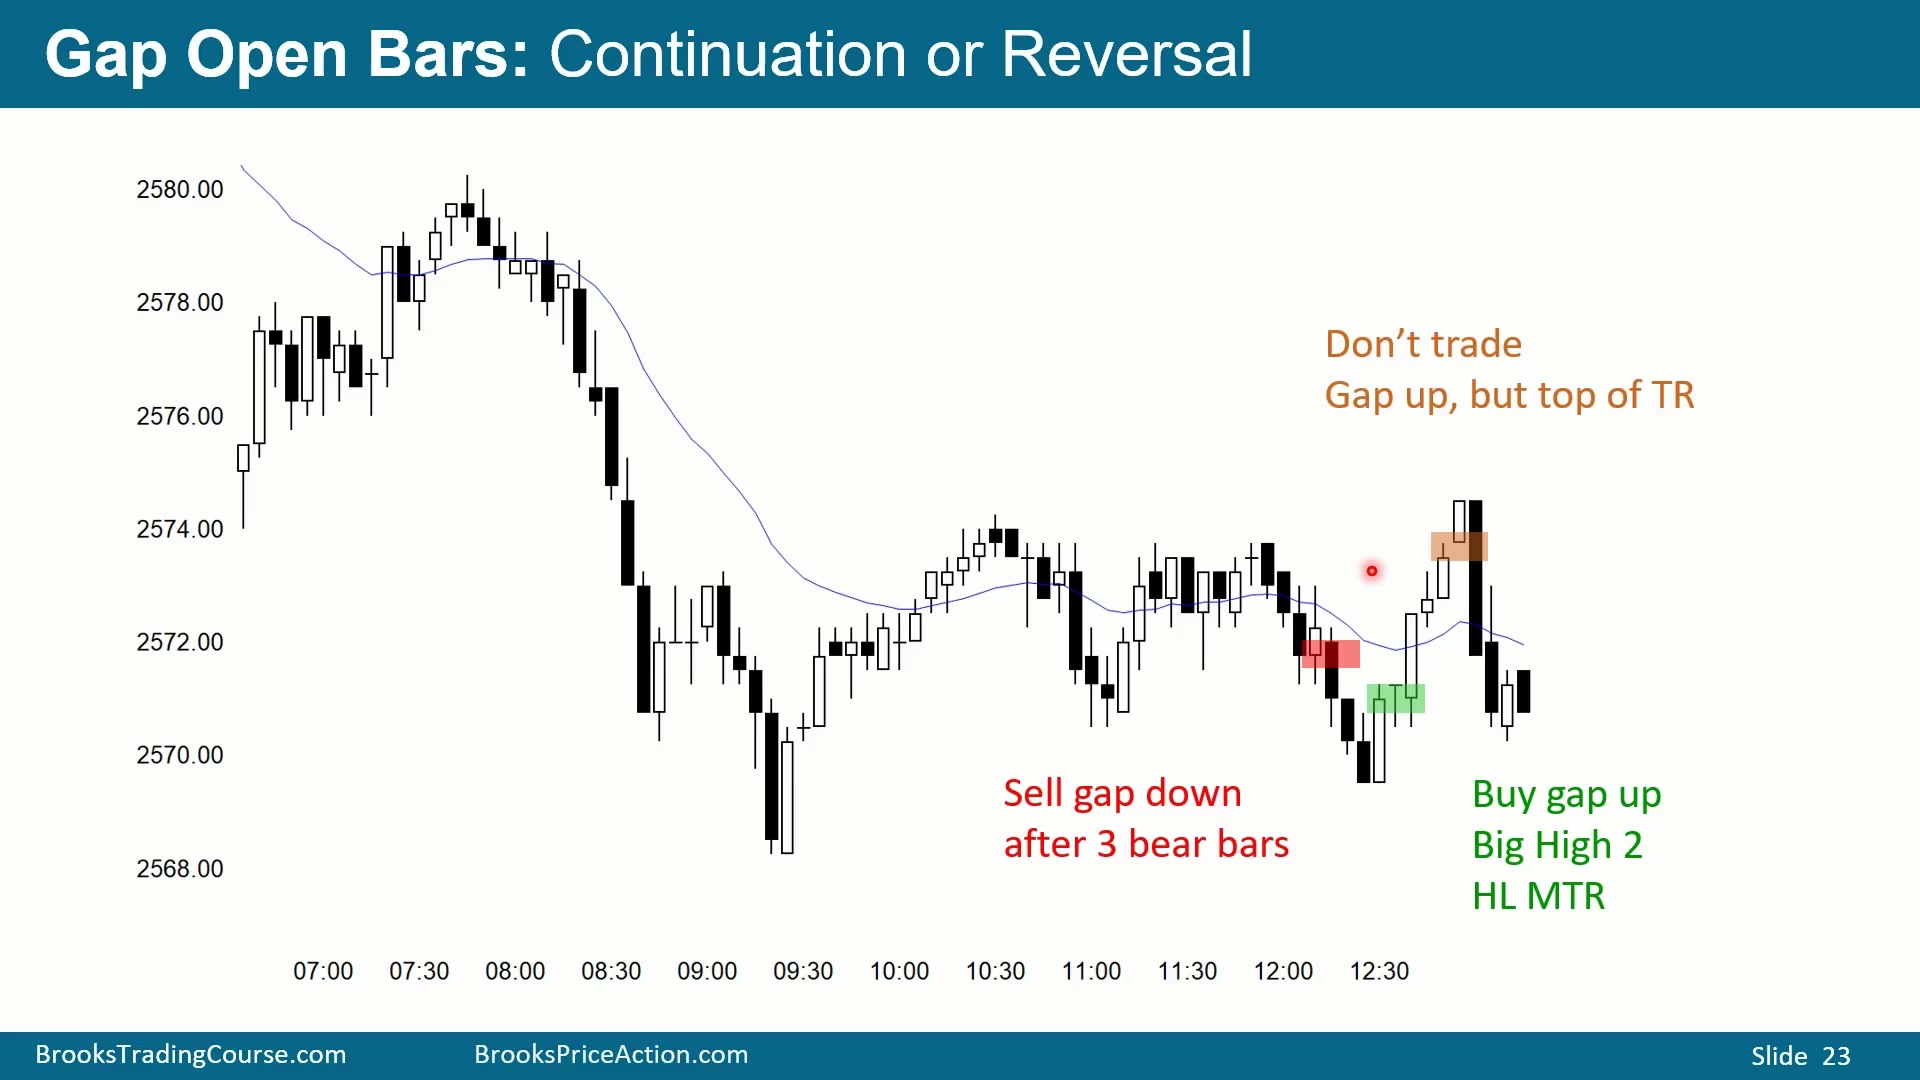
图中多头 K 线上方有影线,随后三根空头 K 线收在中点下方且实体不错,说明向下反转足以带来至少小第二腿下跌。有些空头看到 K 线 gap up 后,会认为这是 bull trap,诱使交易者买 Major Trend Reversal,而市场更可能再下一腿。
后面又出现 Higher Low Major Trend Reversal 尝试,属于大型 High 2;但 very tight bear channel 背景下,它仍可能像前一次一样只是 minor reversal。gap up 说明很多多头相信这是 Major Trend Reversal 或 Trading Range 底部 Double Bottom,价格应测试区间上方;确实有足够空间拿 scalp。
但再往左看,该价格区此前多次引发下跌,当前又是两腿向上且接近尾盘。尾盘 Buy The Close rally 通常持续 4、5 或 6 根 K 线后反转;如果已经是第五根多头 K 线且在阻力处,不宜继续买收盘。若多头在尾盘买收盘,通常会在空头 K 线下方 1 tick,或多头 K 线下方 3 到 4 ticks 出场;空头知道多头会卖,也会跟着做空拿 scalp down。
尾盘 Buy The Close rally 的管理也很具体。若交易者买了第四、第五根多头收盘并遇到反转,他们不会等很远的止损,通常在空头 K 线低点下方 1 tick,或在多头 K 线低点下方 3 到 4 ticks 退出。空头知道这些多头止损会触发,也会在同一位置卖出做 scalp down。阻力、两腿上涨、尾盘以及已经多根连续多头 K 线叠加,使继续买收盘的概率下降。
ticks 与 gap bars 的使用边界
Time: 42:25
ticks 可以帮助交易者顺趋势或逆趋势寻找 scalp。ticks 为正时,交易者倾向找买入;ticks 为负时,倾向找卖出。climax 后出现 tick divergence,交易者常寻找反方向 scalp,也就是小反转。
gap bar 是当前 K 线开盘高于或低于上一根收盘。它可能代表强势并带来延续,也可能在趋势晚期或阻力支撑处成为反转信号。判断 gap 的意义必须结合背景。