al-brooks-course
50B - Scalping
Readable self-study lecture notes for 50B - Scalping.
Source Media
新手应避免以 scalping 为主
Time: 00:11
新手应避免 scalping,因为这种交易太容易亏钱。scalp 的目标小,要求交易者用极高胜率抵消风险收益劣势,而新手不可能稳定做到。部分 scalper 会使用两个时间级别:先在一个时间级别上寻找 setup,再到更小时间级别寻找更早入场;这种方法听起来能降低风险,但对新手尤其危险。
只盯风险会忽略交易者方程
Time: 00:37
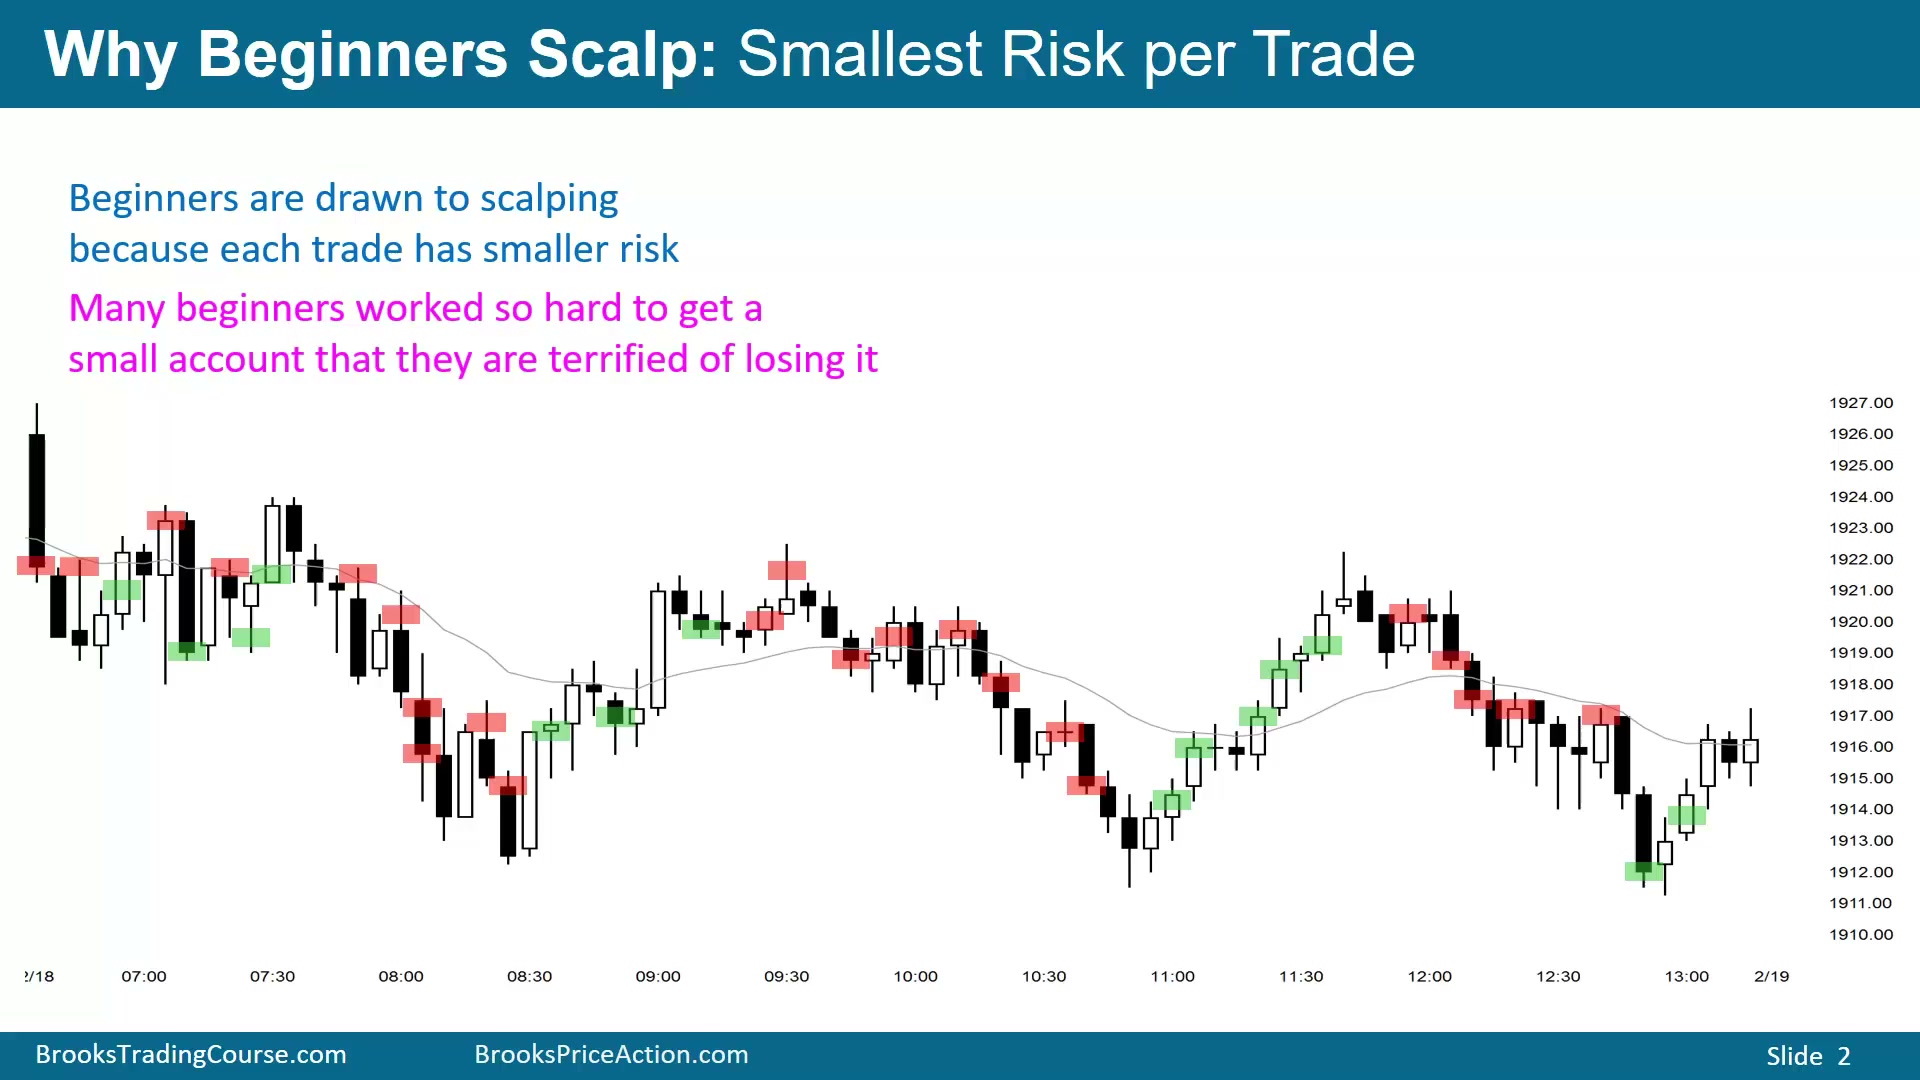
新手想 scalp,是因为它看起来每笔风险最小。他们往往账户不大,账户来自辛苦积累,还背负家庭压力,害怕快速亏掉资金、失去交易生涯的梦想。因此,他们自然把注意力集中在风险上。
问题在于,任何交易都必须同时考虑三个变量:风险、收益和概率。交易者方程要求“胜率乘以预期收益”显著大于“亏损概率乘以预期风险”。如果只看风险,就会忽略收益,更会忽略概率,最终让数学结构变差。账户跌到无法满足保证金要求,或彻底亏完,就是 blown account,也是新手最害怕的“梦想死亡”。
图中红色矩形是合理做空 scalp 入场,绿色矩形是合理做多 scalp 入场。Emini 的最小 scalp 是 1 点。某些位置看似不该买,例如连续空头 K 线正试图向下突破 Trading Range;但多头会买空头收盘,因为空头还需要一两根跟进 K 线才算真正控制市场。在跟进出现前,多头押注大多数 Trading Range 突破会失败。
图中买空头收盘的例子尤其重要。连续空头 K 线向下突破区间时,新手只看到“如果买会不会亏很多”,却没有看到空头仍缺少跟进、区间突破大多失败、买方概率可能更高。只要空头还需要一两根 K 线才能证明控制市场,多头就可以用合适管理去买这个看似吓人的收盘。
忽略概率是新手 scalp 的核心问题
Time: 03:25
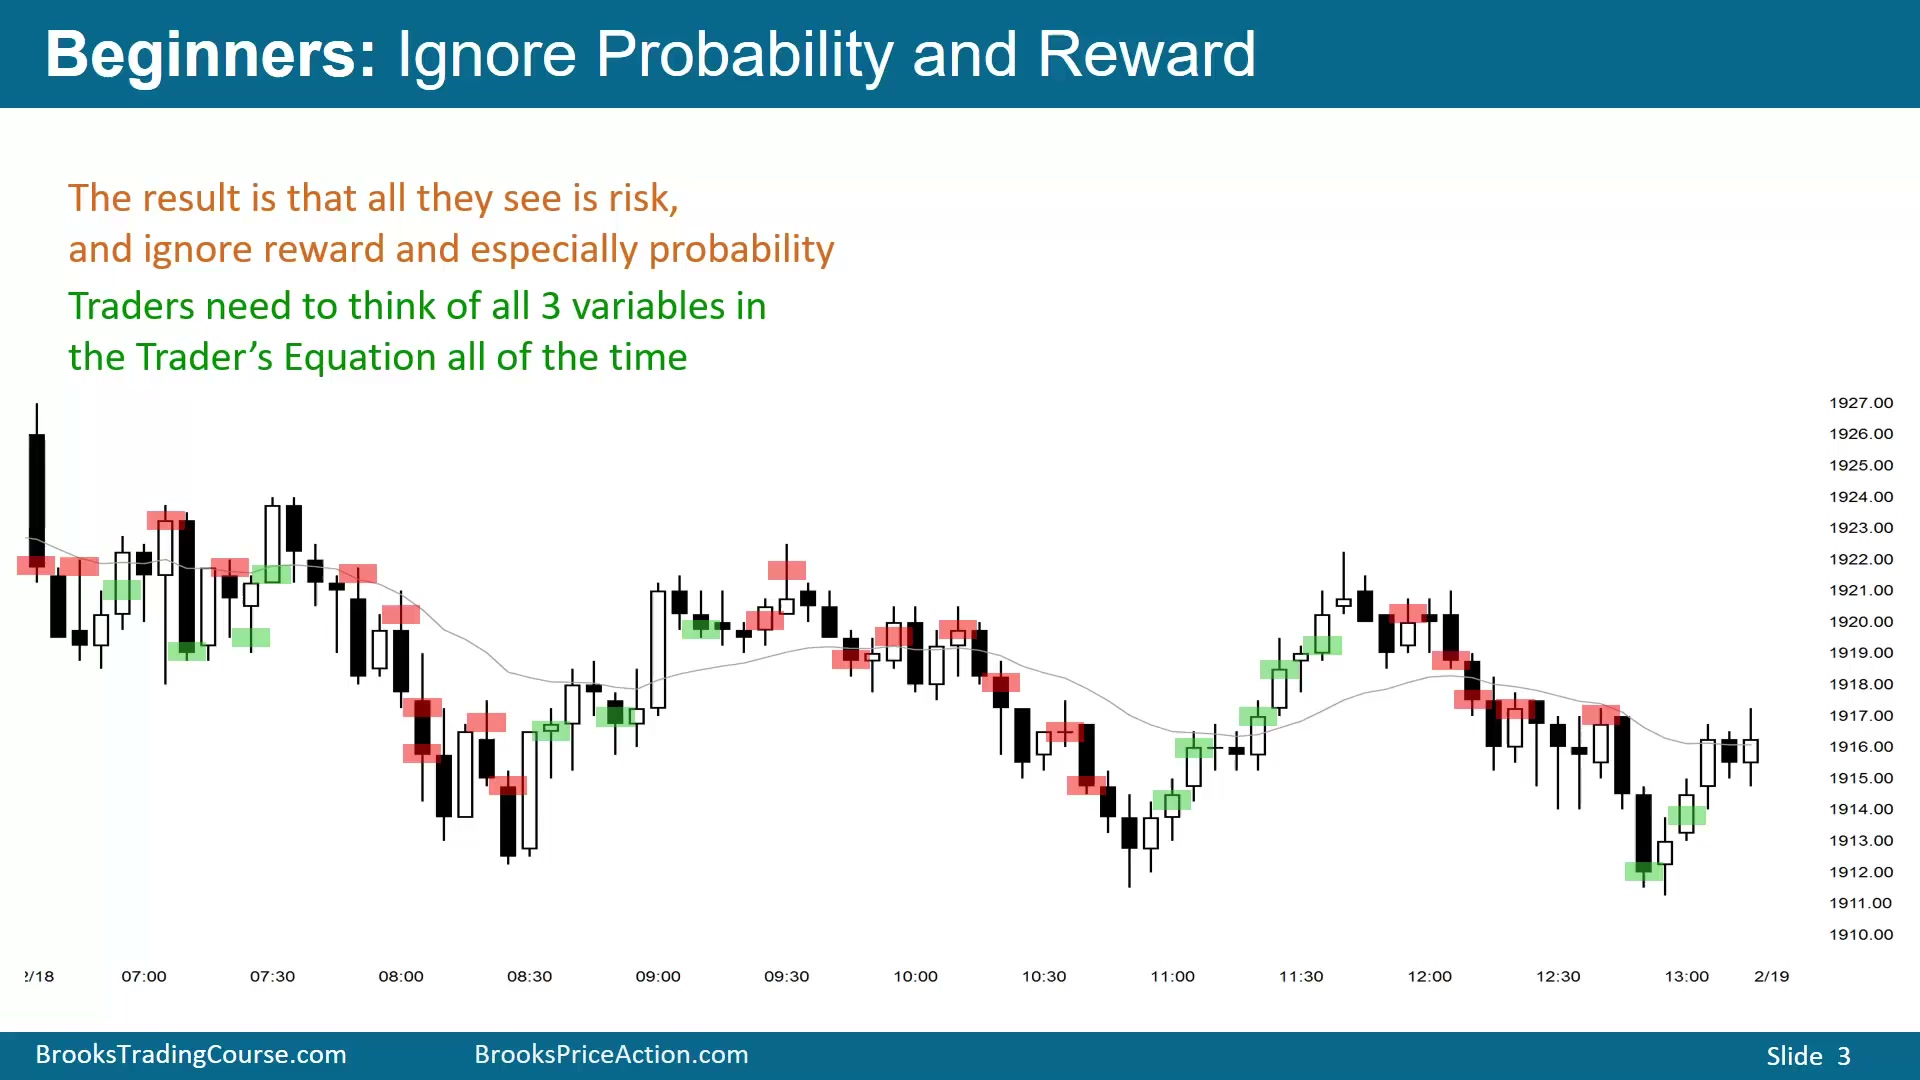
新手通常只看风险,忽略收益,尤其忽略概率。scalping 能否盈利,不取决于单笔止损看起来小,而取决于风险、收益和概率是否共同构成正期望。
Emini 的 K 线大小提供许多 scalp 机会
Time: 03:45
普通 Emini 5 分钟图上,平均 K 线通常大于最小 scalp。最小 scalp 是 1 点,因此几乎每根 K 线都有足够空间容纳 scalp;有经验的交易者可以在每根 K 线上看到潜在入场,但这不代表每个都要做。每天 81 根 5 分钟 K 线,至少约有 40 个合理的 1 点 scalp;多数经验丰富的 scalper 一天做 10 到 20 笔。
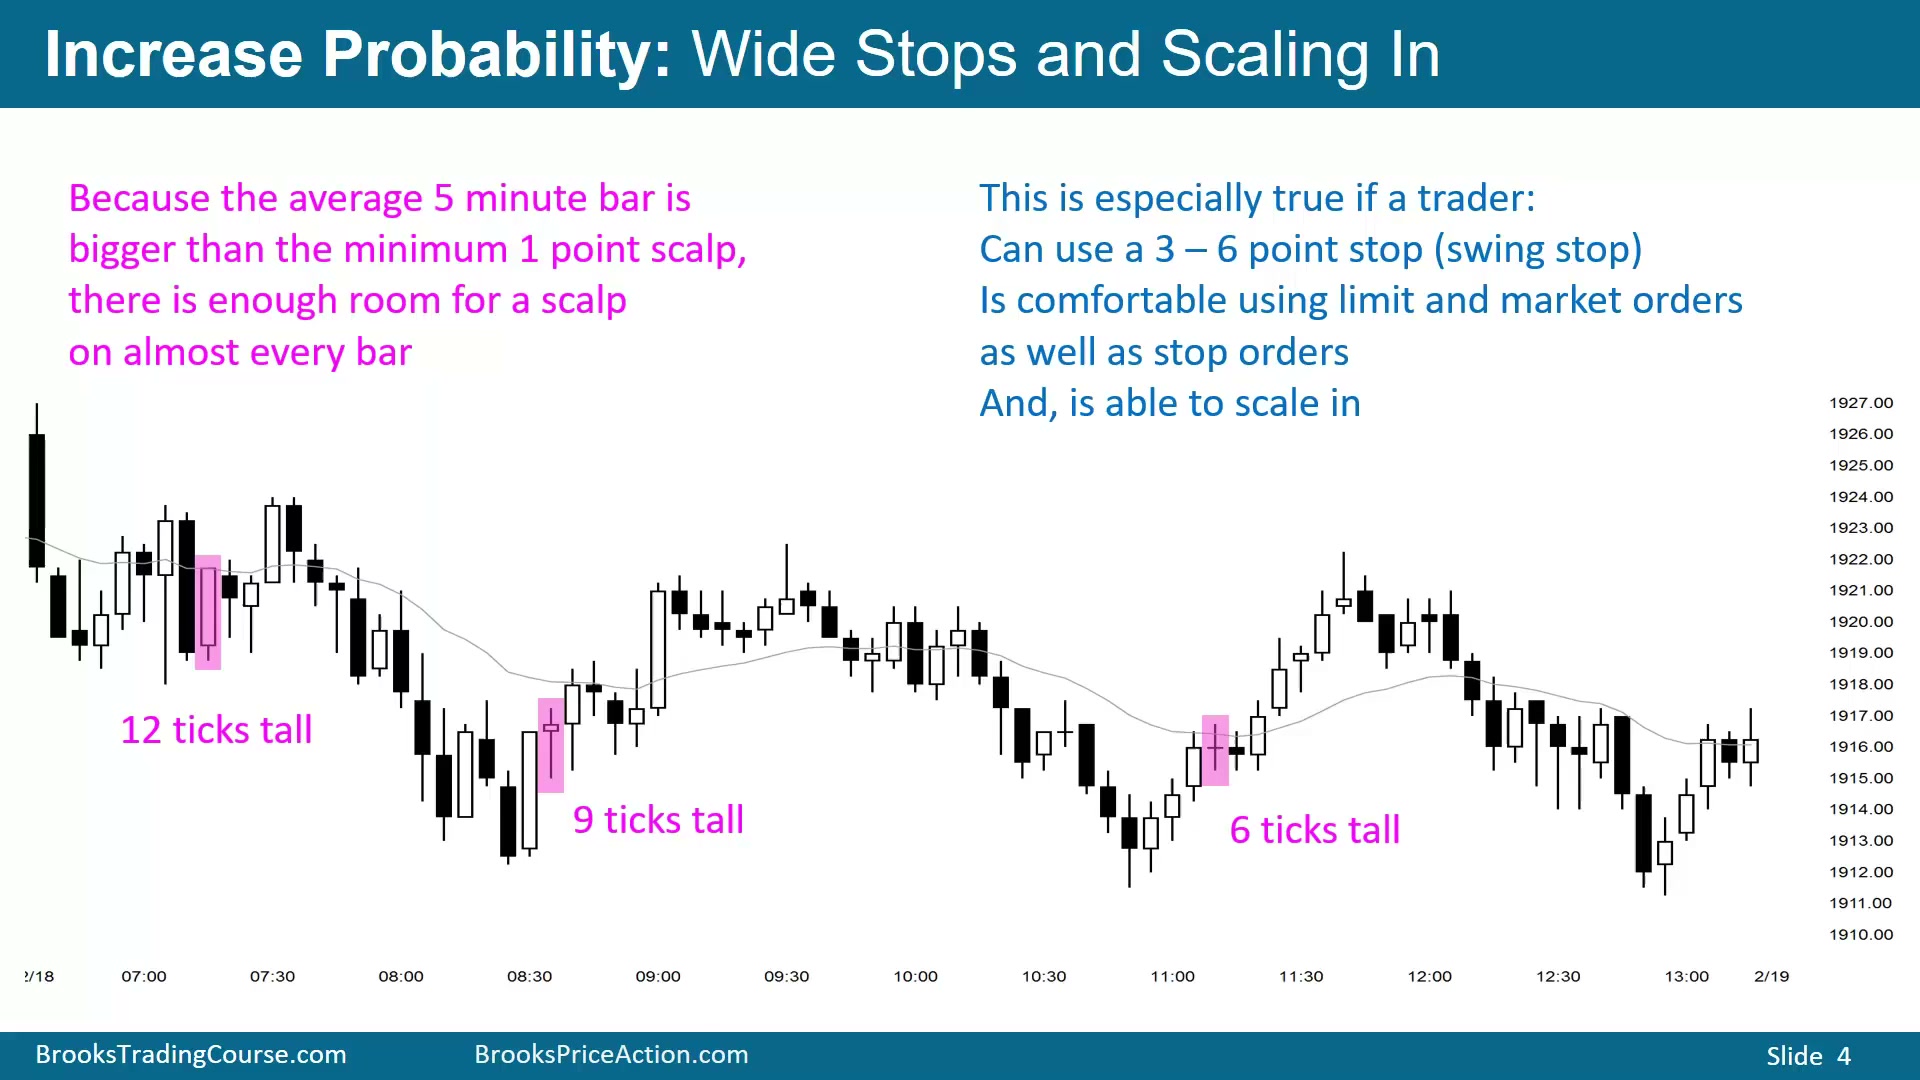
图中有些 K 线看似普通,但一根 12 ticks 高,一根 9 ticks 高,即使最小的也有 6 ticks,比最小 scalp 大 50%。例如区间底部连续三根多头 K 线反转向上后,scalper 会买收盘,并尝试在该 K 线低点买更多;如果市场未回到低点,交易者直接拿利润退出。
要做到 90% 胜率很难,除非愿意用宽止损并 scale in。这样会提高风险:止损更远,仓位也可能增加;目标利润却固定,只是 Emini 中 1、2 或 3 点。交易者接受更差的风险收益,是为了换取更高成功概率。概率是风险收益的另一面,不可能既有极好风险收益,又有极高胜率;必须有机构愿意接你的对手盘,而对手盘必须获得某种补偿。
图中具体 K 线高度说明为什么 Emini 适合 scalp:12 ticks、9 ticks、甚至 6 ticks 的 K 线,都大于 4 ticks 的 1 点目标。scalper 的目标固定在 1、2、3 点,风险却会因为宽止损和加仓而增加;他们是在用更差的风险收益购买更高概率。若没有愿意接对手盘的机构,交易不会成交;机构愿意接,是因为交易者让出了风险收益。
scale in 用更大风险换更高概率
Time: 06:40
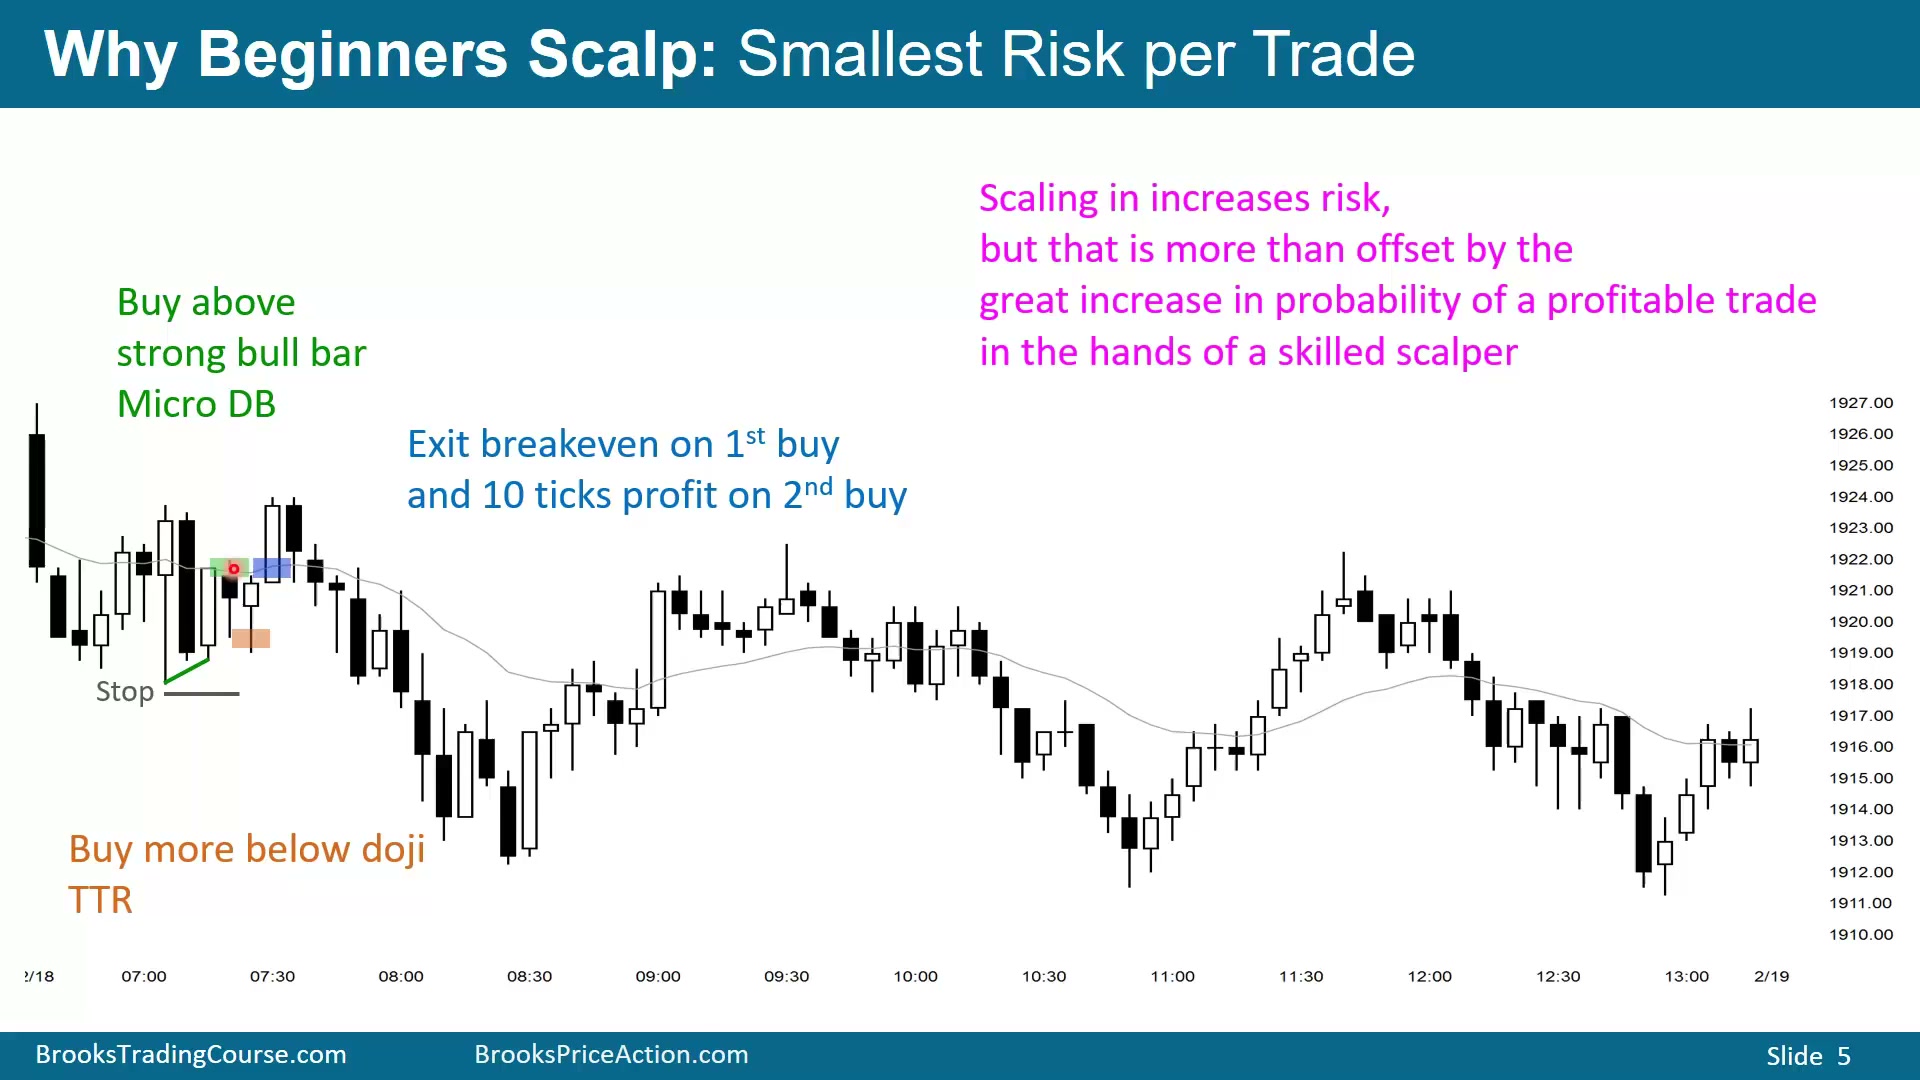
scale in 会增加风险,但也会提高赚钱概率,这是熟练交易者愿意用宽止损和加仓的原因。一般来说,图表上 90% 的 K 线处在 Trading Range 或 channel 中;只要管理正确,交易者可以在这些环境里买或卖并赚钱。
图中市场在紧密区间里反复反转。多头在区间底部出现不错的多头 K 线和第二根多头 K 线,尝试反转向上;用 buy stop 在该 K 线高点上方买入做 scalp 是合理的,但止损必须放在区间底部下方。随后市场又形成 Micro Double Bottom,多头可以再次买入,并把止损放在区间底部下方。
从空头角度看,在带有大下影线的空头 K 线低点下方卖出,并且位置在 Tight Trading Range 底部,并不理想;市场此前多次在这一价格反转向上,因此这更像糟糕卖出 setup,也就可能成为不错的买入 setup。经验丰富的多头如果已在信号 K 线上方买入,可能在这根 K 线低点买更多。若第二笔低了 10 ticks,价格回到第一笔入场上方时,第一笔保本,第二笔获得 10 ticks scalp。
图中第二笔买入低于第一笔 10 ticks,这不是随意加仓,而是为了让第二笔本身有足够 scalp 空间。价格回到第一笔入场上方时,第一笔不赚钱也不亏,第二笔已经有 10 ticks 利润。若第二笔离第一笔太近,回到第一笔时第二笔利润不足,就不能补偿额外风险。
双时间级别入场不应频繁使用
Time: 09:15
有些交易者会在一个时间级别寻找 setup,再到更小时间级别找更早入场,希望降低风险。例如在 60 分钟图上看到 setup 后,用 5 分钟图寻找较小风险入场;或在 5 分钟图上看到形态后,到 3 分钟、2 分钟或 1 分钟图进场。
一般而言,即使是熟练的 5 分钟图交易者,也很少用 1 分钟图入场,可能只占 10% 或更少。
同一位置买卖都可能赚钱,前提是管理正确
Time: 10:00
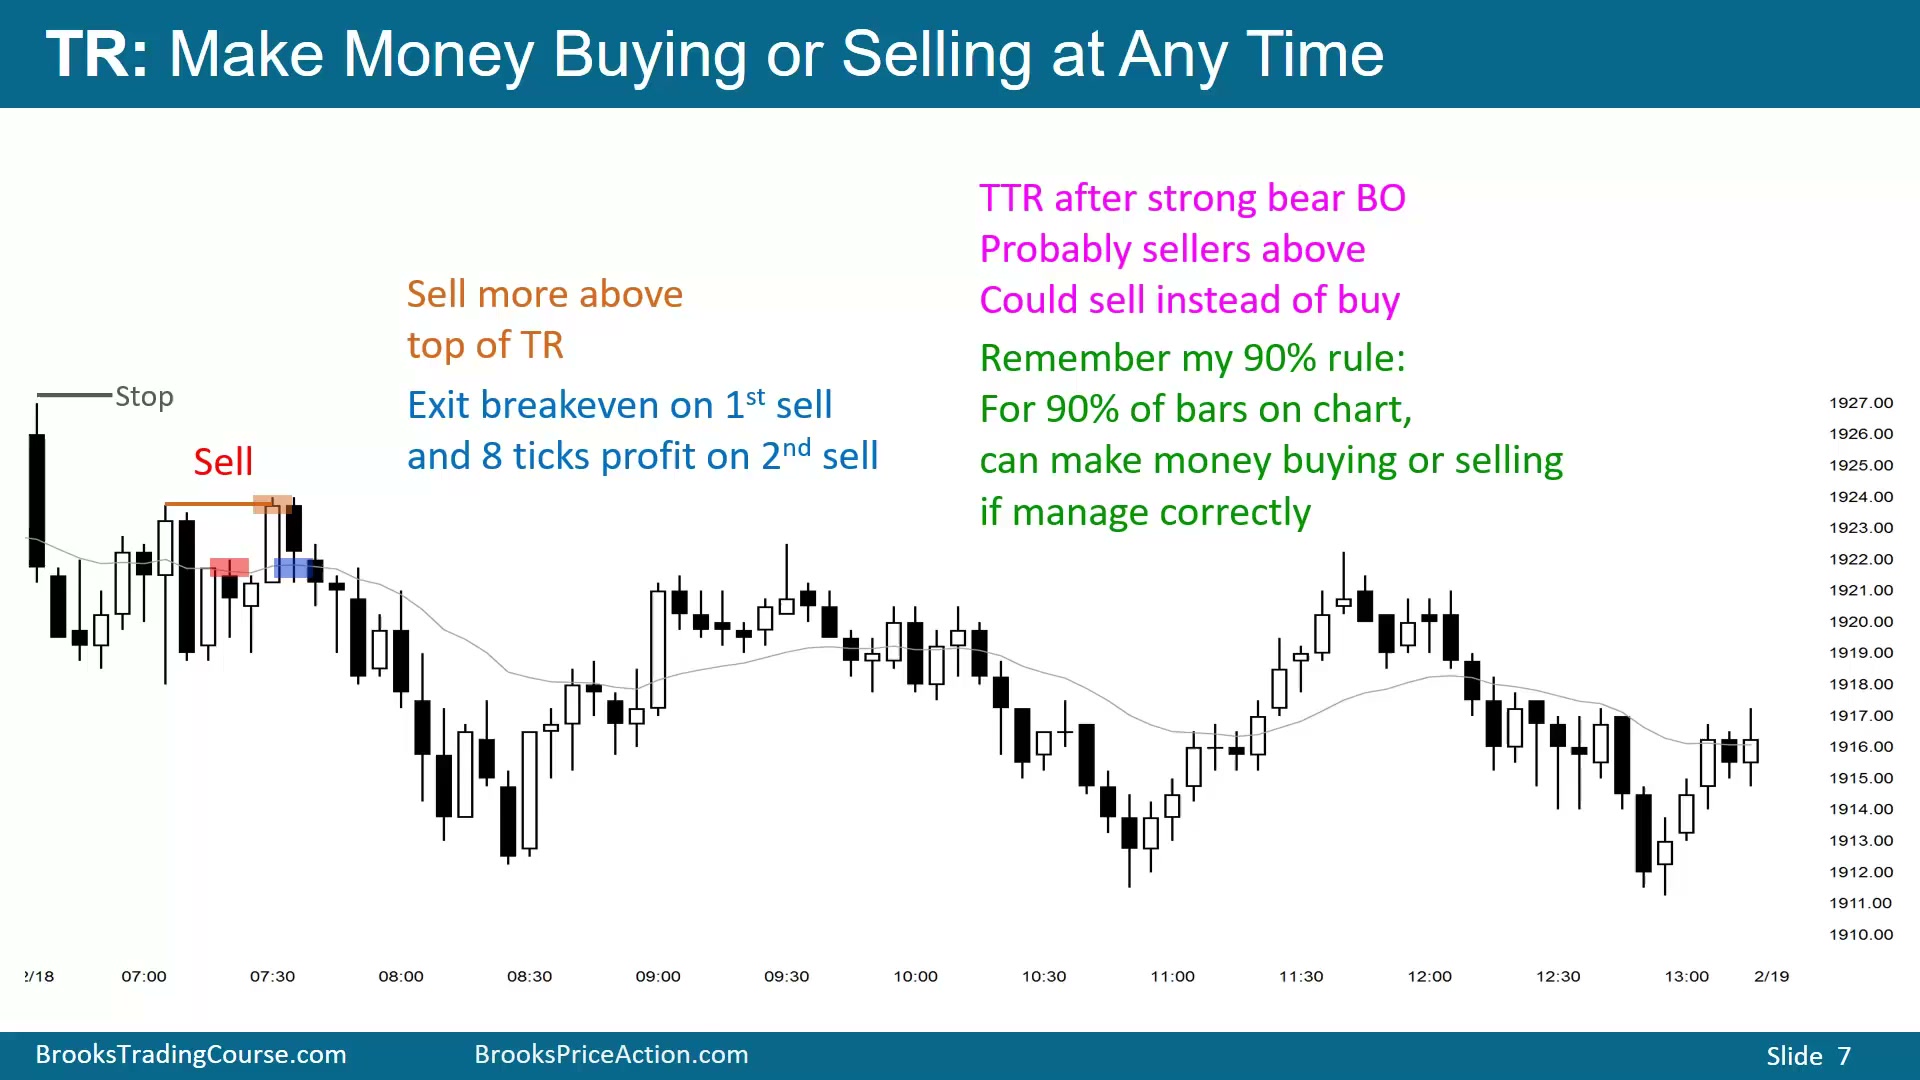
前面讨论的买入 setup,也可以被空头交易。因为图中是 Tight Trading Range,如果交易者在高点限价卖出,并愿意更高加仓、使用宽止损,他也可能赚钱。假设他在某根 K 线高点放限价卖单,成交后市场下跌超过 2 点,本来可以 scalp 出场。若他没有出场,期待 swing 下跌,但随后看到反转,就应判断市场更可能维持 Trading Range,于是切换到 scalp 管理。
做空时,止损应放在最近强下跌段顶部上方。图中有三根连续空头 K 线,其中两根较大;随后反转向上让空头失望。空头可以在原止损仍有效的前提下,在前高再卖一次,只要第二笔高于第一笔至少一个 scalp。此例中第二笔高 8 ticks,也就是 2 点,等于最小 scalp 的两倍;价格回到第一笔入场时,第一笔保本,第二笔赚 2 点。
这体现了 90% 规则:图表上多数 K 线处在 Trading Range 或 channel 中。熟练交易者只要管理正确,通常也就是 scale in 和宽止损,可以买也可以卖并赚钱。
1分钟图能更早入场,也会降低可靠性
Time: 12:18
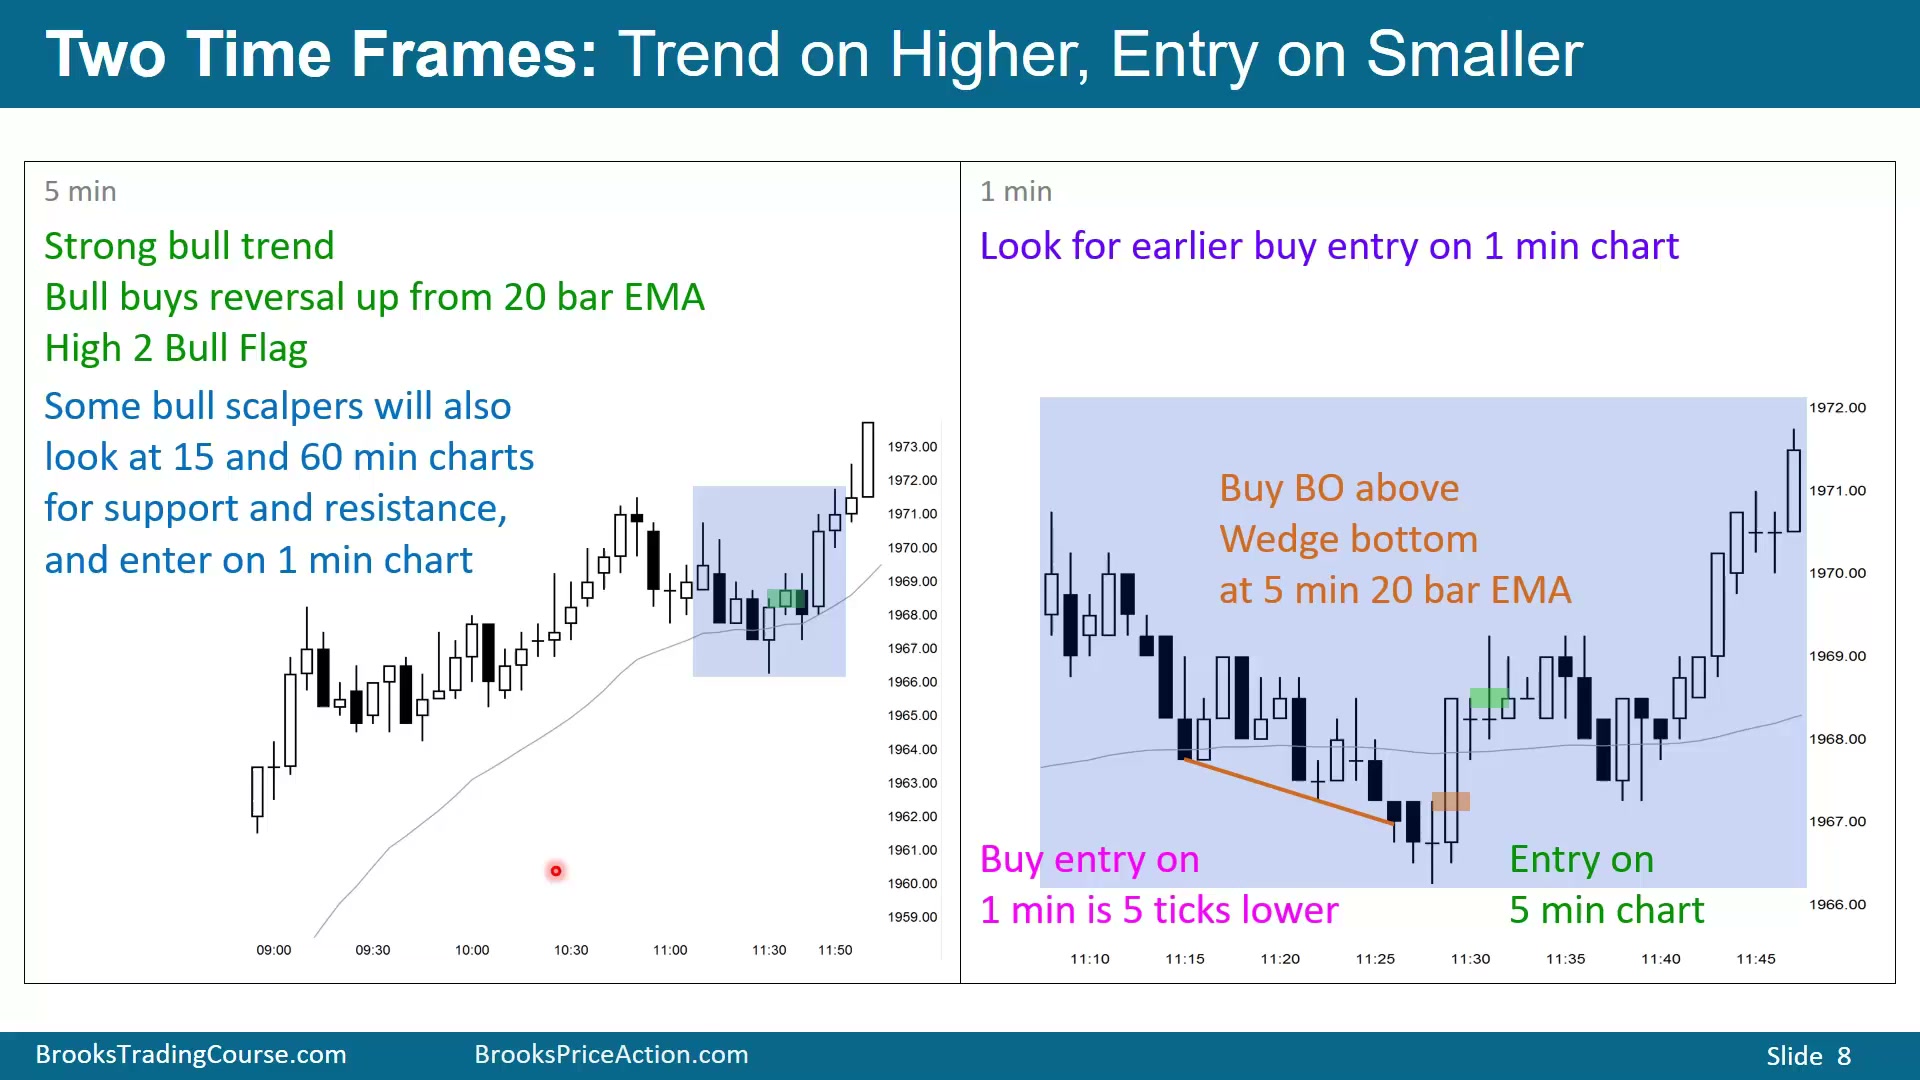
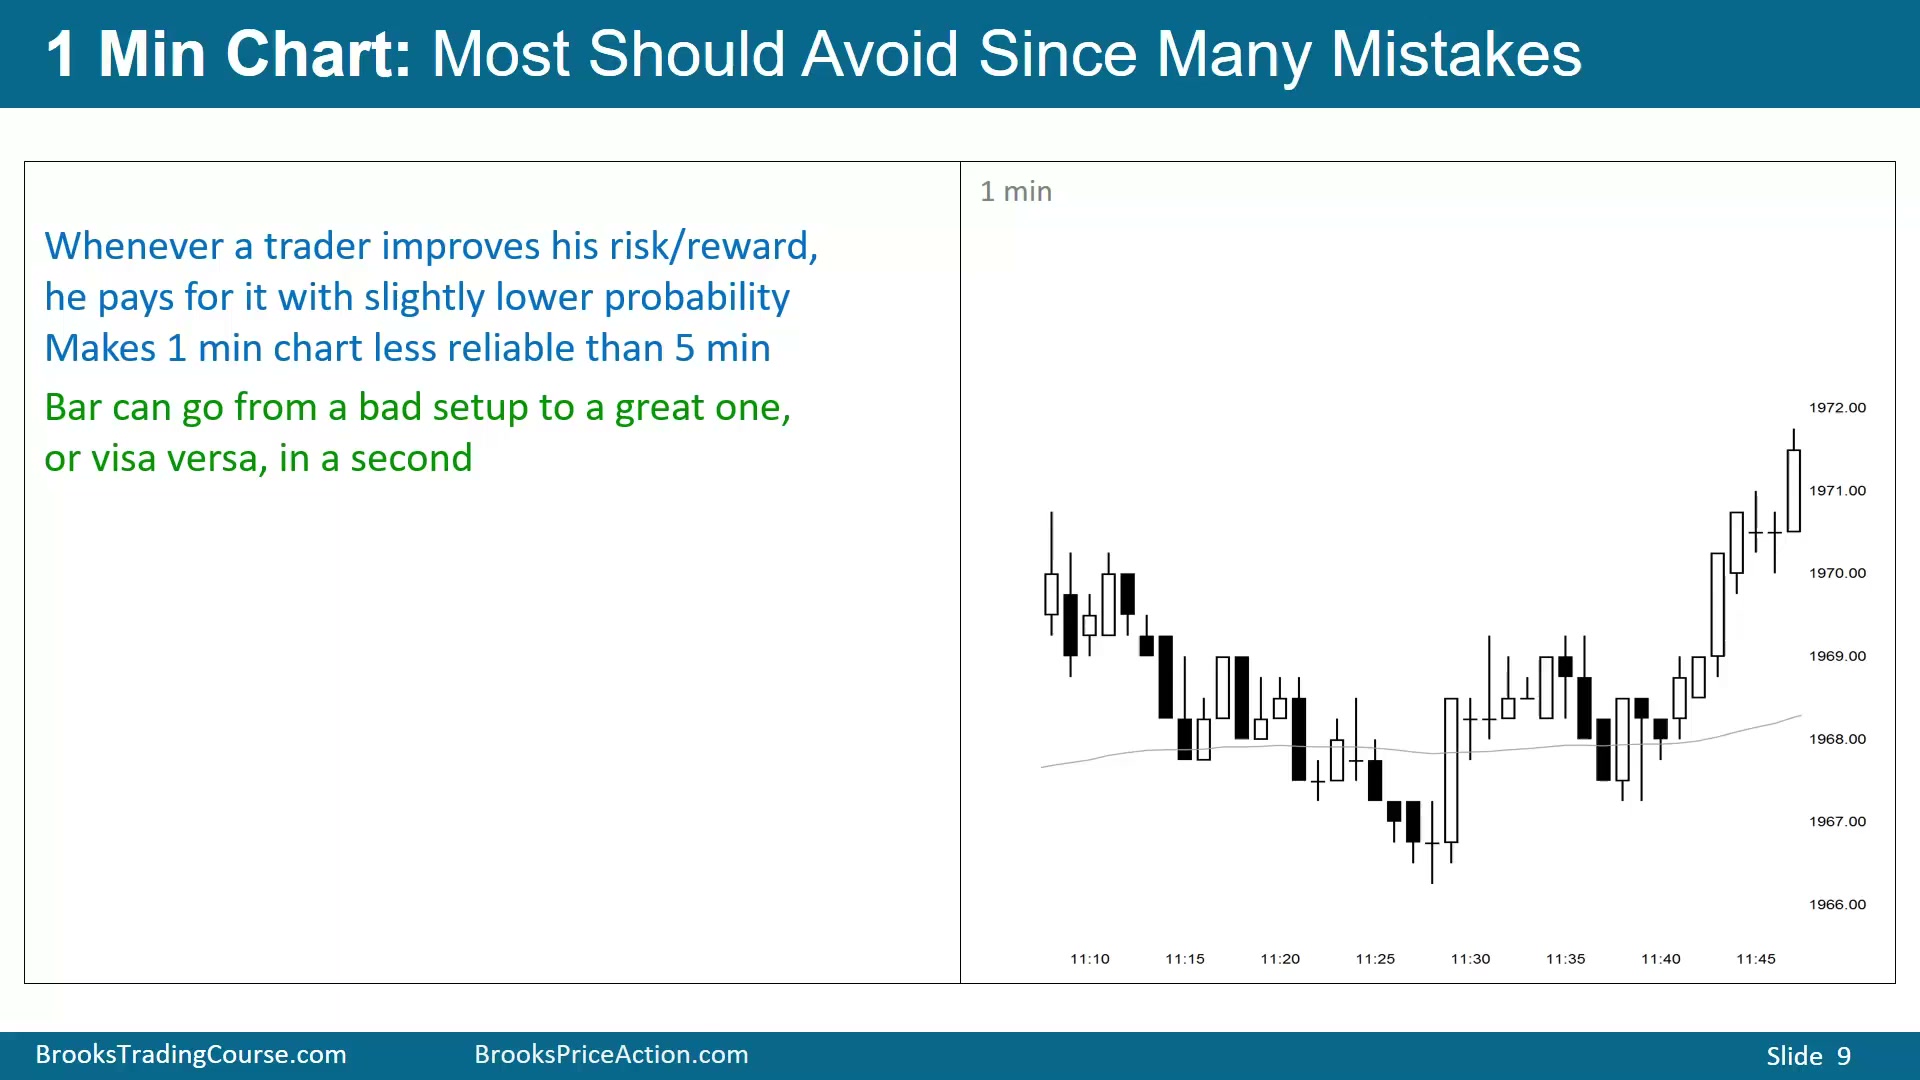
图中把 5 分钟图的一段蓝色区域展开成 1 分钟图。5 分钟图上,市场出现两段下跌,也可看成三推下跌,约 50% 回调;此前是 spike、pullback、channel,回调到略高的 Higher Low 和均线附近,并出现很好的多头 K 线。用 5 分钟图交易,可以在该 K 线高点上方 1 tick 买入,期待趋势恢复向上。多数交易者会把它看成回调,而不是熊趋势开始;回调意味着预期形成牛旗并恢复上涨。
若交易者切到 1 分钟图,他会看到更细的 spike、pullback、第二推、第三推和反转尝试,可以在 1 分钟反转 K 线上方买入,比 5 分钟入场低约 5 ticks。更高时间级别也类似:有人在 15 分钟或 60 分钟图找支撑阻力,再用 1 分钟或 5 分钟入场。
在 60 分钟图找形态、用 5 分钟图入场是合理的;但在 5 分钟图找形态、再用 1 分钟图入场要困难得多。1 分钟图决策时间太少,容易只盯 1 分钟图而忽略 5 分钟背景。更早入场改善了风险收益,但必须用较低概率作为代价,因为 1 分钟图更不可靠,setup 成功概率也更低。
这个例子的代价也很明确。1 分钟入场比 5 分钟入场低 5 ticks,表面上止损更小;但它依赖更小时间级别上的反转信号,而这些信号更容易失败。交易者改善 risk/reward 的同时降低 probability,这不是免费优势。很多人一旦切到 1 分钟图,就只盯着小图,忘记 5 分钟背景中真正的 setup 是牛旗回调和趋势恢复。
1分钟图的 setup 可能瞬间变坏
Time: 15:55
图中的 1 分钟买入点并不是强买入。它出现在连续 5 根没有多头实体之后,其中 3 根是空头 K 线,2 根收在低位;即使可以叫 Wedge,也不是高概率买入。
1 分钟图还有时间问题。一个看起来很好的 setup 可能在 1 秒内变得很差;一个很差的 setup 也可能在 1 秒内变得很好,交易者来不及反应。即使交易者本身不错,也未必能从更小时间级别获得显著额外收益。
过小时间级别放大执行错误
Time: 16:50
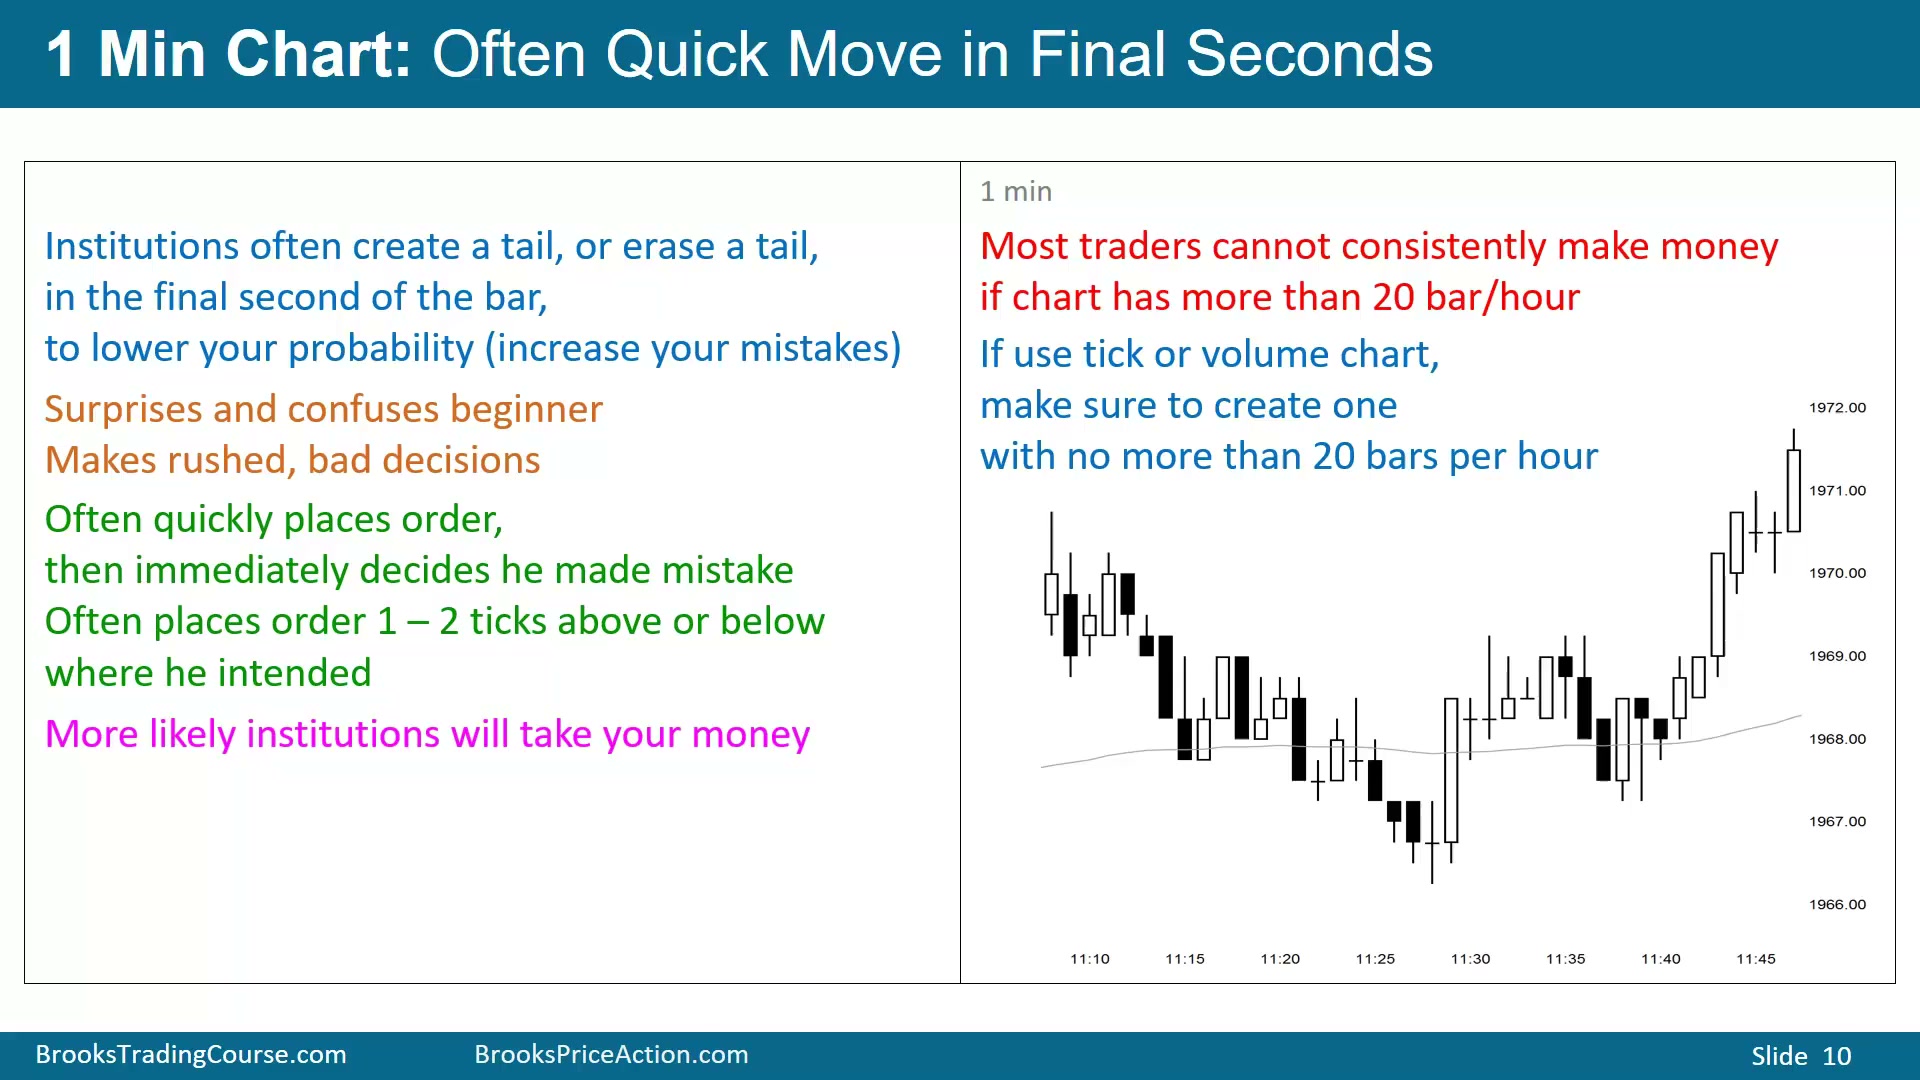
交易者如果在 5 分钟图交易得很好,通常不需要降到 1 分钟或 2 分钟图才能赚更多。1 分钟 K 线最后一两秒,机构可以快速制造影线、反转,或抹掉影线;一根原本可能是带大下影线的小多头实体,最后半秒可能变成收在低位的强空头 K 线。新手很难在一秒内从“准备买”切换到“应该卖”,也很难充分思考后下单。
执行层面也很危险:必须同时下入场单、止损单、bracket order,并确保价格正确。若因为急着进场用 market order,成交比预期差 1 到 2 ticks,原来的目标利润被压缩,风险增加,交易者方程就变差;数学结构一差,机构就会拿走你的钱。
一个实用准则是,不交易每小时超过 20 根 K 线的图。时间图上,这相当于 3 分钟图;低于 3 分钟多数交易者不该做。tick chart 或 volume chart 也同理:如果每小时 K 线数超过 20,就太快。Emini 开盘初期,5000 tick 一根可能产生每小时 30 到 40 根 K 线,太多;晚些时候同样 5000 tick 可能每小时只有 10 根。tick/volume 图的 K 线持续时间变化太大,有时几秒,有时 10 到 15 分钟;固定时间图的优势是交易者知道 K 线何时收盘。
tick chart 和 volume chart 的问题同样来自节奏不稳定。开盘活跃时,一根 5000 tick bar 可能几秒就结束,每小时 30 到 40 根;午后同样设置可能每小时只有 10 根。交易者如果依赖 K 线收盘做决策,却不知道 K 线何时收盘,就更难准备订单和管理。时间图至少让交易者知道 5 分钟 K 线何时结束,这对下单、止损和 bracket order 的执行很重要。
因此,小时间级别并不是更精确的免费工具。它给了更低入场价,也给了更多最后一秒变化、滑点、误按市价单和 bracket order 放错位置的机会。
1分钟图让新手在趋势中也亏钱
Time: 20:50
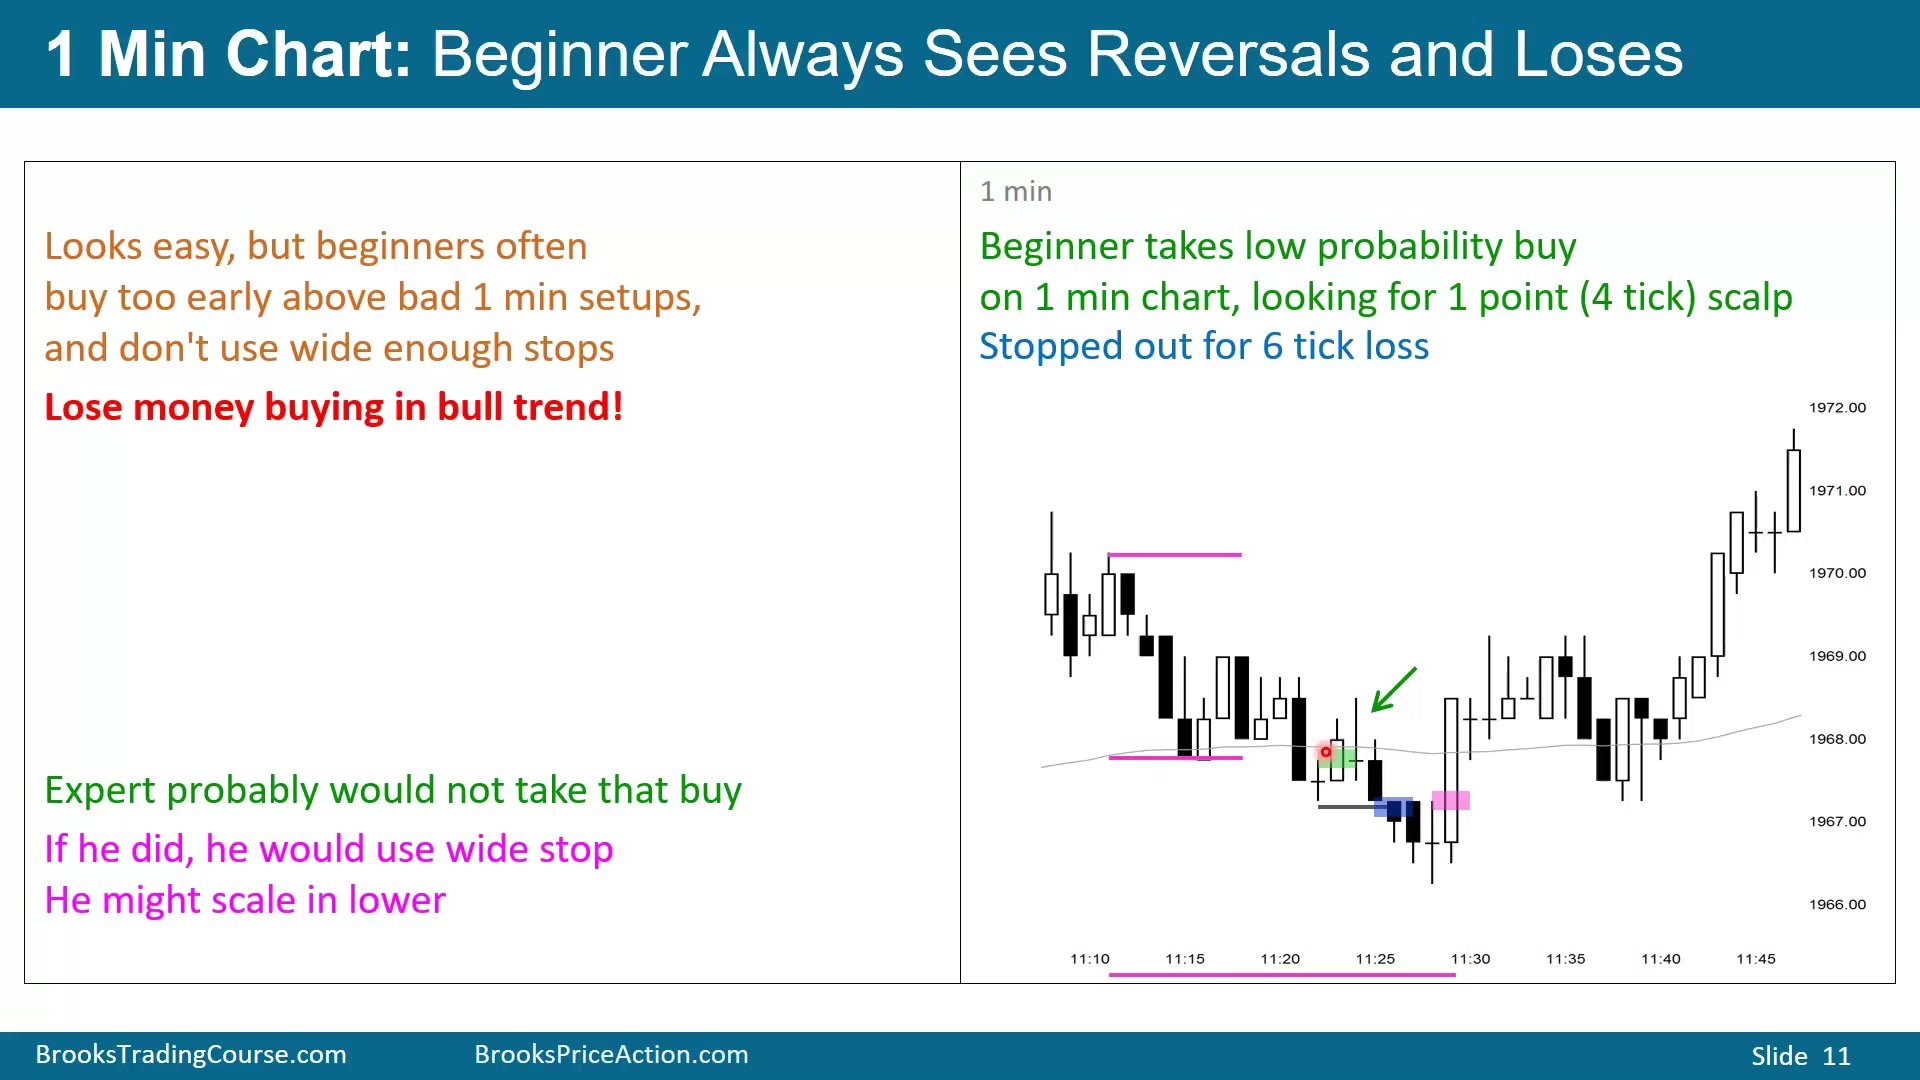
1 分钟图看起来容易,但交易者经常过早买入坏信号。例如看到 High 2、Wedge、三推、ii 或 Triangle Final Flag,就急着买,结果止损太紧,在市场真正向上前被扫出。很多 setup 本身不够好,决策时间又短,交易者容易不用足够宽的止损,先亏损出场,之后市场才按原方向运行。
这种问题会让人在牛趋势中买入仍亏钱,也会让人在熊趋势中做空仍亏钱。例如牛趋势里买入后,连续三根空头 K 线收在低位,交易者可能被迫退出,但最后市场仍是牛趋势;熊趋势里卖 Low 2 后被反转扫出,结果市场仍可能继续下跌。
专家如果在 1 分钟图寻找早入场,也会等待更好的多头 K 线、强多头收盘或强多头后的跟进,而不是随便买。若他确实买入,通常会使用 4、5 点甚至 6 点止损,视当天区间大小而定,并愿意更低加仓。若 5 分钟背景显示这是可能的牛旗,那么 1 分钟图上的空头腿只是牛旗内部的一段,交易者必须愿意用宽止损,例如放在合理的 measured move 下方。
图中做多失败的例子还说明,问题不在于方向判断一定错,而在于止损和加仓计划太小。1 分钟图上买 High 2 或 Wedge 后,被信号 K 线下方扫出,市场随后上涨;如果使用 5 分钟背景判断这是牛旗,专家可能不会在信号 K 线下方止损,而是在低点或 measured move 下方放 3 到 6 点止损,并准备更低加仓。新手通常既没有时间做这个判断,也没有计划管理这种宽止损。
空头例子同理:在熊趋势中卖 Low 2 后遇到反弹,新手可能在入场价上方退出,随后市场继续下跌。方向正确但管理错误,仍然会亏钱。
两时间级别入场只是偶尔工具
Time: 24:35
本课强调,新手应避免 scalping,因为它太容易亏。新手只看风险,忽略概率和收益;但每笔交易都必须同时考虑风险收益和概率。只看一个变量,最终会亏钱。
双时间级别入场听起来合理,例如 5 分钟图交易、1 分钟图寻找更早入场,但多数交易者很少真正因此显著提高盈利。一个优秀多头 scalper 一天做 10 到 15 笔交易,也许只会有一次降到小时间级别;其他时候仍主要依赖 5 分钟图。偶尔看 2 分钟或 3 分钟图可以,但多数交易应建立在 5 分钟图上。