al-brooks-course
06 - 3 Patterns Every Trader and Investor Should Know
Readable self-study lecture notes for 06 - 3 Patterns Every Trader and Investor Should Know.
Source Media
Official course video
06 - 3 Patterns Every Trader and Investor Should Know
Open on Brooks Trading Course三个最基本的价格行为形态
Time: 00:13
价格行为可以先理解为图表上看到的任何价格移动。本课围绕三类每个交易者和投资者都应该熟悉的形态:强多头趋势、多头趋势中的回调,以及 Wedge reversal,包括 Wedge Bottom 和 Wedge Top。最后还会保留两个 Brooks 网站的来源信息。
价格行为是买卖双方交易记录
Time: 00:46
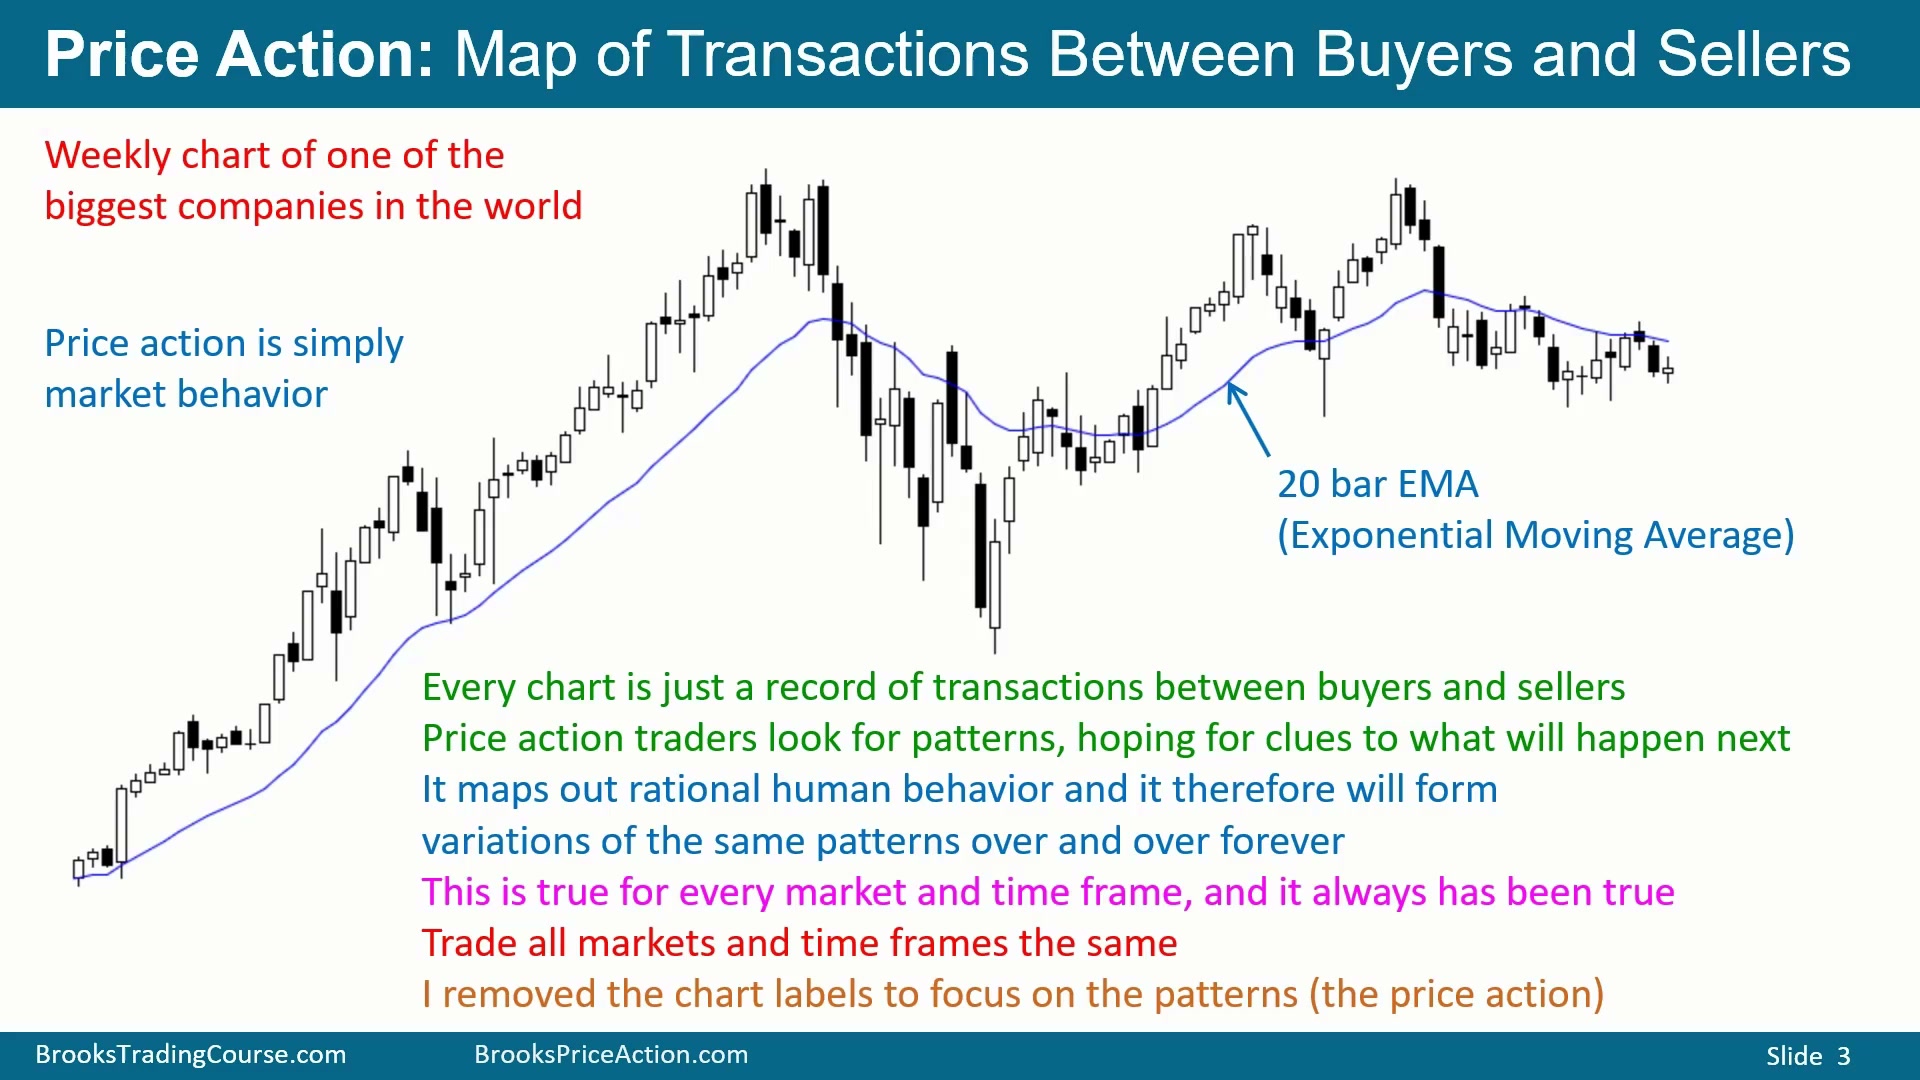
图中是一家大型公司的周线图,蓝线是 20-bar EMA。价格轴和时间轴被移除,是为了让注意力只放在价格行为本身,而不被标的名称、日期或价格数值干扰。
价格行为就是市场行为。每张图表都是买方和卖方交易的记录,price action trader 寻找的是重复出现的形态,并从中寻找下一步可能发生什么的线索。它可以看成理性人类行为的地图。经验丰富的交易者会看到同一类形态以不同变体反复出现。
这种重复性适用于所有市场和所有时间周期,也一直如此。即使把 100 多年前的图表去掉时间和价格标签,也很难只凭形态判断它是今天的图,还是百年前的图;也很难判断它是 Apple、黄金还是原油。重点是,成熟交易者会用同样的价格行为原则交易不同市场和不同周期。
所有市场和周期背后都是理性行为
Time: 02:25
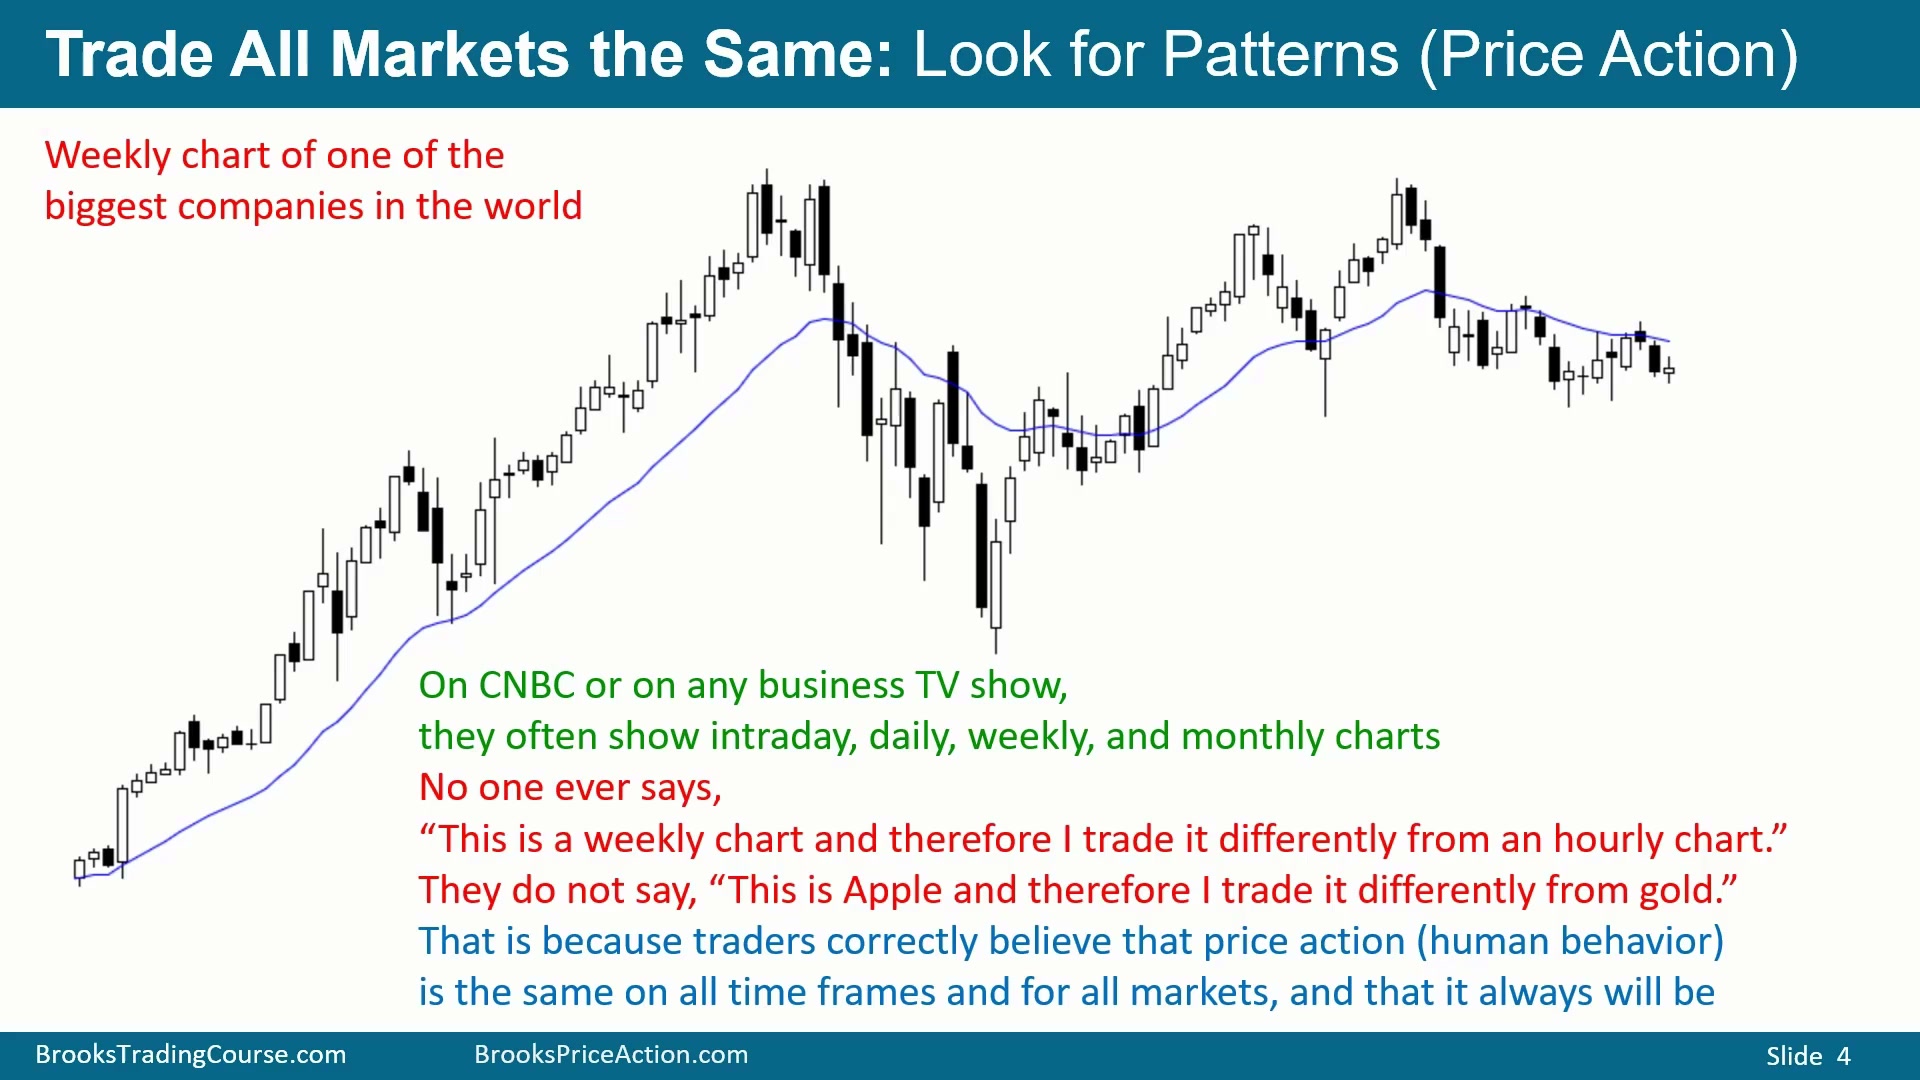
财经节目会展示不同市场、不同周期的图表,可能是小时图,也可能是月线图。专业交易者不会因为它是周线图就采用完全不同于小时图的交易方法,也不会因为它是 Apple 就与黄金或原油完全区别对待。
原因是价格行为反映的是理性交易行为。市场、周期和标的会改变外观细节,但不会改变买卖双方在不确定性、风险、获利和亏损面前的基本行为。计算机会改变速度,却不会改变原则。算法有时看似非理性,但它们仍在执行符合交易目标的理性交易。
强趋势、回调和 Wedge 是三类高频形态
Time: 03:30
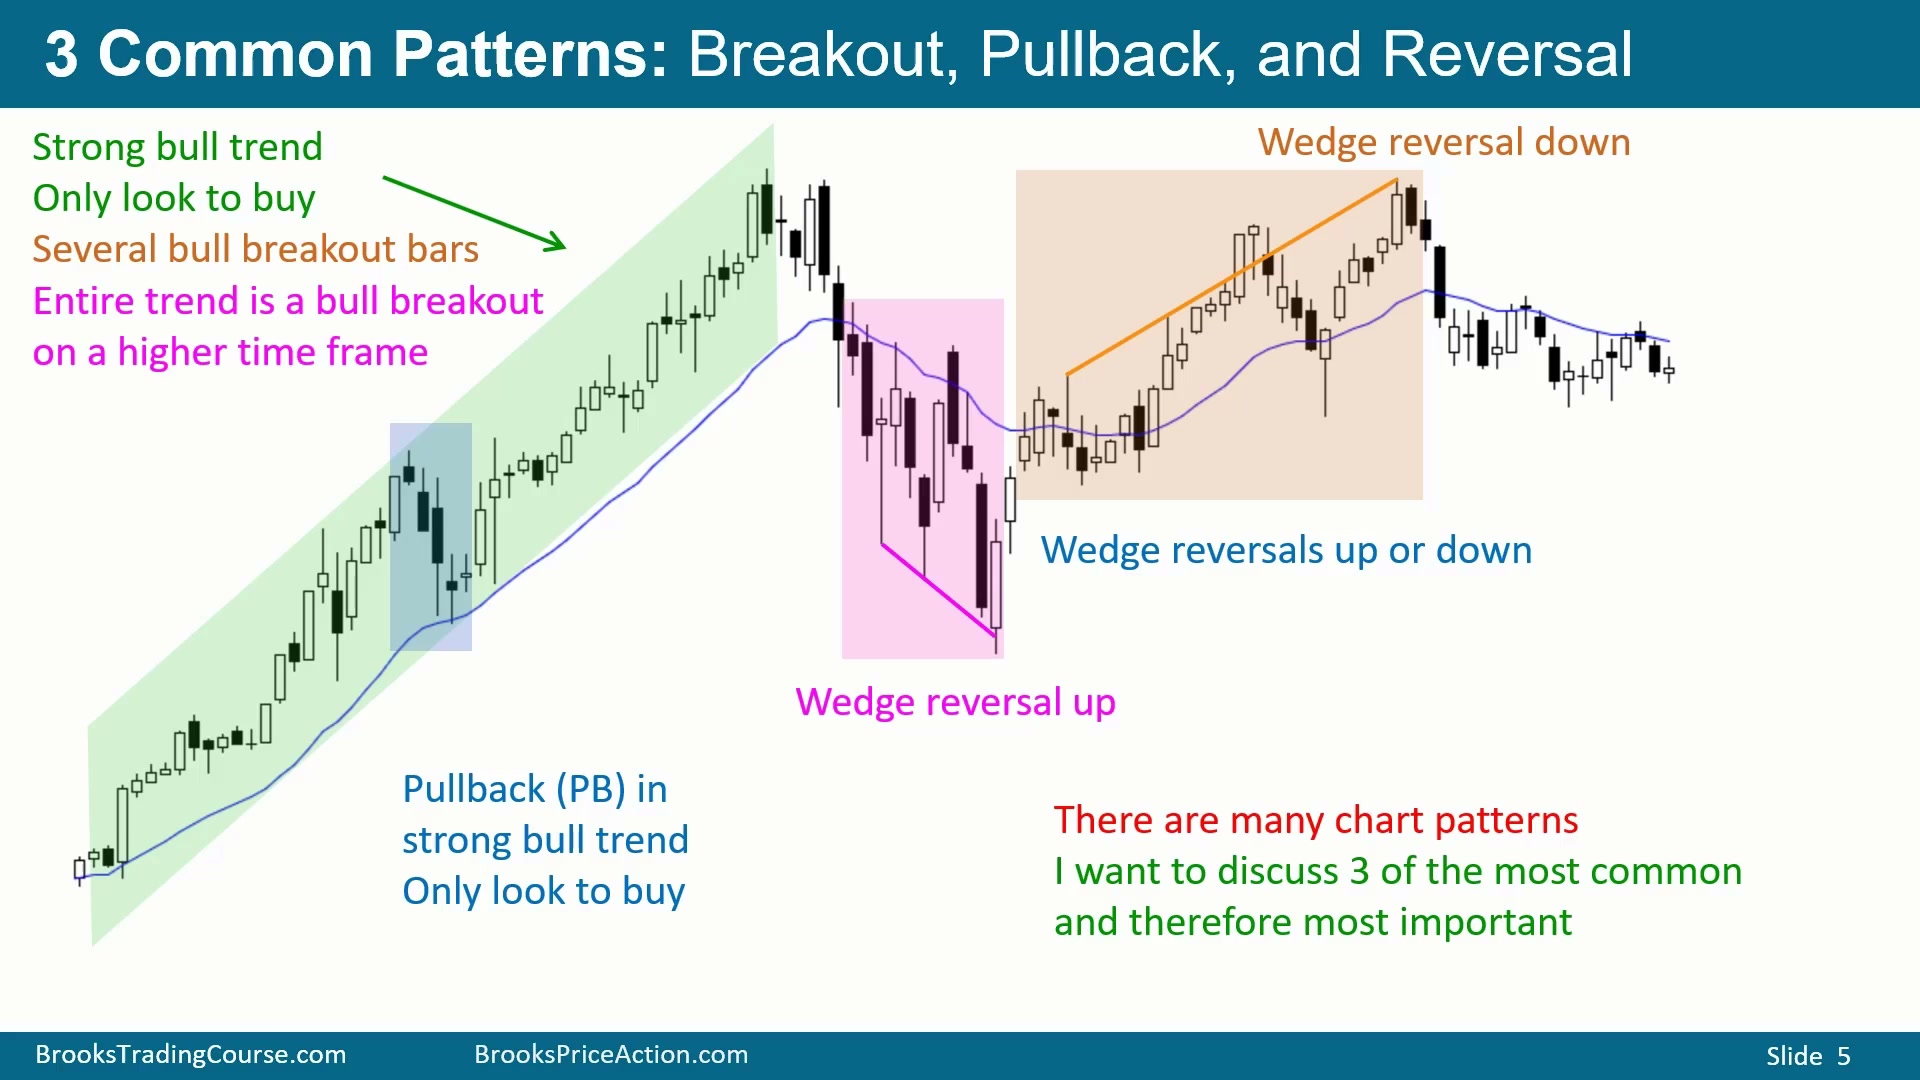
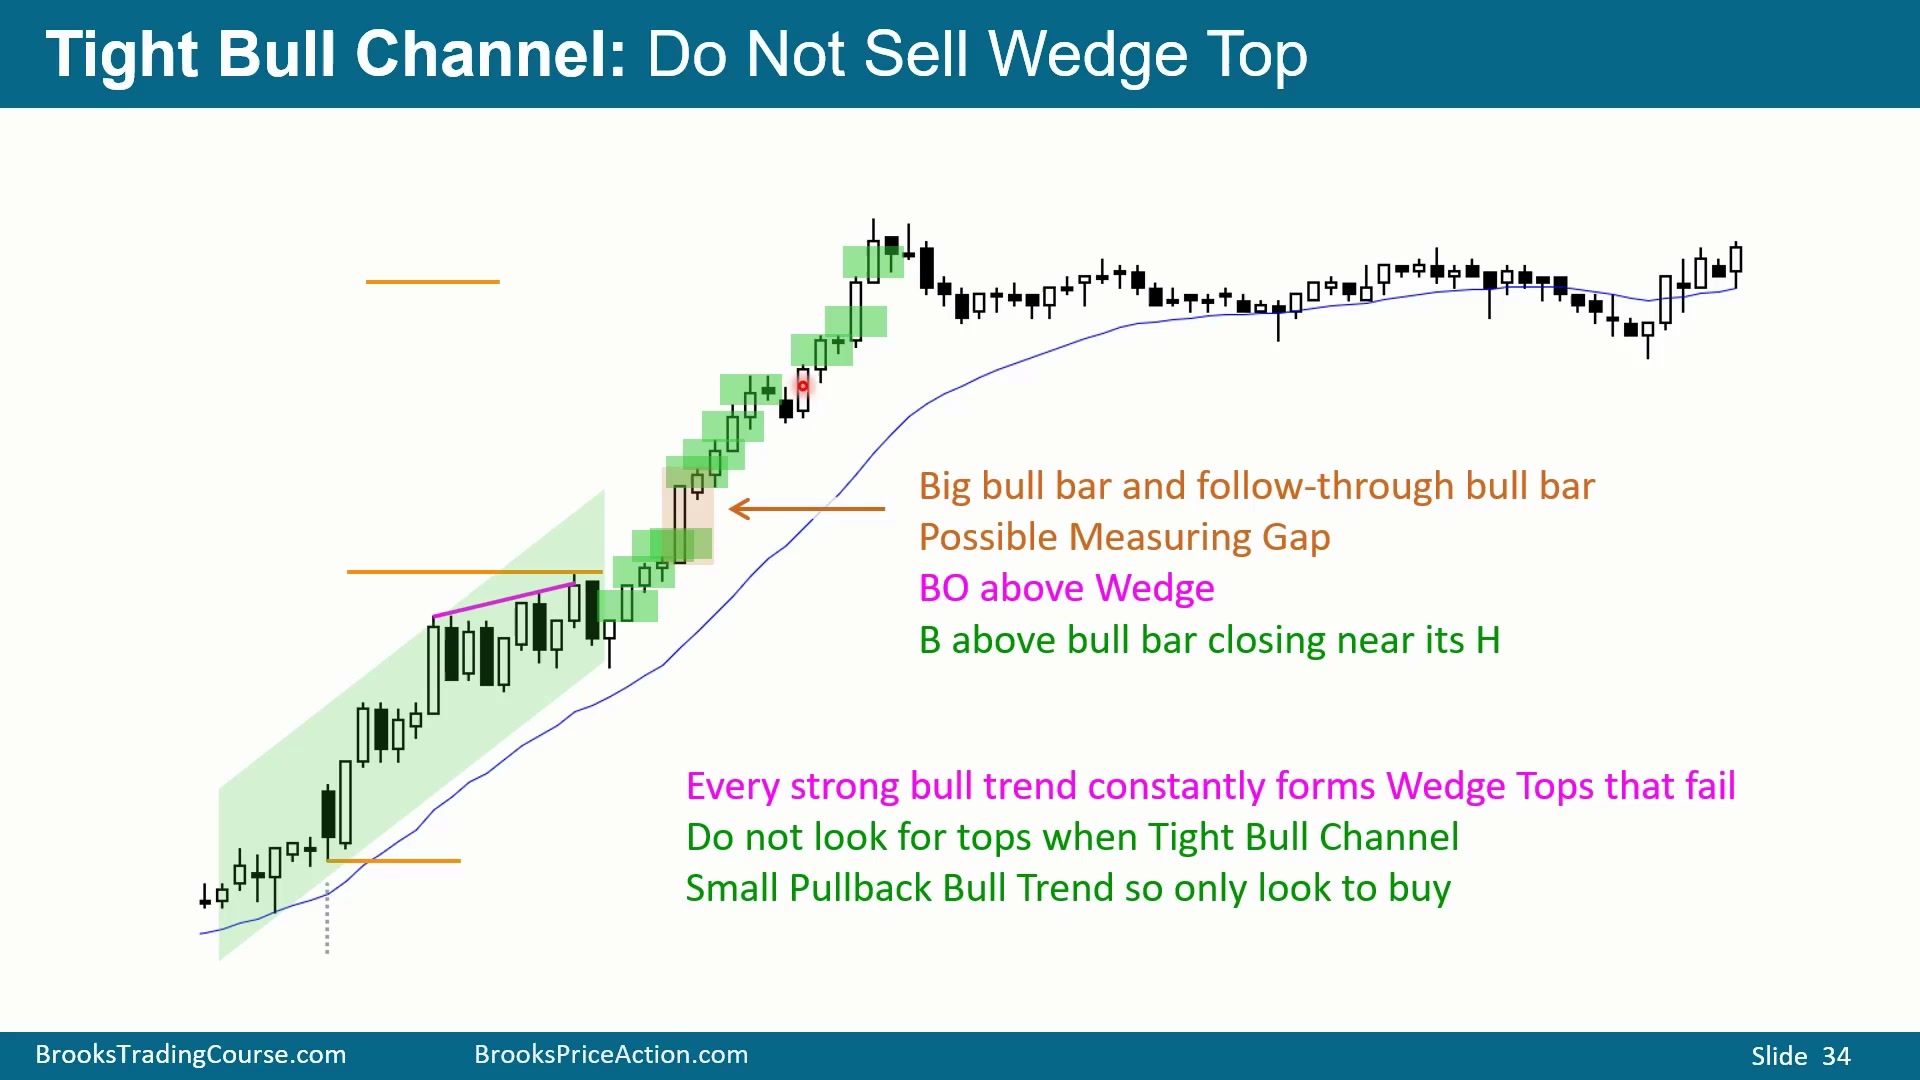
图中从左下到右上,显然是多头趋势。当多头趋势很强,也就是 Tight Channel、回调小而短时,交易者只应该找买入。图中多根 K 线收在高位,并收在前高之上,这些都是 breakout bars。若切到更高时间周期,它会表现为一串大的多头趋势 K 线,没有明显阴线和回调,因此本质是高一级周期上的突破。即使当前图上能看到反转尝试和阴线,也应只找买入。
第二类形态是多头趋势中的回调。图中某根 K 线跌破前一根低点,就构成趋势中的回调;在强多头背景中,仍应主要买回调。
第三类是 Wedge。图中三段下跌后向上反转,是多头趋势中的 Wedge bull flag 或 Wedge Bottom;另一处三段上涨后向下反转,同时接近 Double Top,是 Wedge Top。Wedge 可以提供反转交易,也可以只是趋势中的旗形,必须结合背景判断。
Small Pullback Bull Trend 中只找买入
Time: 05:07
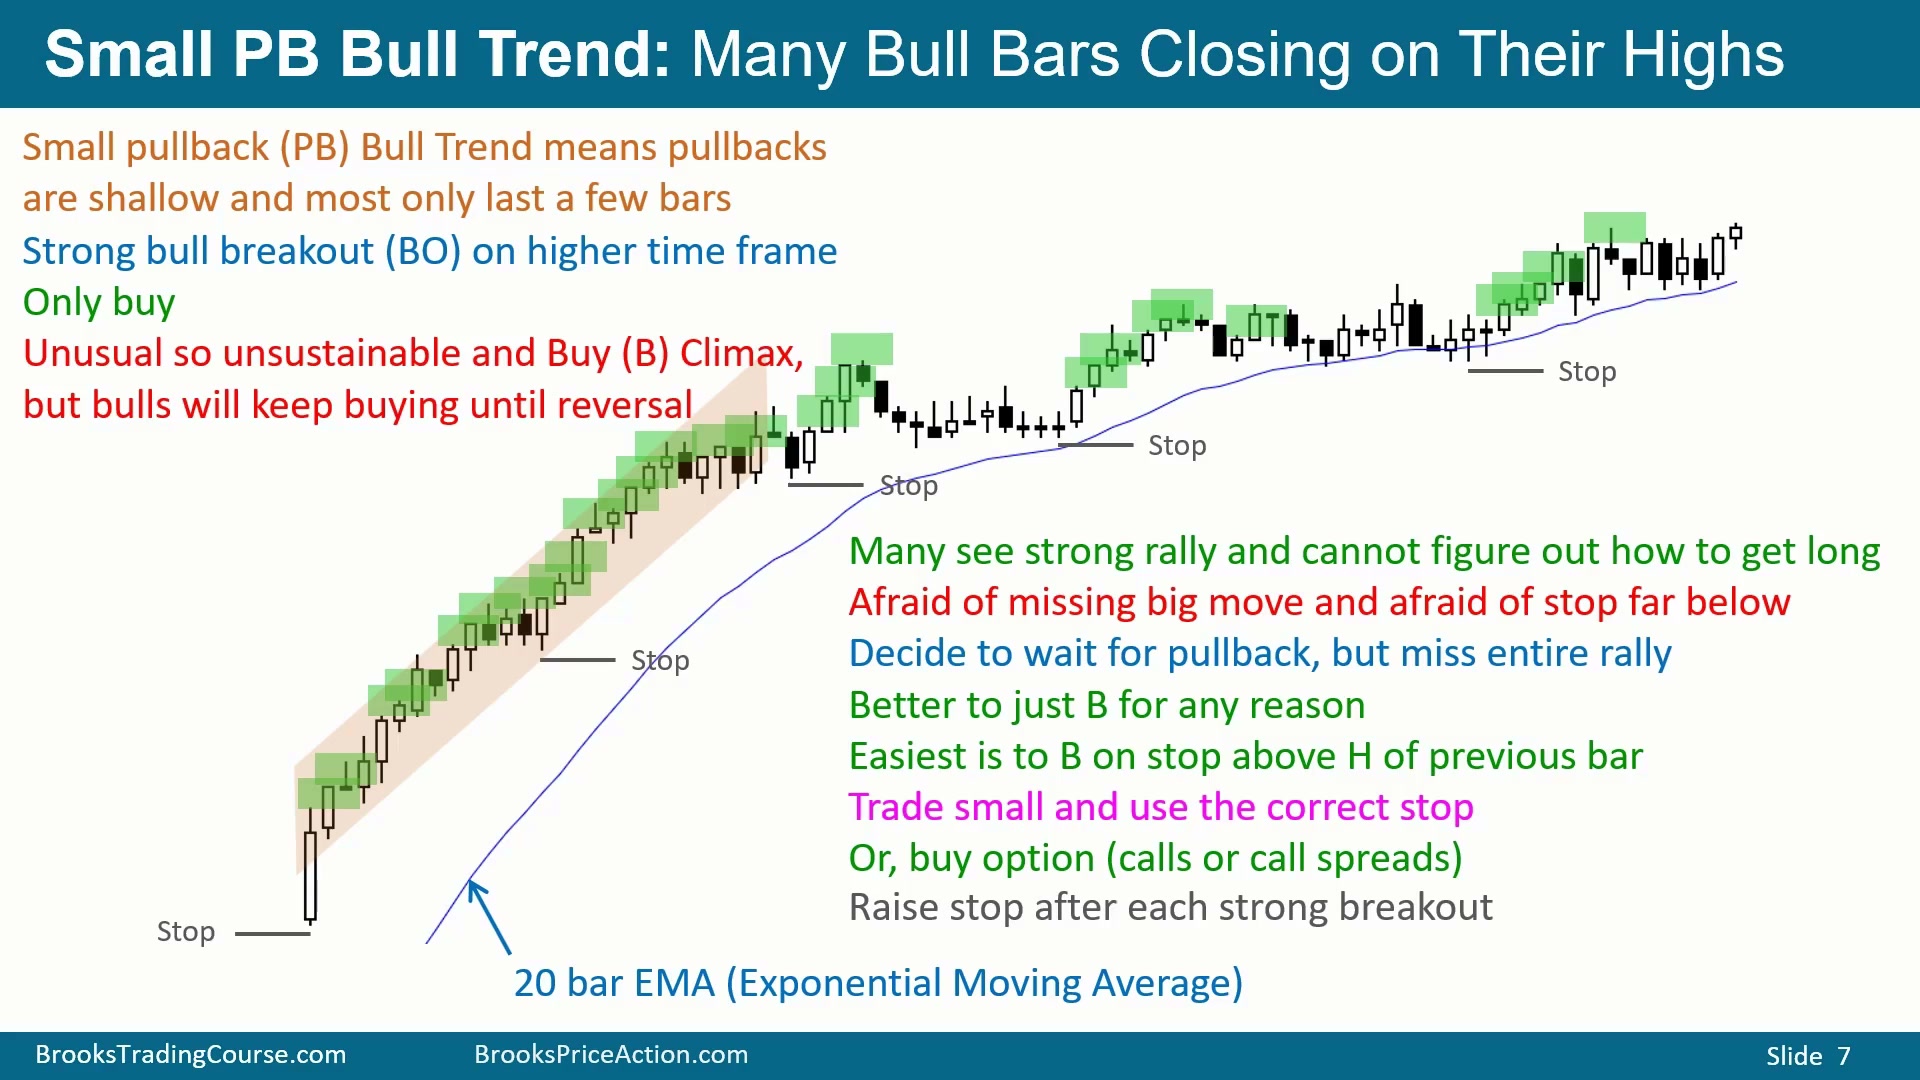
图中蓝线仍是 20-bar EMA。这个走势是极强的多头趋势:只有一根 K 线回调,或横向走几根,但真正下跌很小。它属于 Small Pullback Bull Trend,是最强的多头趋势类型之一。回调小而短,整个走势很不寻常,因此也是 Buy Climax;但 Buy Climax 可以持续很久,图中几乎整天都是买入高潮,所以不能因为它是 climax 就做空。
如果这是 5 分钟图,高一级 15 分钟图、30 分钟图或小时图会像一串连续阳线,几乎没有回调。只要高一级周期没有回调,当前周期就应只找买入。
最简单的买法,是找收在高位或接近高位的多头 K 线,在它的高点上方用 stop 买入。初始保护止损放在走势底部。很多交易者看到趋势已经涨了很远,会想等回调再买,但 Small Pullback Bull Trend 经常不给深回调;等待回调会错过大部分趋势,最后只能在更高处买。
正确处理方式是先看止损应该在哪里,再决定仓位大小。仓位必须小到即使保护止损很远,单笔风险仍不超过其他交易。日线或周线上的强趋势,也可以用买 call 或 call spread 的方式表达多头观点。
止损管理和入场价无关,而取决于市场已经做了什么。每出现一段新的强上涨,就把止损提高到最近强上涨腿的底部下方。无论最初在哪里买,只要市场已经在更高位置形成新的强上涨腿,止损就跟随到最近突破腿的底部下方。早期买入者即使最后被新止损打出,也会保留很大盈利。
强趋势常看起来要失败,但 gap 说明多头急于买入
Time: 08:30
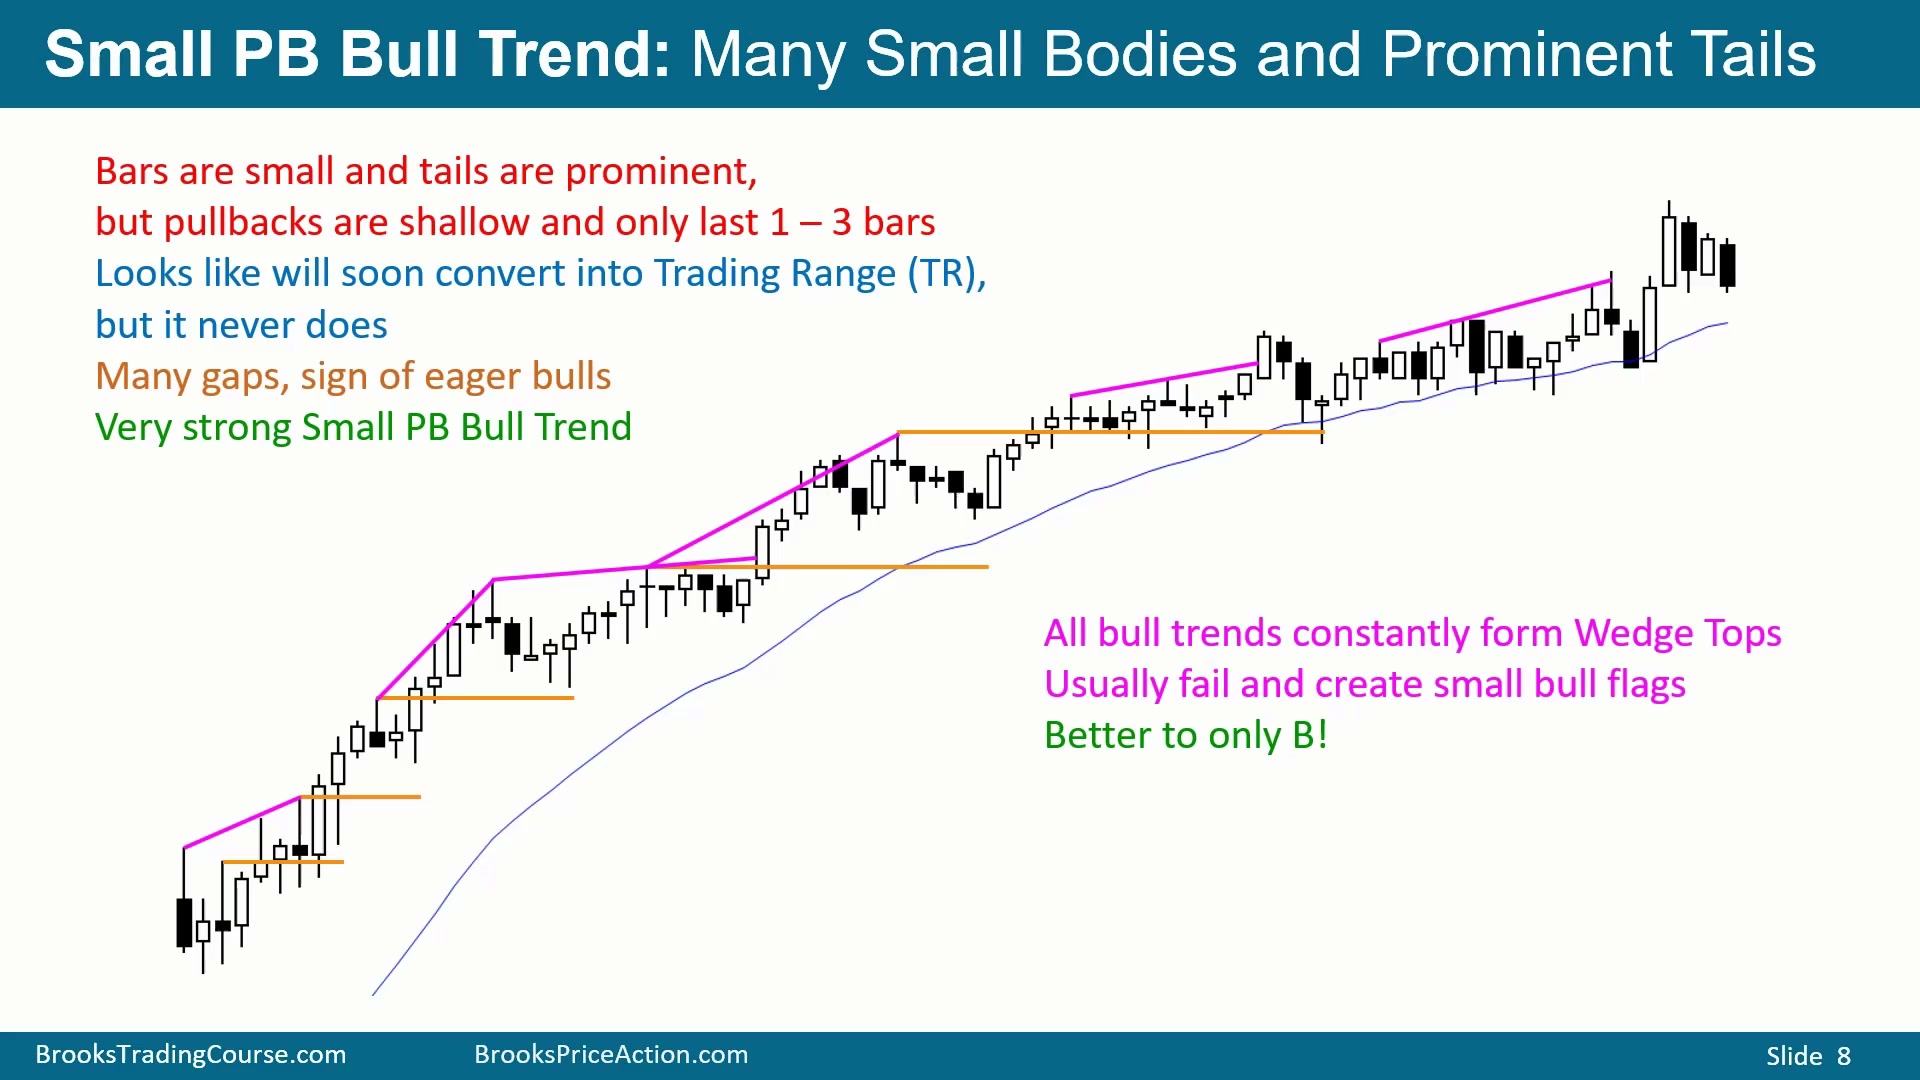
图中的强多头趋势并不总是好看。它有很多阴线实体、很多明显影线,看起来总像要进入 Trading Range 或反转。但回调仍然很小:一根、两根、两三根、四根,或只是横向停顿;下跌都不深。因此它在高一级时间周期上仍会是强突破,当前周期仍只应买入。
图中多次回调守在突破点上方。某处多头 K 线收在高位并收在前高上方,构成突破;随后回调没有跌回该突破点下方。另一处连续突破后尝试向下反转,也没能跌破突破点。这样的 open gap 是强势证据。
有时影线会短暂跌破突破点,但 K 线实体没有重叠,这就是 Body Gap。如果把图改成 line chart,只看收盘价,仍会看到实际缺口,因为 line chart 忽略影线。Body Gap 说明多头急于买入,不期待价格跌回上一个突破点下方。
强多头趋势会不断形成顶部,最常见的是 Wedge Tops,而且有很多画法。但只要判断它是 Small Pullback Bull Trend,就应忽略这些 Wedge Tops,假设它们会失败并变成 bull flag,随后趋势恢复。强趋势中不要因为看到 Wedge Top 就逆势卖空。
强趋势里可以用多种理由买,但目标是持有
Time: 10:45
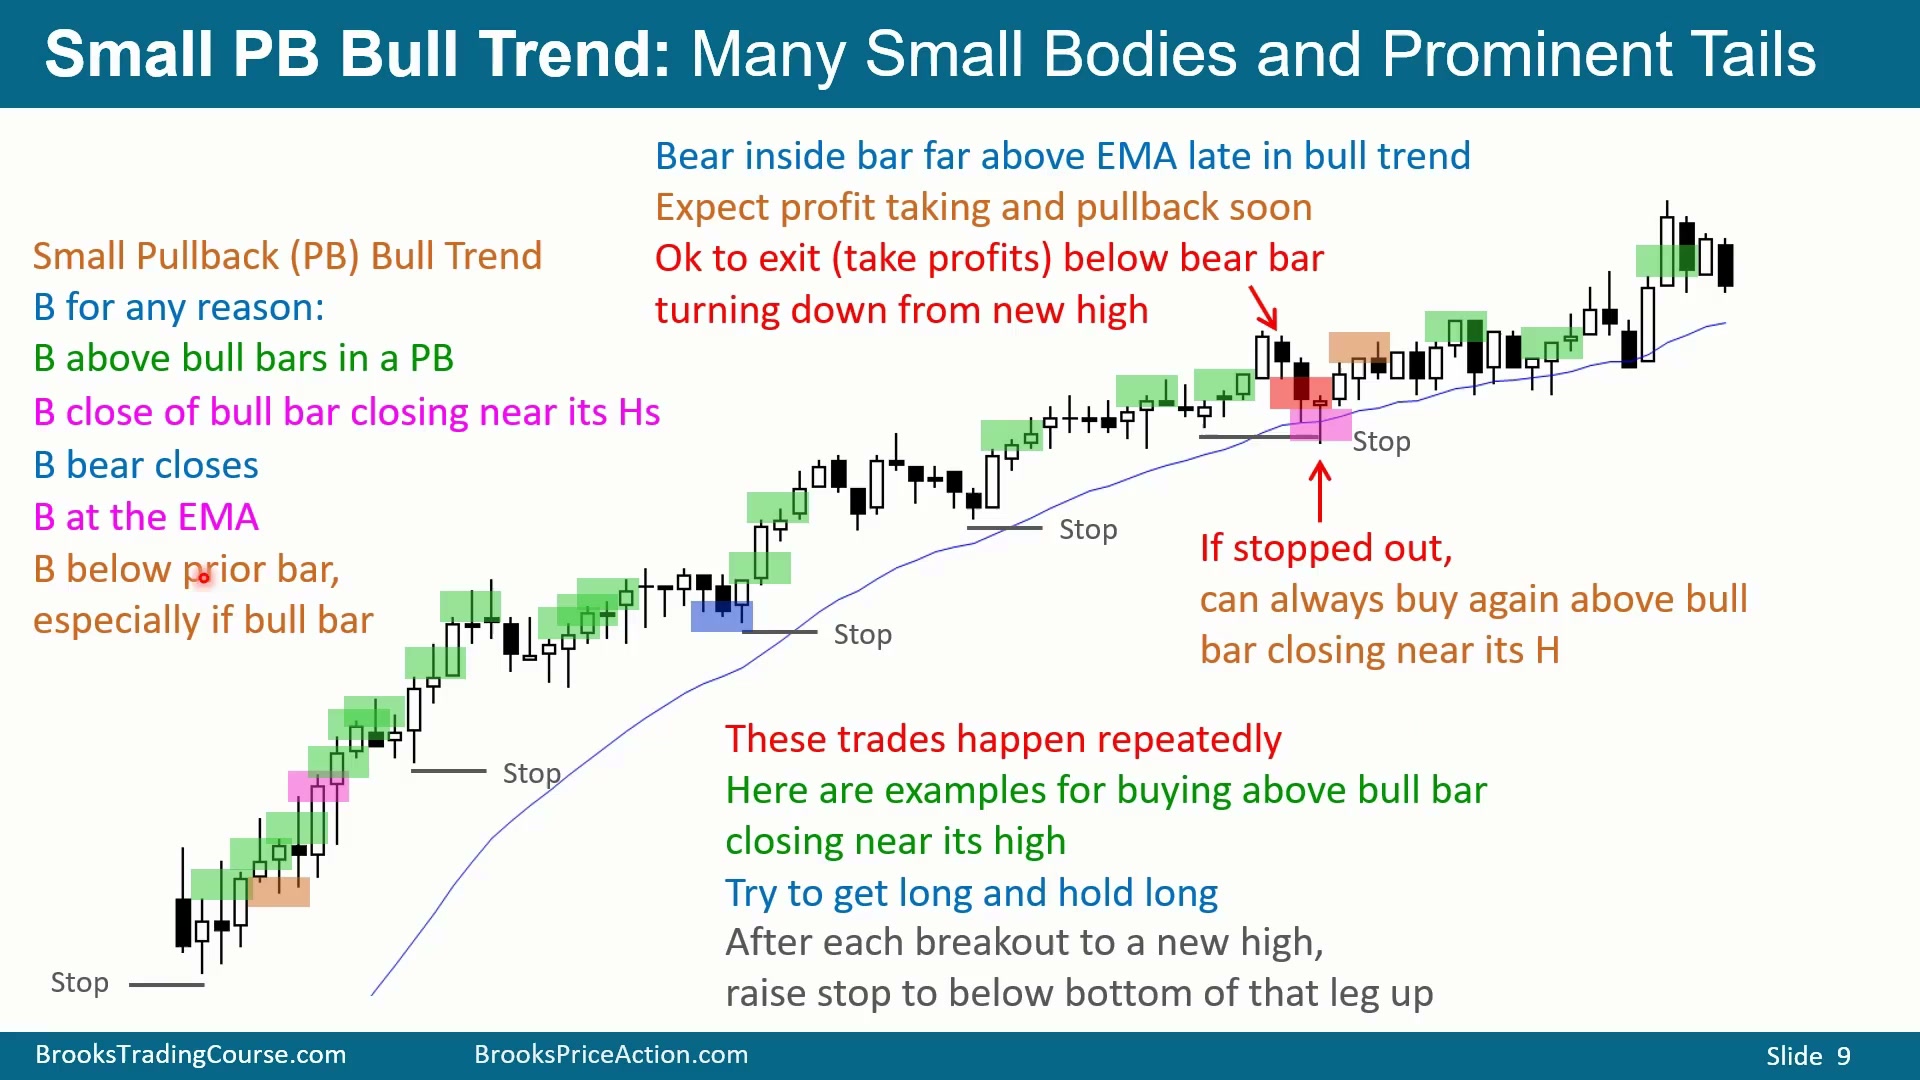
Small Pullback Bull Trend 中可以“为任何理由买”。最简单的是找收在高位的多头 K 线,在其高点上方 stop 买入。图中一路都有类似多头 K 线,不必每个都买,但必须至少买入并尽量持有。
scalper 可以反复买、获利、再买、再获利;但多数交易者常在前一两次买点后不再进场,从而错过整段趋势。确认可能是 Small Pullback Bull Trend 后,核心是买入并依赖止损持有。若日内交易者总是太早 scalp 出场,实际做法可以是设好止损后离开屏幕一段时间,因为你已经知道止损该放在哪里。
除了买前一根高点上方,还可以买任何收在高位的大阳线收盘。可以在收盘时直接市价买,也可以在下一根用限价单买该收盘价;但强趋势中更稳妥的是市价买,因为价格可能不回到限价单。
强多头趋势中,每次反转尝试大概率失败,因此也可以买收在低位的阴线收盘。市场已经连续 30、40、50 根 K 线在平均价格上方,说明多头愿意支付高于平均价的价格;当价格终于回到均线或平均价附近,多头会买。因此可以在均线处挂限价买入,也可以触及均线时市价买。
另一种买法是在每根 K 线低点挂限价单,押注反转会很小、只是小回调。多头 K 线低点尤其适合,阴线也可以,特别是 doji 这类差的 sell signal bar。思路始终是拿到多头仓位并持有,直到出现逻辑上的出场理由。每次新突破后,止损都提高到最近突破腿底部下方。趋势后期常有获利了结,想离场可以,但多数情况下它仍是 Small Pullback Bull Trend,回调不会太深;离场后仍可以在下一根收高位的多头 K 线高点上方重新买入。
这些买法背后的逻辑不同,但结论相同。买强阳线收盘,是承认趋势正在加速;买阴线收盘,是押注反转尝试会失败;买均线,是利用多头长期愿意支付高于平均价的事实;买 K 线低点,是押注回调只会小而短。强趋势中不要把每个买点都当成 scalp 处理,否则很容易拿到一点利润就离场,随后看着市场继续上涨。
强上涨后的第一次回调是 High 1
Time: 15:06
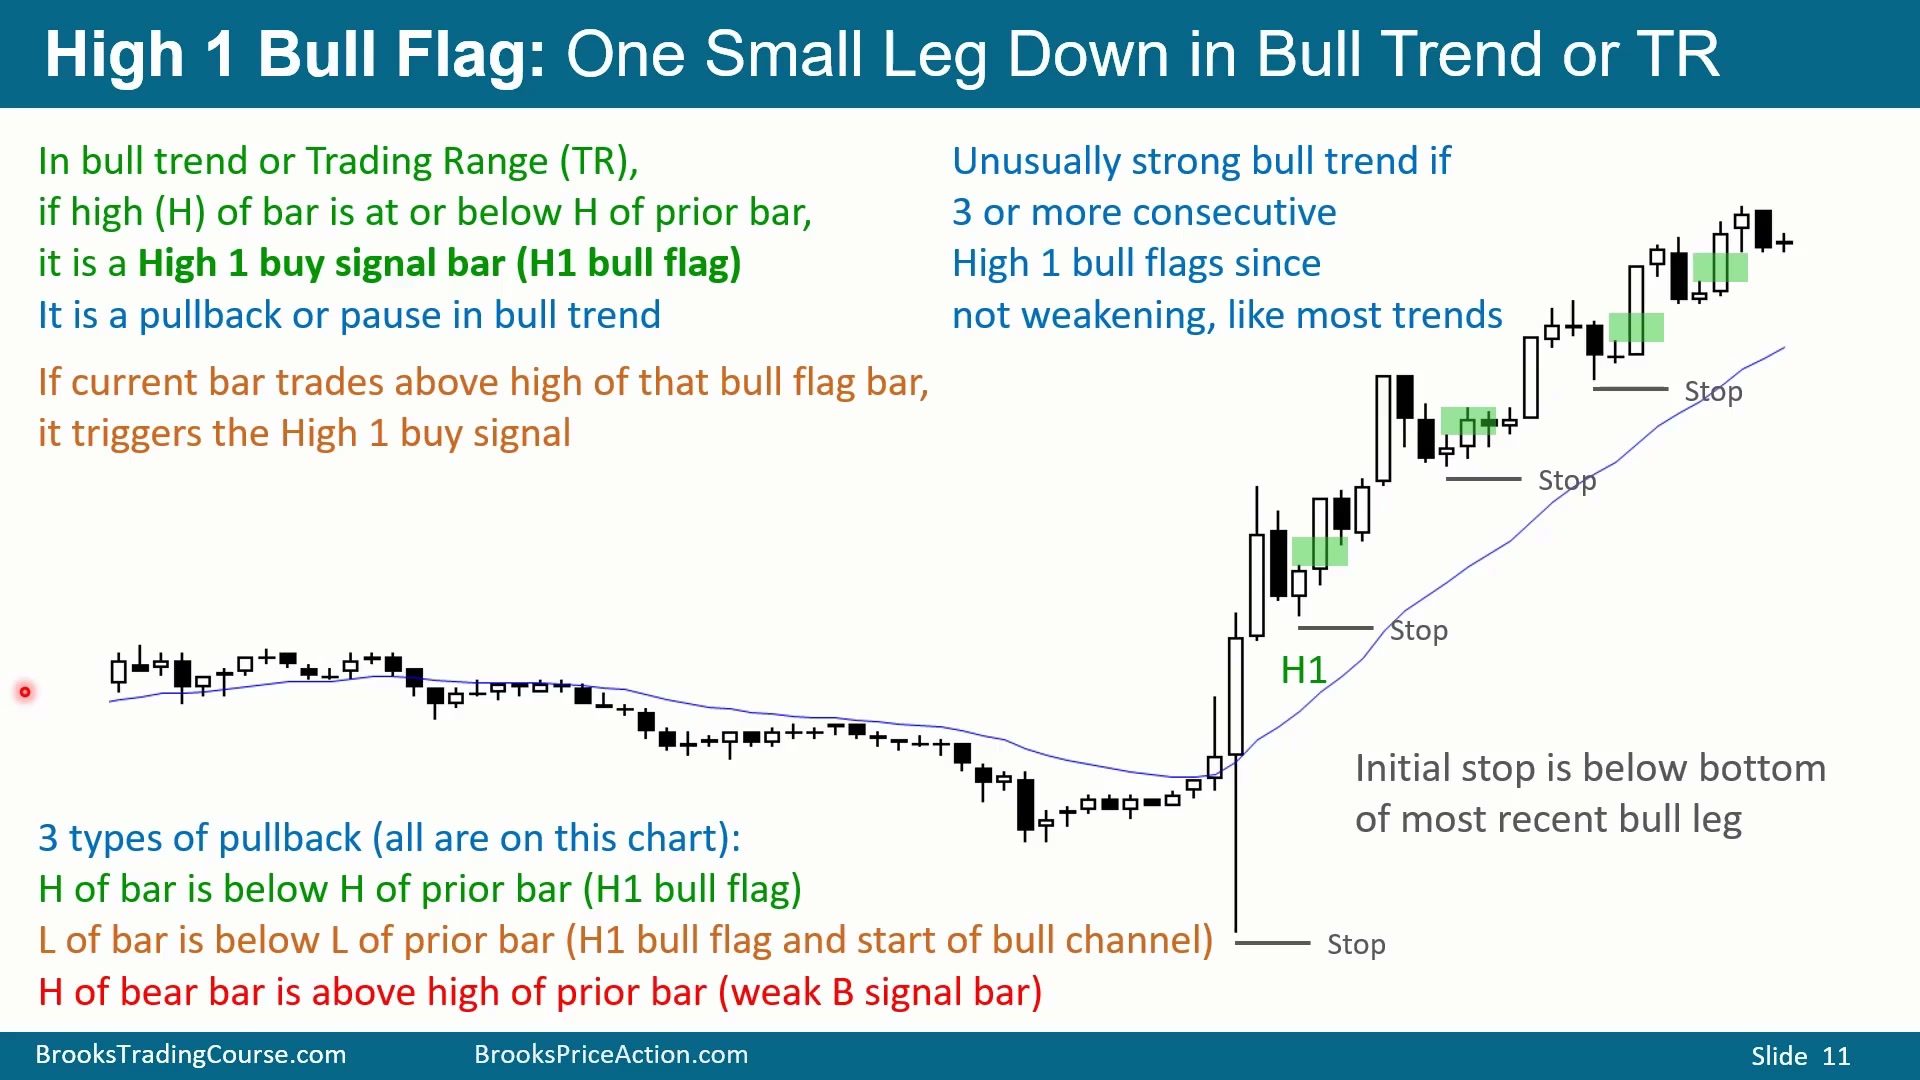
图中先横向漂移,随后出现巨大的多头 surprise bar 和 follow-through,说明市场已经进入强多头趋势。趋势中第一次出现某根 K 线低点低于前一根低点,就形成回调;交易者会押注多头趋势恢复。
一种进场方式是在这根回调 K 线高点上方 1 tick 挂 buy stop。这是 High 1,即第一次恢复上涨的尝试。有时之后会出现 Lower High 和第二次向上尝试,那就是 High 2;有时三段下跌后恢复上涨,可以叫 High 3 或 Wedge bull flag;如果横向收敛,也可能是 Triangle。只要第一次回调向上恢复,它就是 High 1 buy signal。
这类强趋势的止损可能很远,通常要放在前面上涨腿底部。账户太小无法承受这个风险,就不应交易;可以改用 Micro Emini,或股票从 1000 股降到 100 股、10 股,外汇也可以调整任意仓位。每次创出新高突破后,止损都提高到最近上涨腿底部下方。连续三个或更多 High 1 bull flags 很少见,说明趋势极强。
High 1、High 2 的标签不如趋势背景重要
Time: 17:00
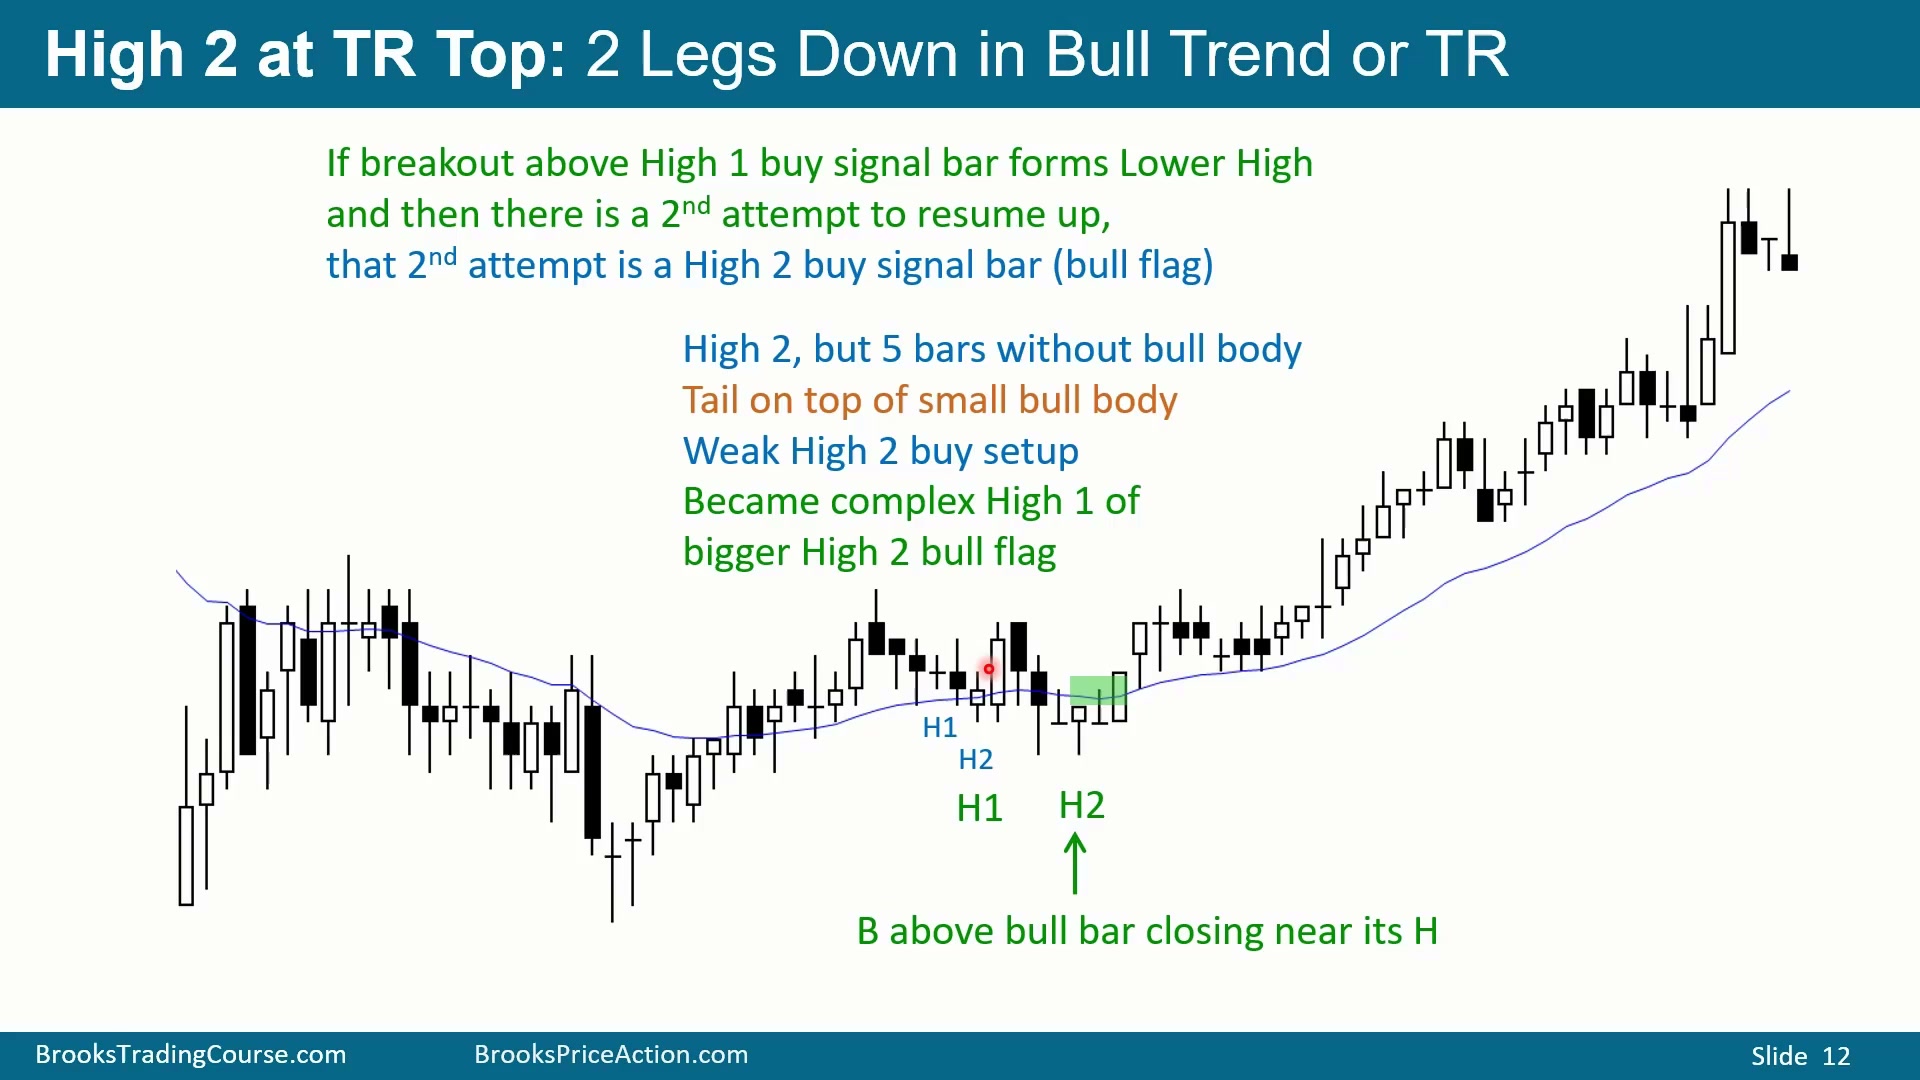
图中这段上涨既是 Trading Range 中的一条多头腿,也是 Small Pullback Bull Trend。第一次向上反转触发 High 1 买点,但前面有三根阴线和一根 doji,这个买点概率低,不适合主动买。随后熊腿继续向下,第二次向上反转形成 High 2,胜率更高。
第三次向下反转可以叫 High 3,但更实用的看法是“大型复杂回调”。前面较大的 High 1 可以细分成两段,随后还有一个更大的 High 2。标签本身并不重要,重要的是市场仍是多头趋势,应该寻找收在高位的多头 K 线高点上方买入。
若连续五根 K 线没有多头实体,即使后面出现一根小阳线,也不是强买入信号。弱 High 2 可能导致 High 3,或者第一次向上反转失败成为 bull trap,形成 Lower High 后再来一腿下跌。图中更大的 complex High 2 仍是多头趋势中的 Higher Low,并且试图守住均线;更适合等较大的 complex High 2,或买后面那些收在高位的多头 K 线。实盘中不必争论它到底叫 High 2 还是 High 3;只要仍是多头趋势中的 Higher Low,后面开始出现收在高位的多头 K 线,重点就应回到买入。
Wedge bull flag 中要等更好的多头 K 线
Time: 19:10
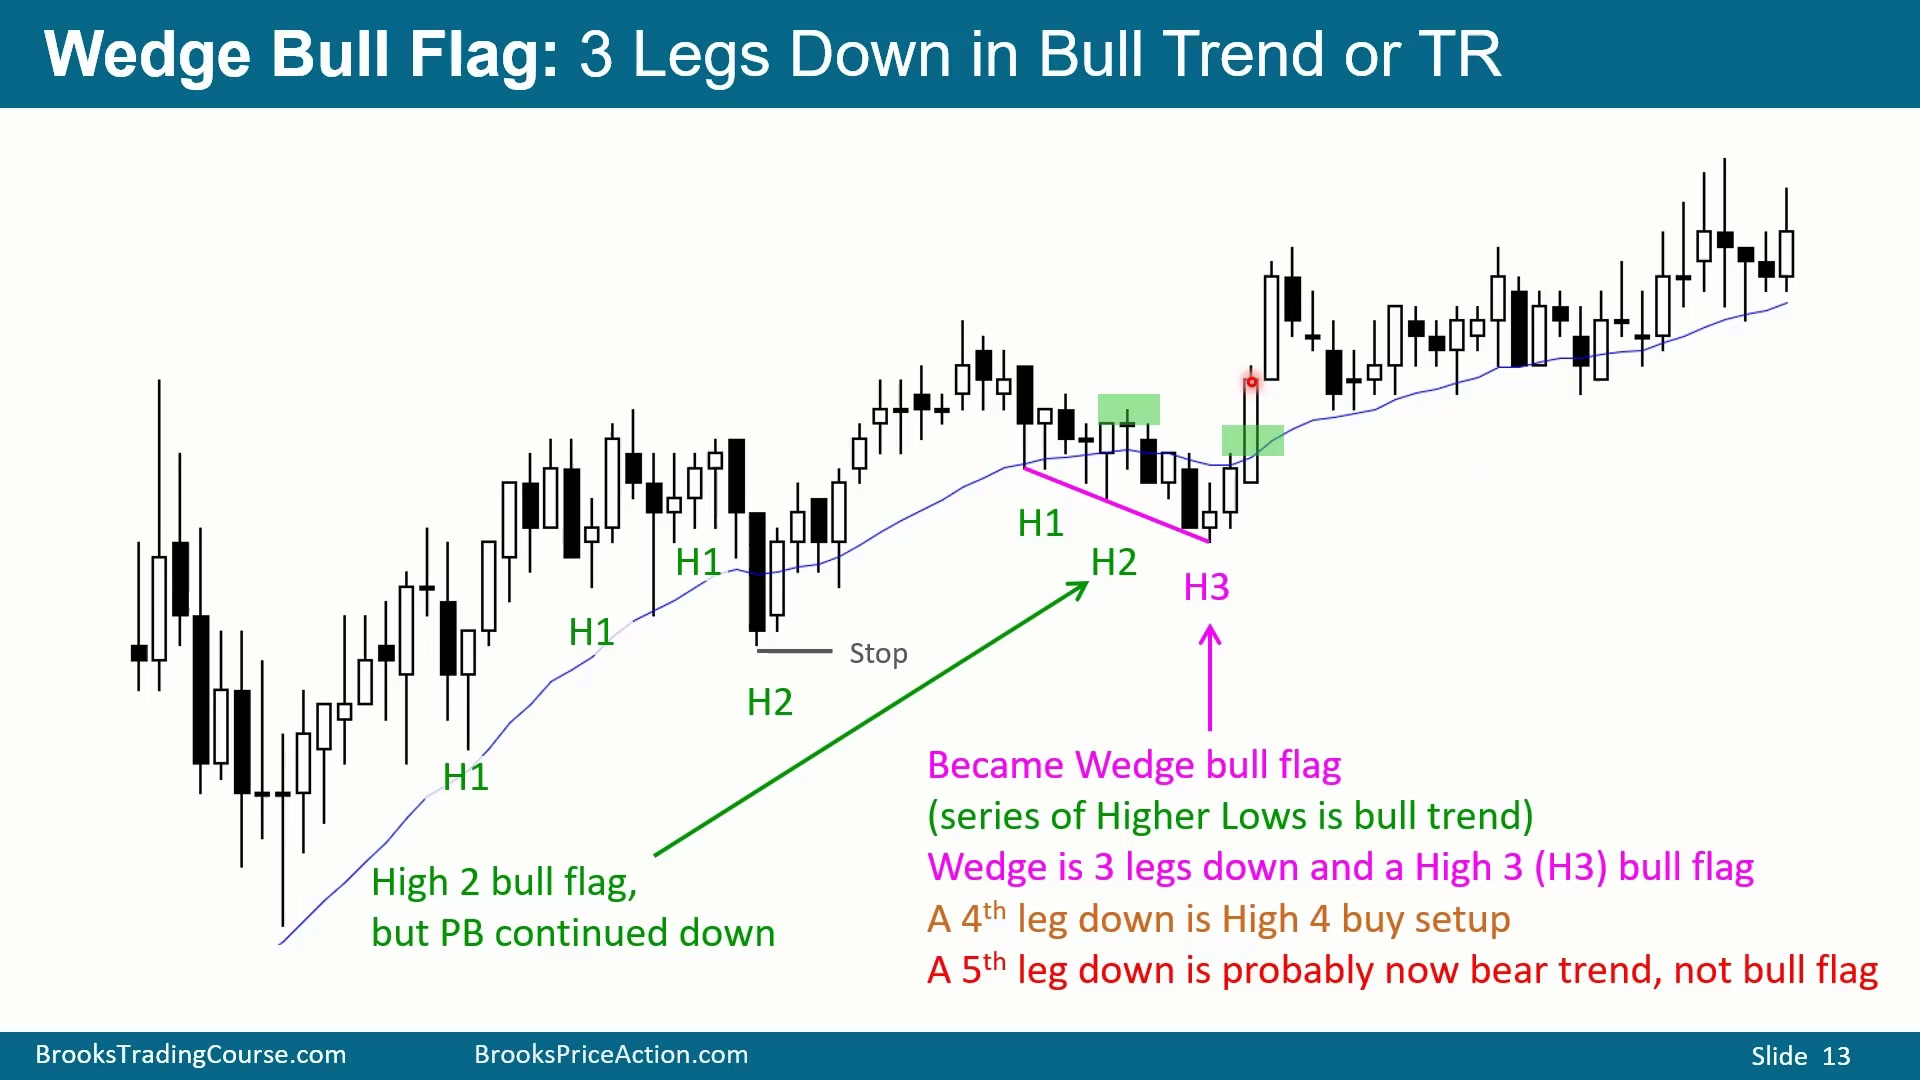
图中先上涨后回调,形成 High 1;再创出新高、再次回调,又是 High 1;第三次回调后高点上方买入被触发,但随后还有一腿下跌。理论上,如果做了这笔多头,保护止损仍在最近突破腿底部下方,要允许一两腿继续下跌,然后等趋势恢复。
某些 High 1 只是小多头 doji,前面又有阴线,并不理想。后面虽然概率更高,但处在 Tight Bear Channel 中,更好的做法是等更清楚的买点,或者等突破后再买。图中尝试形成 High 3 一度未触发,随后才形成三段下跌;沿底部画线是一、二、三,这个 selloff 是 Higher Low,可以看成 Wedge bull flag。
不宜买 doji 高点上方,更适合买收在高位的多头 K 线高点上方。若把前面视为 High 2 bull flag 但它继续下跌,最后仍可以归入 Wedge bull flag 和 High 3。初始止损在底部,等走势向上突破并形成新的上涨腿后,再把止损提高到该腿底部下方。
High 2 代表空头两次反转失败
Time: 20:57
High 1、High 2、High 3 可以用于多头趋势中的回调,也可以用于 Trading Range 中的下跌 swing。但高概率交易应优先找强多头趋势中的 High 1 或 High 2 bull flag,而不是弱多头趋势或 Trading Range 中的回调买点。
图中有多处强多头趋势后的 High 1 和 High 2。某些位置在当前周期没有触发 High 1,但小周期可能已经触发,因此可以按当前周期称 High 1,也可以按小周期理解为 High 2。大幅跳空高开后的两段下跌,在当前图上可能还是 High 1,但小周期上可能是 High 2。标签可变,交易质量仍由背景、信号 K 线和止损位置决定。
强上涨后出现 High 1,若买入后立刻向下反转,止损仍应在最近上涨腿底部,因为回调可能继续扩大但交易仍可能盈利。若出现 6-bar bear Micro Channel,第一次买入概率不高,更好的选择是等第二个买点,或等两三根收在高位的多头 K 线后再买。这样风险可能更大,但概率更高。
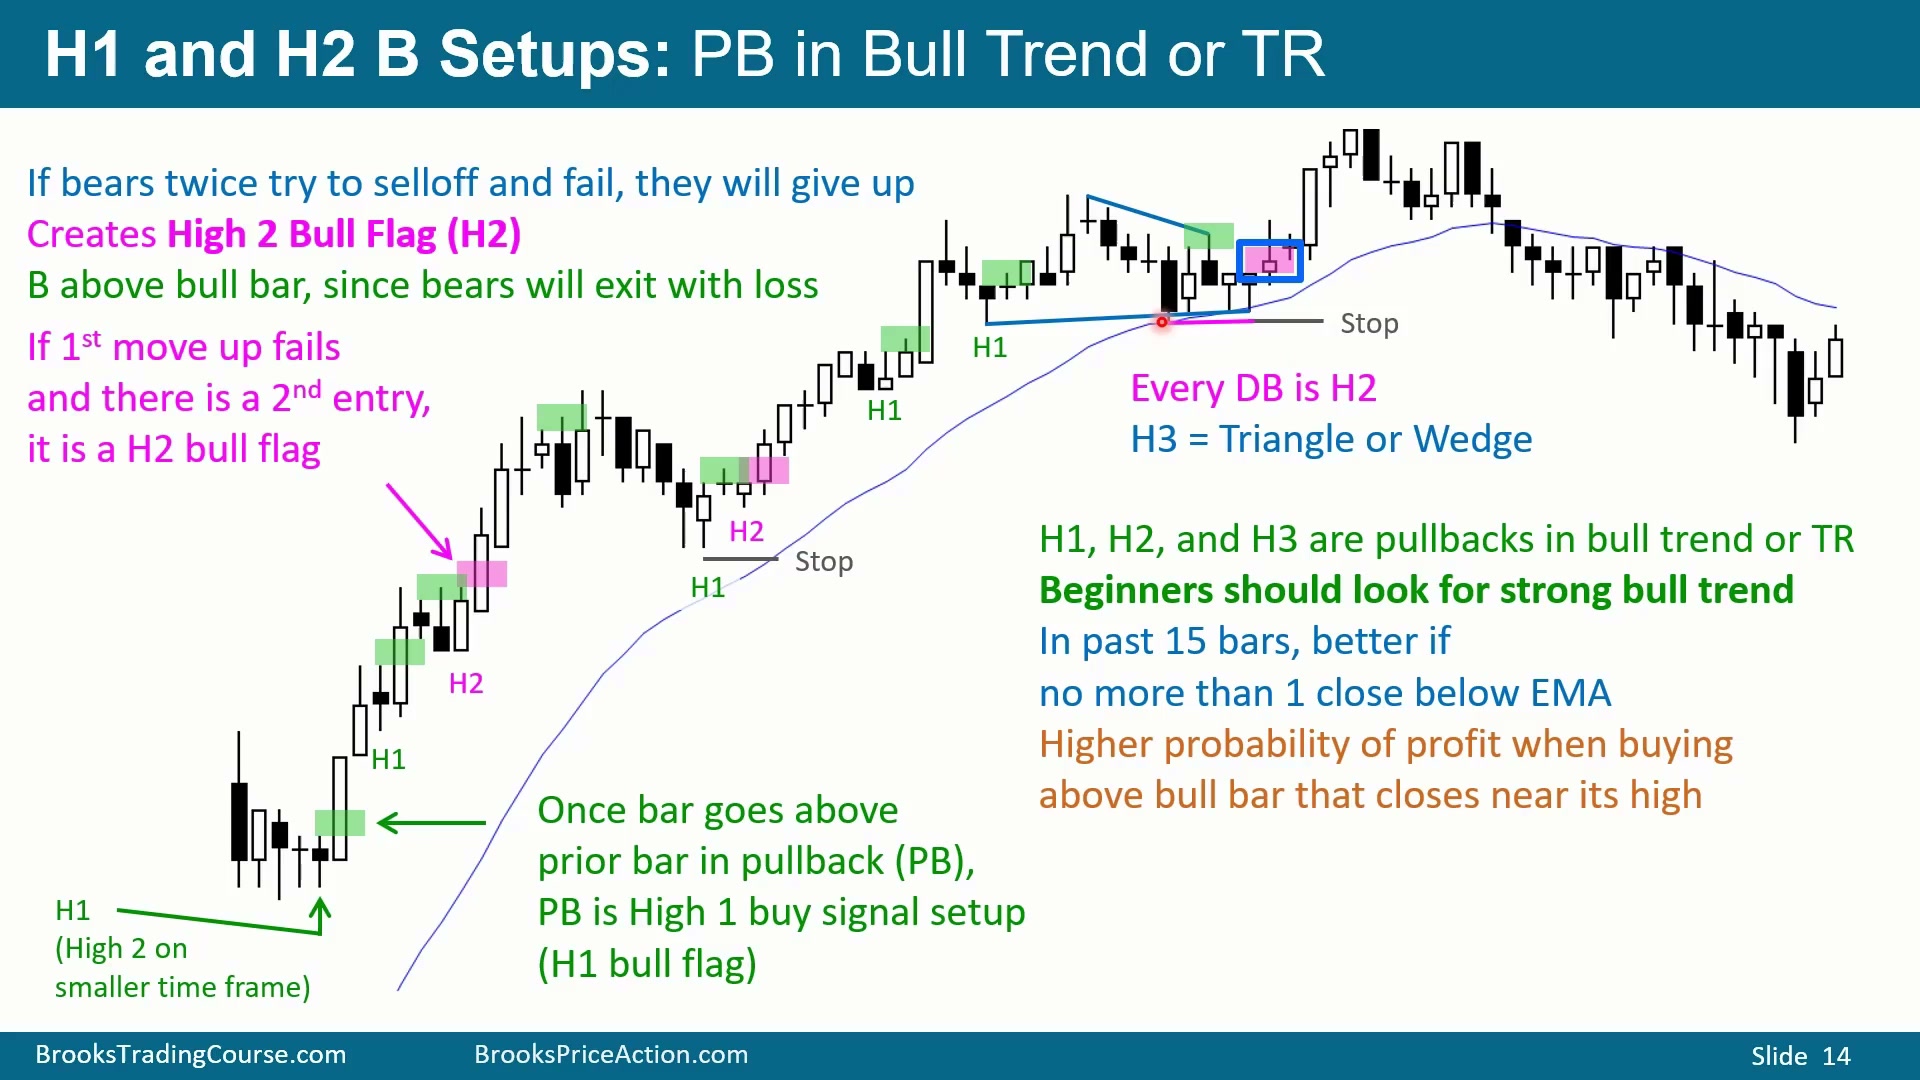
High 2 的核心含义是空头两次尝试向下反转。如果空头失败两次,而多头趋势恢复,多数空头会退出,因此 High 2 bull flag 尤其好,特别是发生在均线附近。Double Bottom 也属于 High 2,因为第一次向下失败,第二次向下也失败。Triangle 也可以被拆成 High 1、High 2、High 3;若交易 Triangle 买点,止损应放在 Triangle 底部下方。
图中的 gap up 后两腿下跌也说明,同一结构在不同时间周期上标签会不同。在当前图上它可能只是 High 1,因为没有先创出新高再回调;但小周期上已经有两腿下跌,所以也可以看成 High 2。另一个 inside bar 的例子,虽然低点没有跌破前一根低点,但它没有突破前一根高点,本质是停顿,也可以算作 High 1;如果后面再向上反转,就可以叫 High 2。
止损也要按结构放,而不是机械贴着信号 K 线。某个 High 1 买点触发后立即向下,止损仍应在最近上涨腿底部,因为回调可能扩大但交易仍可能盈利。6-bar bear Micro Channel 后的第一个买点概率较低,等第二买点或等两三根强阳线后再买,虽然入场价更高、风险更大,但概率更高。
High 2 比 High 1 好,是因为空头第一次失败后可能还会坚持,第二次失败并向上突破时,多数空头会回补。空头回补本身会推动价格上涨,这就是 High 2 bull flag 特别是在均线附近更可靠的原因。
High 2 bull flag 要结合信号 K 线质量
Time: 25:33
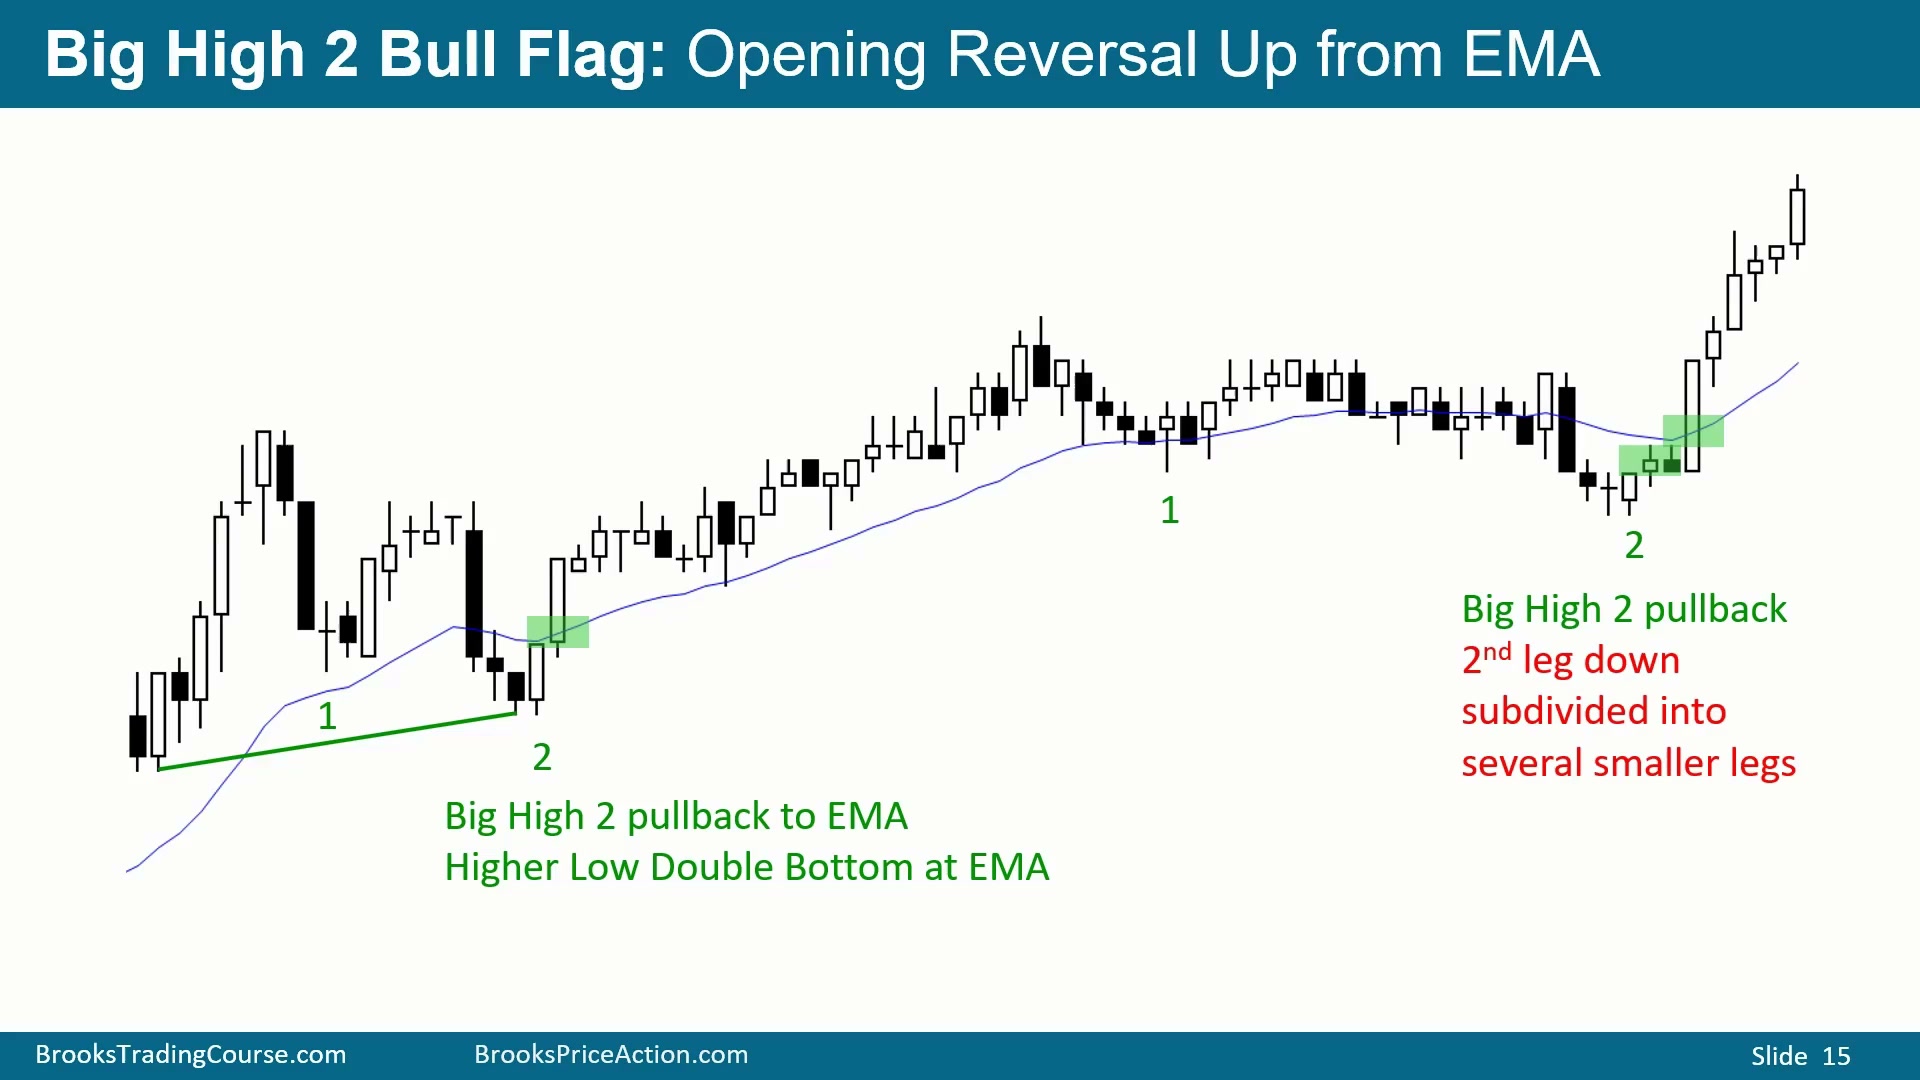
图中先跳空高开并强势上涨,随后卖压出现。第一次 High 1 发生在四根阴线之后,不是好买点。第二腿下跌创出新低,但仍是 Higher Low,并与当日低点形成 Double Bottom,这是 High 2。
即使不想买在阴线高点上方,这里仍是合理买点:两腿下跌、测试均线、测试当日低点并形成 Double Bottom。另一个例子中,一腿下跌后进入 Trading Range,再来第二腿下跌,可以看成大型 High 2 bull flag。High 2 的价值在于强多头背景下空头第二次失败,而不是机械数 K 线。
Wedge Bottom 是向下通道里的三次反转
Time: 26:28
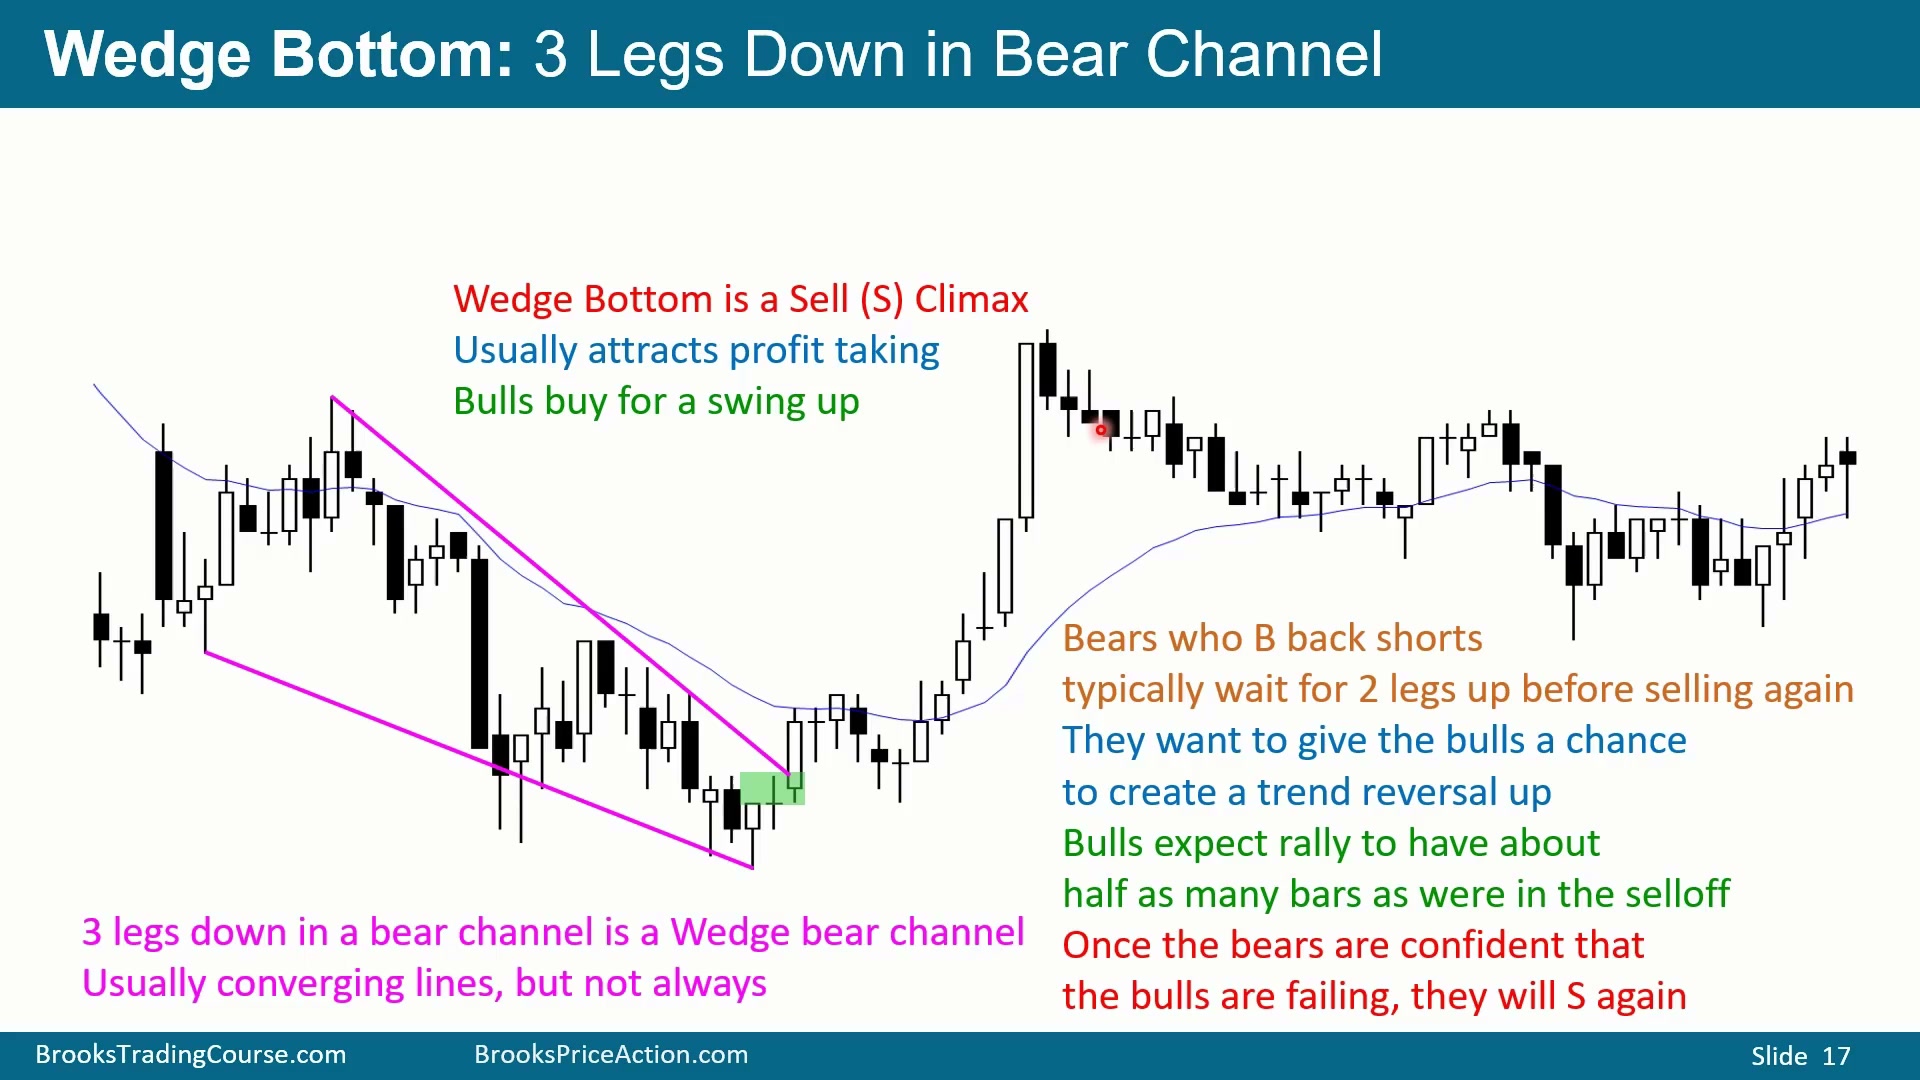
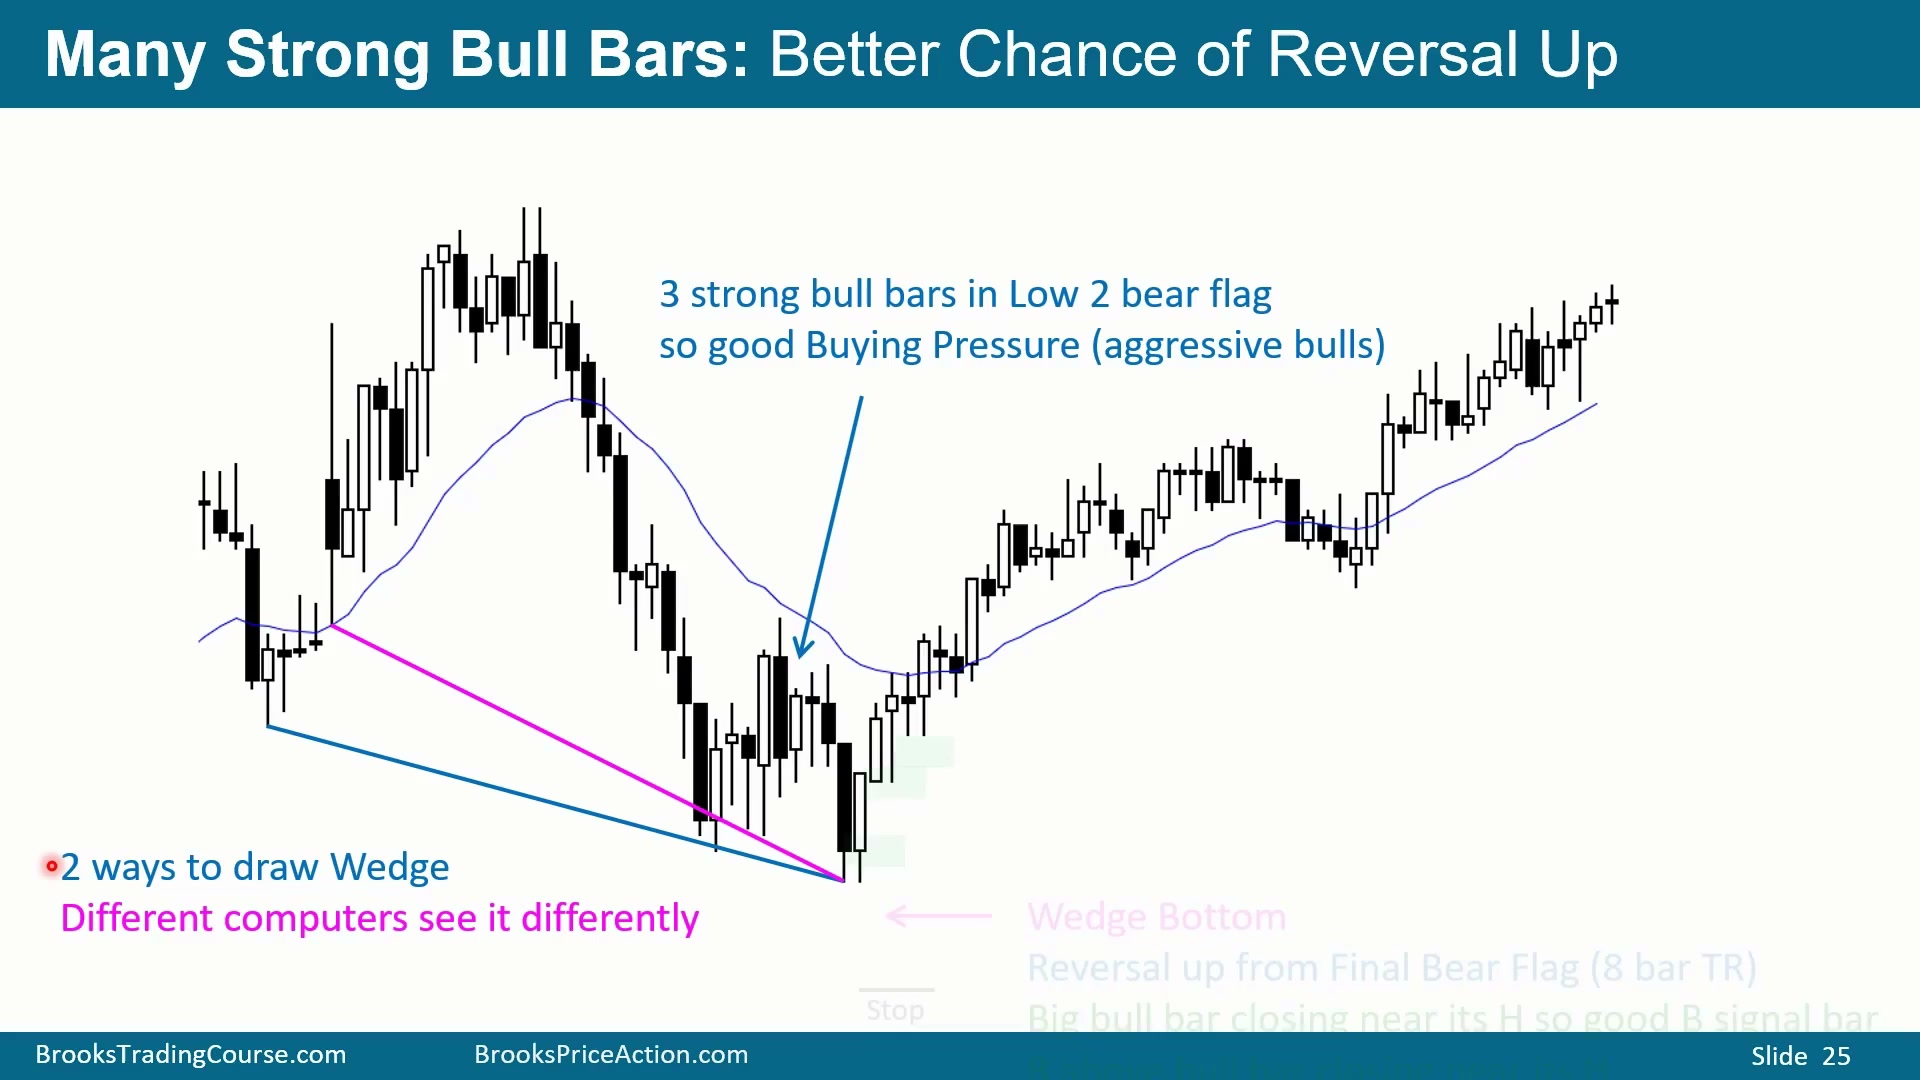
Wedge 的定义可以很宽松。Wedge Bottom 是向下倾斜的 bear channel 中至少三次向上反转,可能有三次、四次或五次。图中即使某个高点高于前高,整体仍基本是 bear channel;三次向上反转后,就可以视为 Wedge。
画线不必追求唯一正确。图中用 Point 1 和 Point 3 画线,使 Point 2 成为 overshoot。也可以用 Point 1 和 Point 2,只要 Point 3 能形成 overshoot。实际画线时,倾向于选择能产生 overshoot 的画法,因为 overshoot 常常是 Wedge 的重要视觉和交易信号。无论 Point 2 overshoot 还是 Point 3 overshoot,关键都是 bear channel 中三段下跌,并通常伴随某种收敛。
如果第三段后出现不错的多头信号 K 线,尤其有 Micro Double Bottom 或第二次向上反转,就是合理买点。预期至少两腿横向到上涨,因此做多后不应在第一腿回调的小阴线下方过早退出;还要预期 Higher Low 和第二腿上涨。
图中的强上涨还要结合左侧背景:它接近 Trading Range 顶部,甚至略高于顶部,可能只是区间中的一条多头腿,也可能是 Buy Climax。熊趋势中的空头若在 Wedge Bottom 处买回空单,通常不会在下一根就重新卖空。他们会给多头至少两次尝试反转趋势的机会,等待两腿横向到上涨。通常希望反弹 K 线数量大约达到前面 Wedge 的一半;如果太短,就还可能继续横向或向上。
当多头尝试失败的迹象出现,空头才会重新卖出。价格突破 Wedge 顶部后第一次向下反转会吸引部分空头,第二次向下反转会吸引更多空头,同时也会让更多多头平仓。Wedge Bottom 不是买入后必须立刻大涨的形态;它常先给出两腿横向到上涨,让多头证明能否把熊趋势转成牛趋势。如果证明失败,第二次向下反转才会让空头重新更积极地卖出。
Wedge Bottom 后常形成右肩和 Higher Low MTR
Time: 30:00
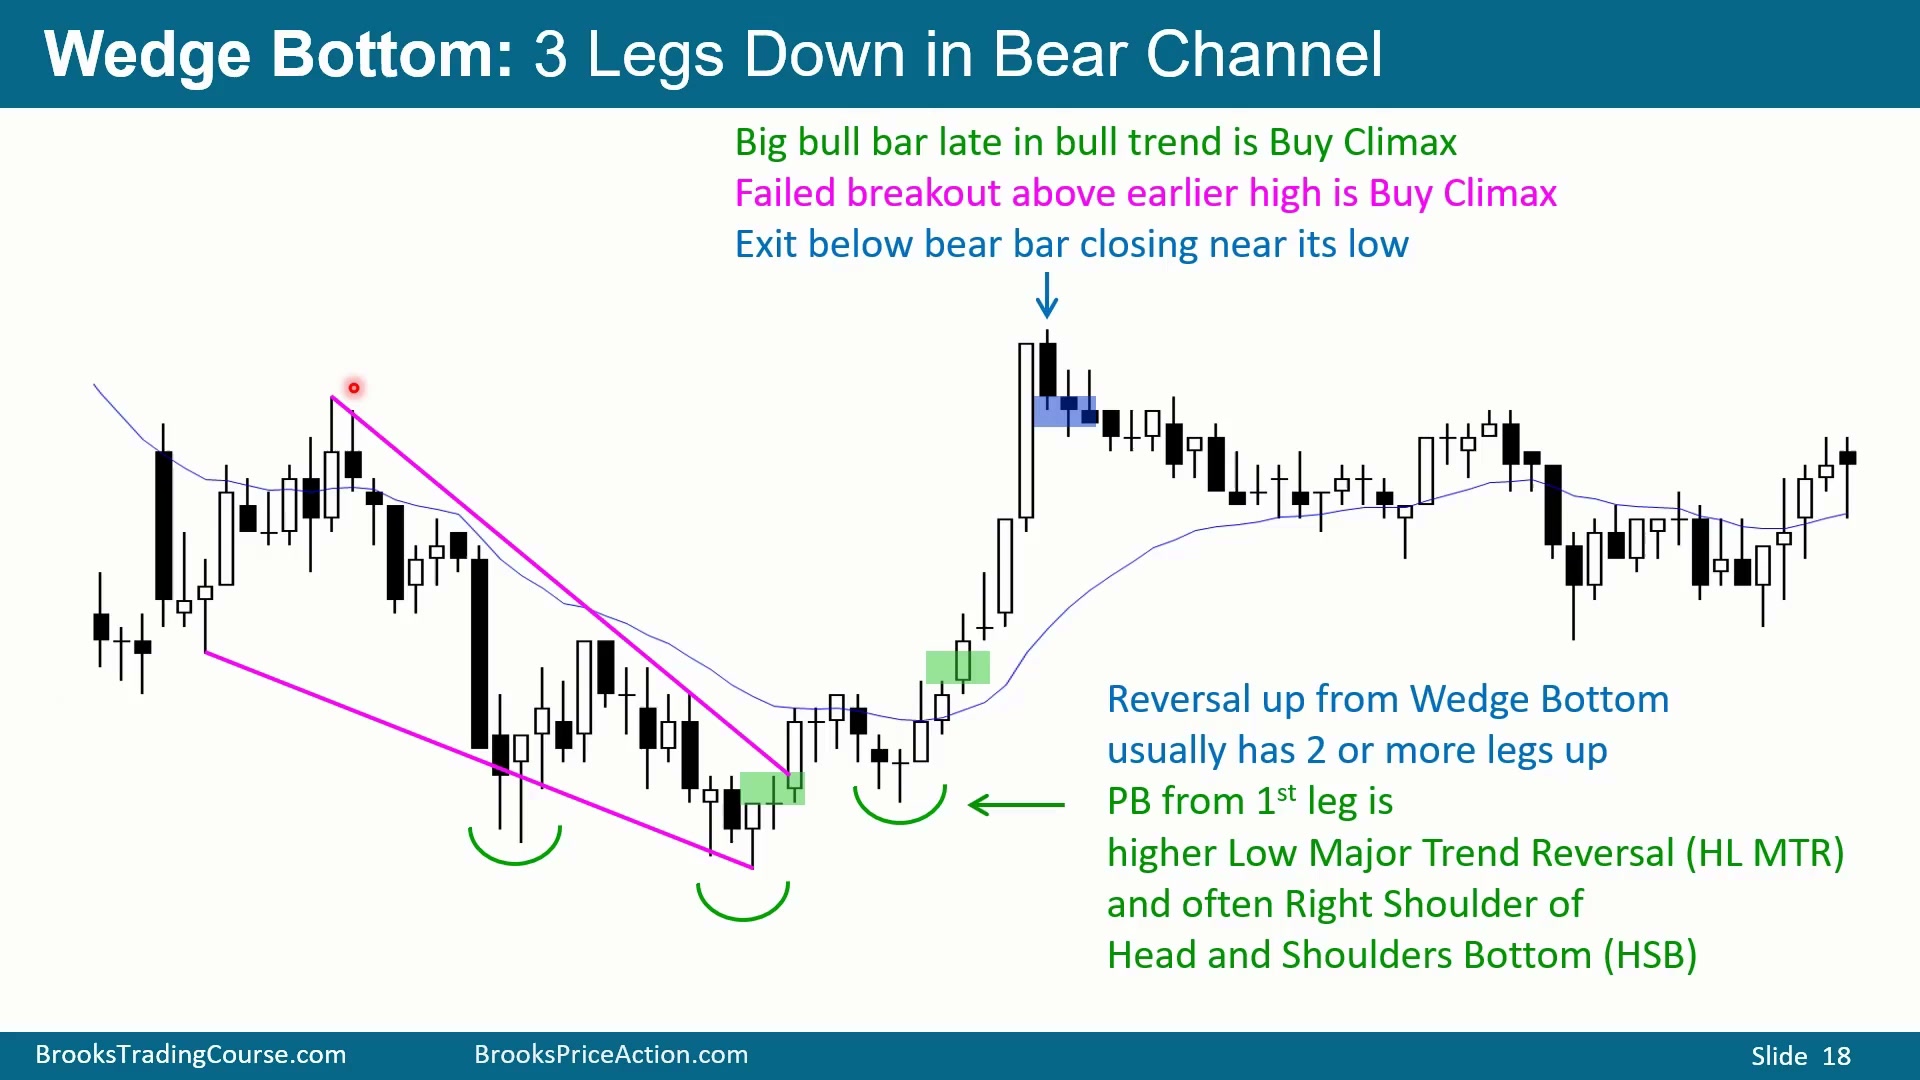
Wedge Bottom 后常见两腿上涨:第一腿、回调、第二腿。这个回调还经常形成 Head and Shoulders Bottom 的右肩;Wedge 中第二段下跌的低点则是左肩,第三段下跌是头部。这样的结构也常是 Higher Low Major Trend Reversal。
图中随后出现一根大阴线,收在低位或接近低位,并且像是 Trading Range 顶部上方的失败突破。多头可以在这根阴线下方退出,空头也会开始卖出。Wedge 后的反弹并不保证变成多头趋势,若在区间顶部形成失败突破和强阴线,就要尊重反转风险。
Wedge 画法越多,越多算法会看到反转
Time: 30:50
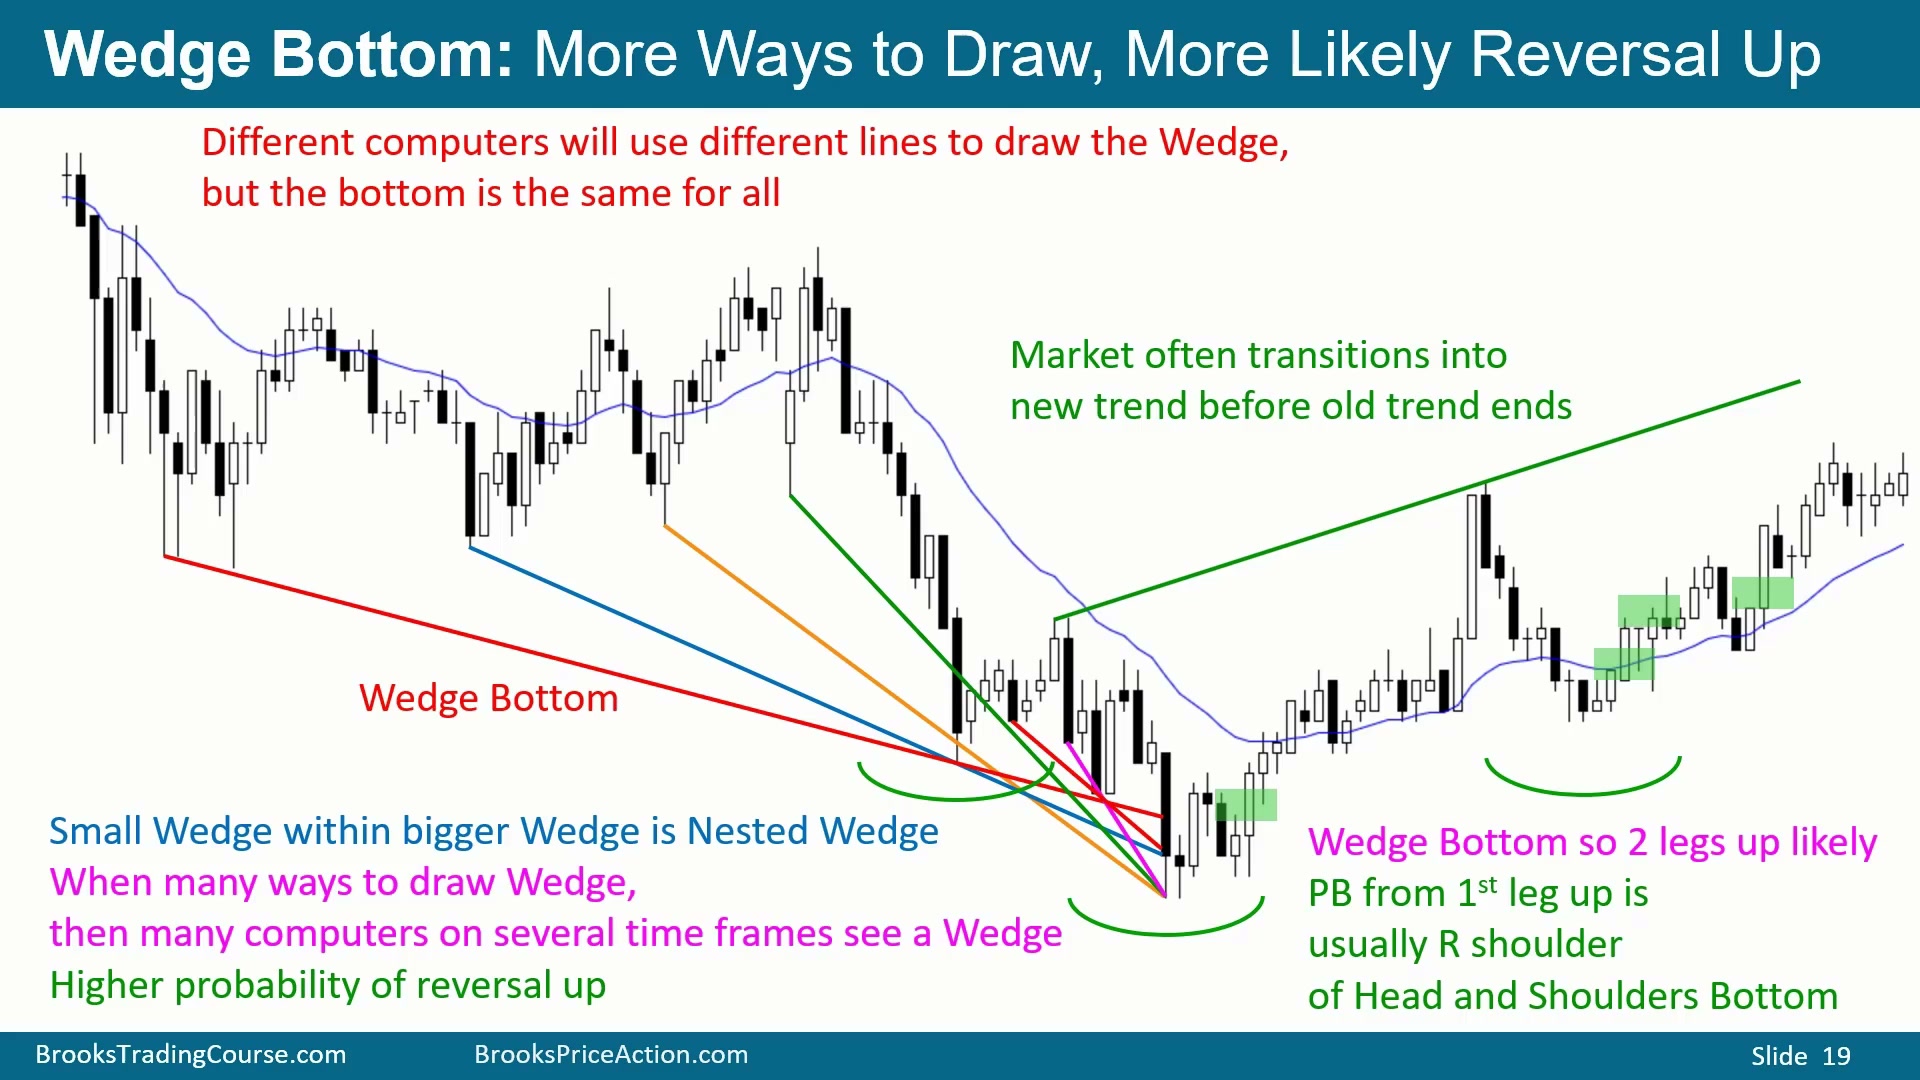
图中三次下推的画法很多:第一点可以选不同低点,第二点和第三点也有多种组合。不同电脑和交易者会用不同低点识别 Wedge。画法越多,越可能有更多算法和交易者把它识别为 Wedge 或 Wedge channel,也就越可能触发至少两腿横向到上涨。
仍然可以按 overshoot 的原则画线:选择 Point 1 和 Point 2,让 Point 3 成为 overshoot;或选择其他点,让 Point 2 成为 overshoot。重点不是线条唯一,而是多种画法都指向同一个底部区域。不同 Wedge 画法共享同一底部,会提高反转概率。
信号 K 线质量仍重要。大阴线之后、Tight Bear Channel 中,买在阴线高点上方不好;更适合等第二个买点,比如后面的多头 K 线高点上方,期待至少两腿上涨。反弹的 K 线数量最好接近前面 Wedge 的一半;若不够,可能只是复杂的第一腿和第二腿,仍需更多横向到上涨。
Wedge 后的 Higher Low 常形成 Head and Shoulders Bottom 的右肩,Point 2 是左肩,因此也可看成 Higher Low Major Trend Reversal。图中还出现向上的通道雏形,说明转势常有过渡期:多头通道的第一腿可能在熊趋势真正结束前已经开始。市场从熊转牛时,常会有一段时间多头力量和空头力量同时运作;从牛转熊时也一样,熊通道的早期迹象常在牛趋势结束前出现。若 Wedge 后反弹的 K 线数量还远少于前面下跌 Wedge 的一半,不要急着认定修正结束;它可能只是复杂的第一腿,后面还需要第二腿或更多横向整理。
Wedge 失败后仍有 50% 可能反转回来
Time: 34:02
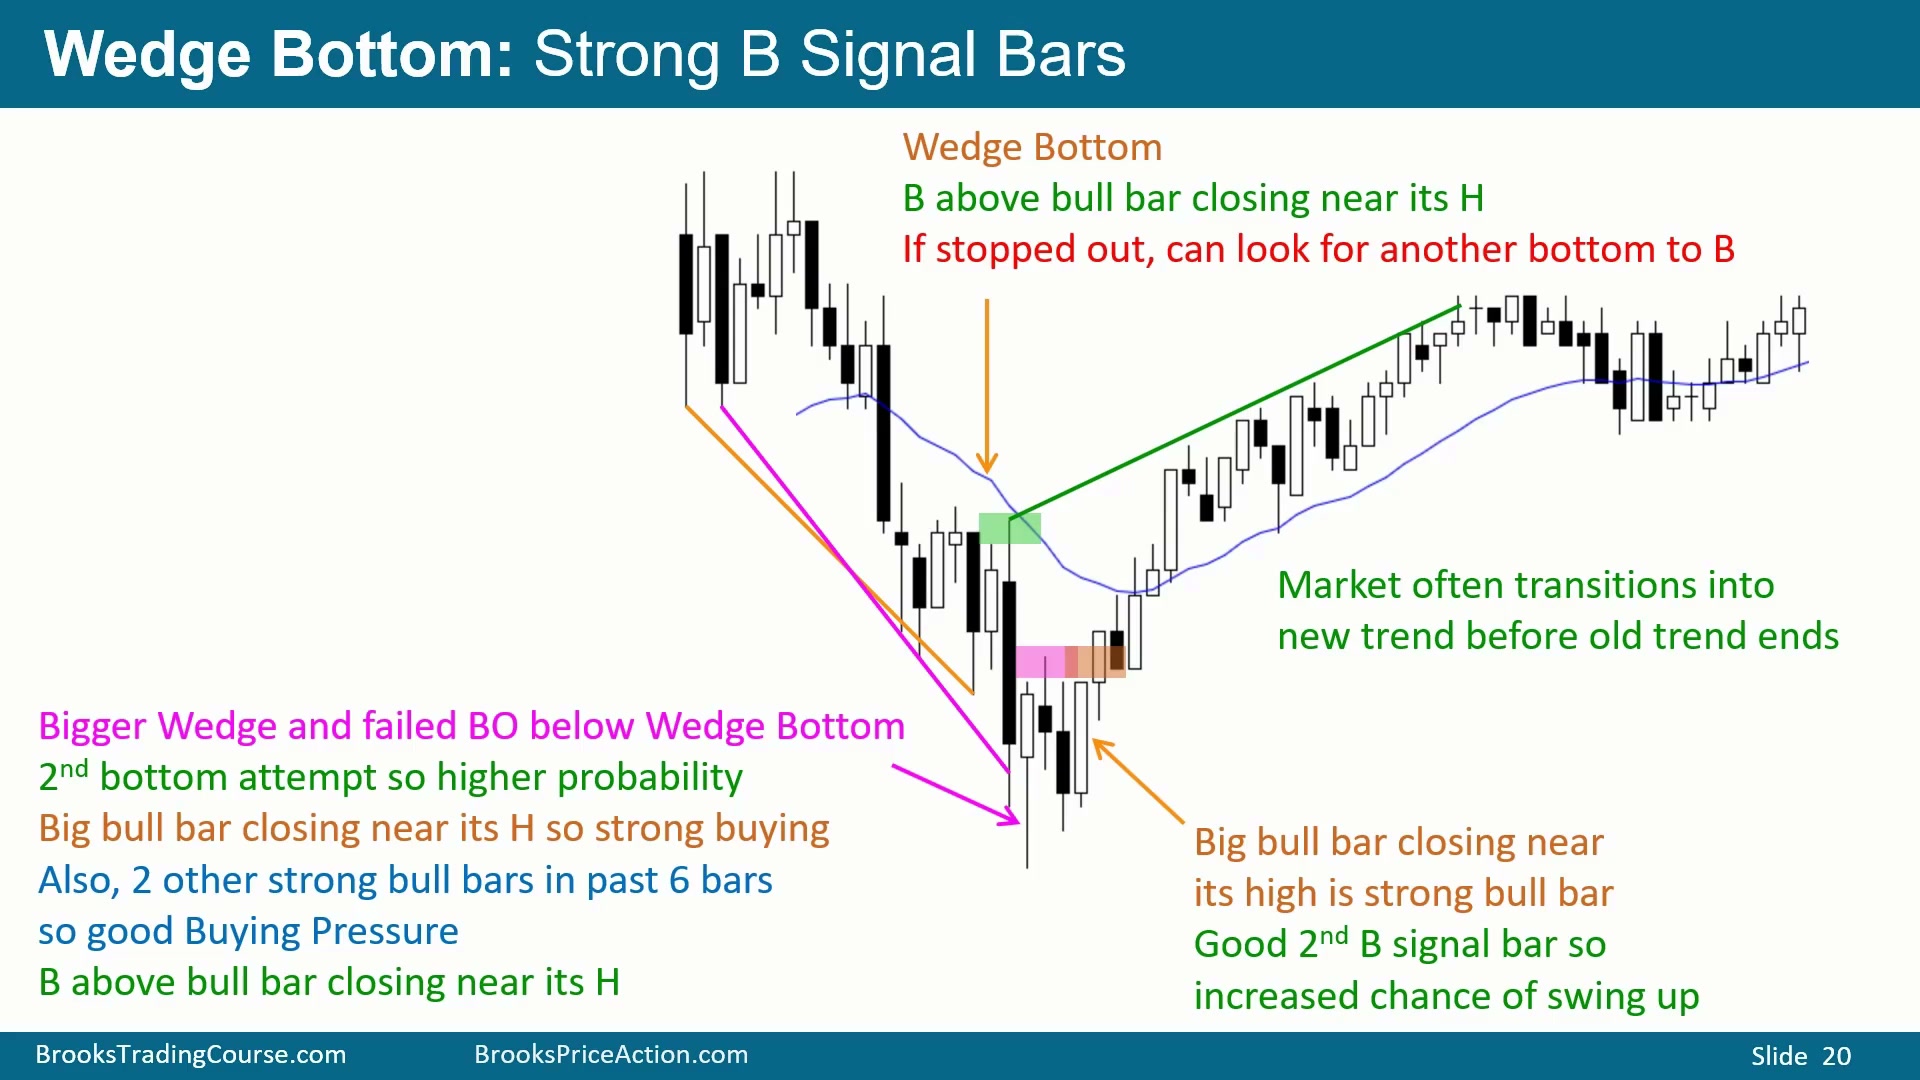
图中先有一个可能的 Wedge:不同画法都能得到一、二、三,同时还有小 Double Bottom 和第二买点的多头 K 线。信号并不完美,因为上影线明显,多头 K 线相对前面阴线不够大,但仍是可信买点。
如果 Wedge Bottom 买入后被跌破止损,仍要知道概率结构:跌破 Wedge 后大约 50% 可能失败并反转向上,50% 可能成功并形成向下 swing。因此有些多头不会把止损放得太近,而是使用很宽的止损,押注跌破 Wedge 会失败,并在后面更清楚的向上反转上方加仓。另一些多头会在 Wedge 底部下方 1 tick 被止损,然后等第二次向上反转,再在相应多头 K 线高点上方重新买入。
Wedge 也可能扩展成更大的 Wedge。后面的低点既是新 Wedge buy signal,也可以看成前一个 Wedge 下破失败后的买点。此时开始出现大阳线收在高位,且多头 K 线强度逐渐接近前面的空头 K 线;前面阴线虽然大,但有上下影线,多头开始形成更可靠的 Buying Pressure。第二个强买点进一步提高向上 swing 的概率。
图中反转上行后,要开始寻找 bull channel。把后面的通道线向左延伸,会连到更早的高点,说明多头通道可能在熊趋势结束前已经开始。这是转势中的常见现象:一段时间内,多头通道和空头趋势同时存在。
熊趋势后期的大阴线常是卖压衰竭
Time: 36:48
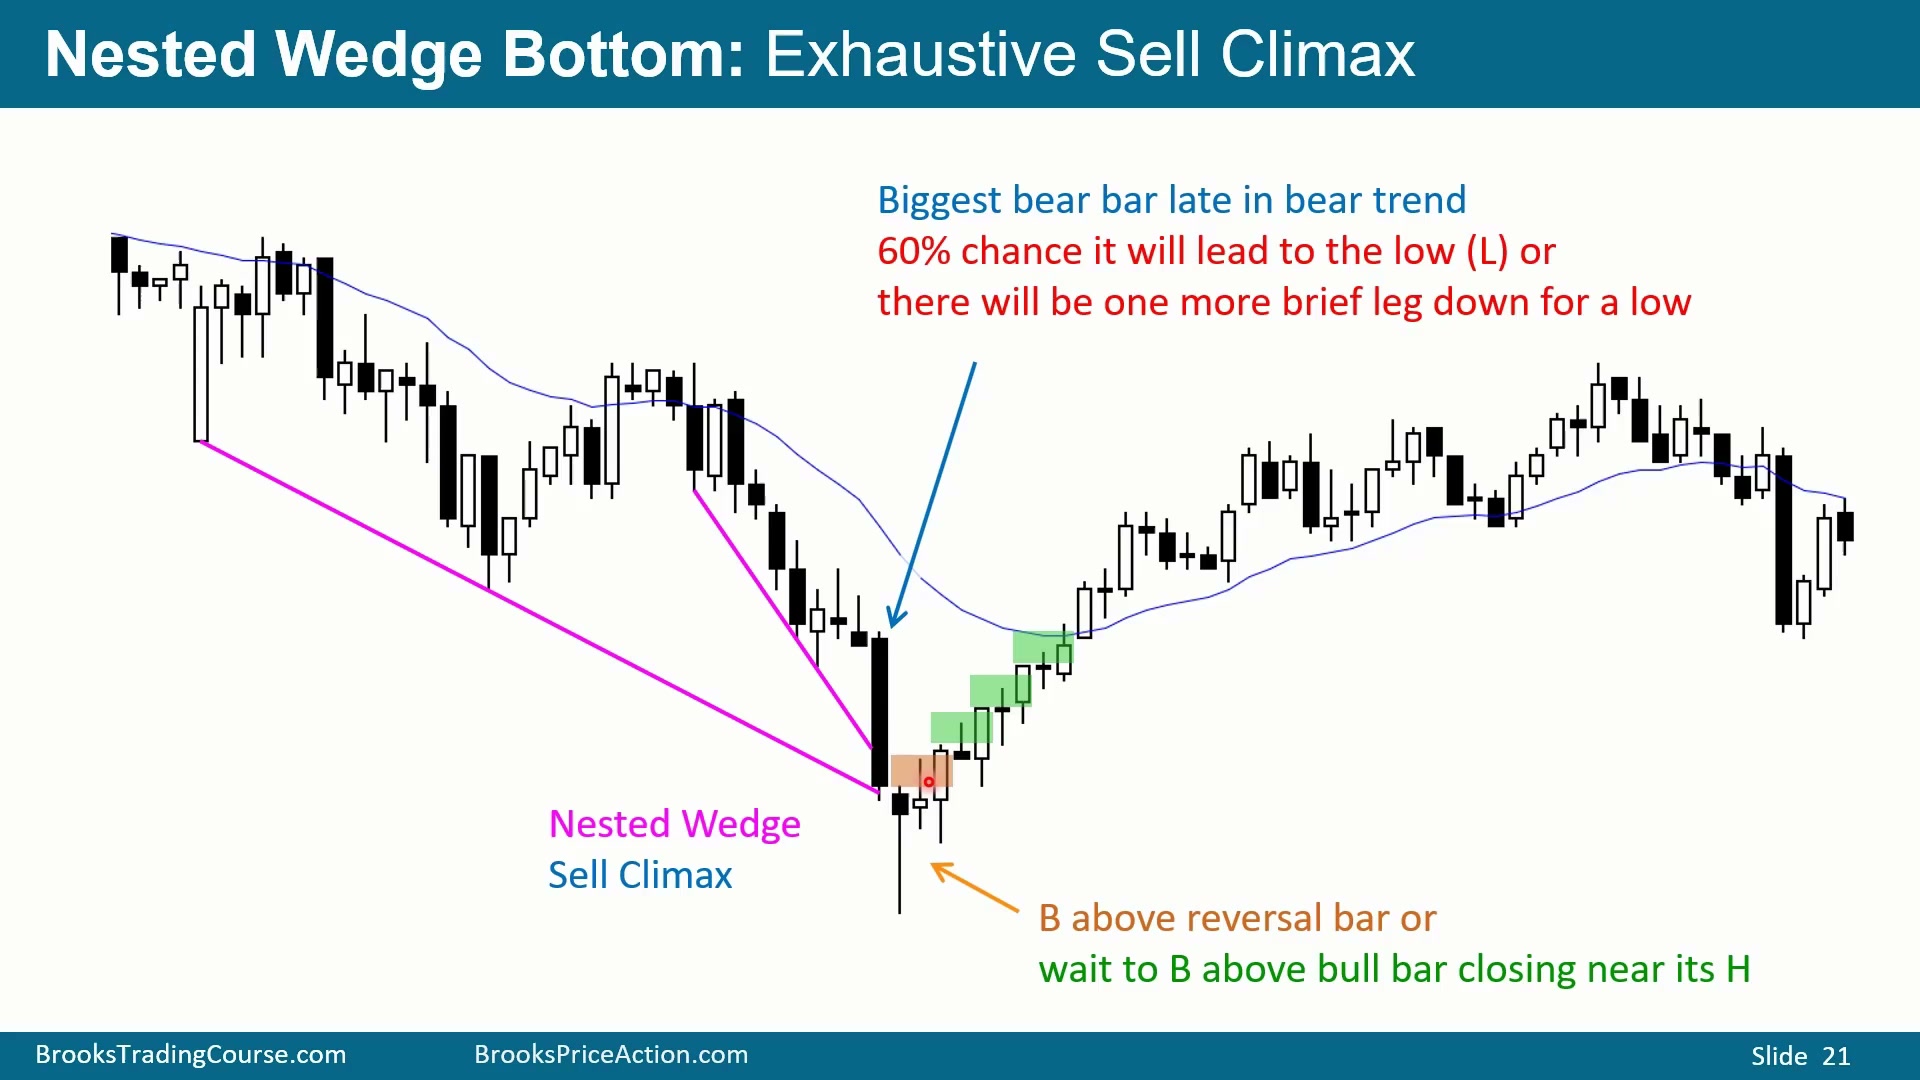
图中一根很大的阴线出现在熊趋势后期,已经距离熊趋势开始超过 20 根 K 线。熊趋势后期出现最大的空头突破时,大约 60% 概率代表熊趋势正在结束或很快结束:要么直接横向或向上,要么再来一小腿下跌后结束。
图中还有 Tight Bear Channel 的三腿下跌,可视为 Parabolic Wedge Bottom;它又处在更大 Wedge Bottom 内部,因此是 nested Wedge。小 Wedge 嵌在大 Wedge 的第三段下跌中,会提高向上反转概率。
反转 K 线收在中点上方、接近高位,但仍是阴线实体。部分交易者会买它的高点上方,另一些交易者更愿意等收在高位的多头 K 线,因为概率更高。Wedge 背景提供反转理由,但信号 K 线质量决定是否要立即买,还是等更强确认。
买点越晚,概率越高但风险也可能变大
Time: 38:25
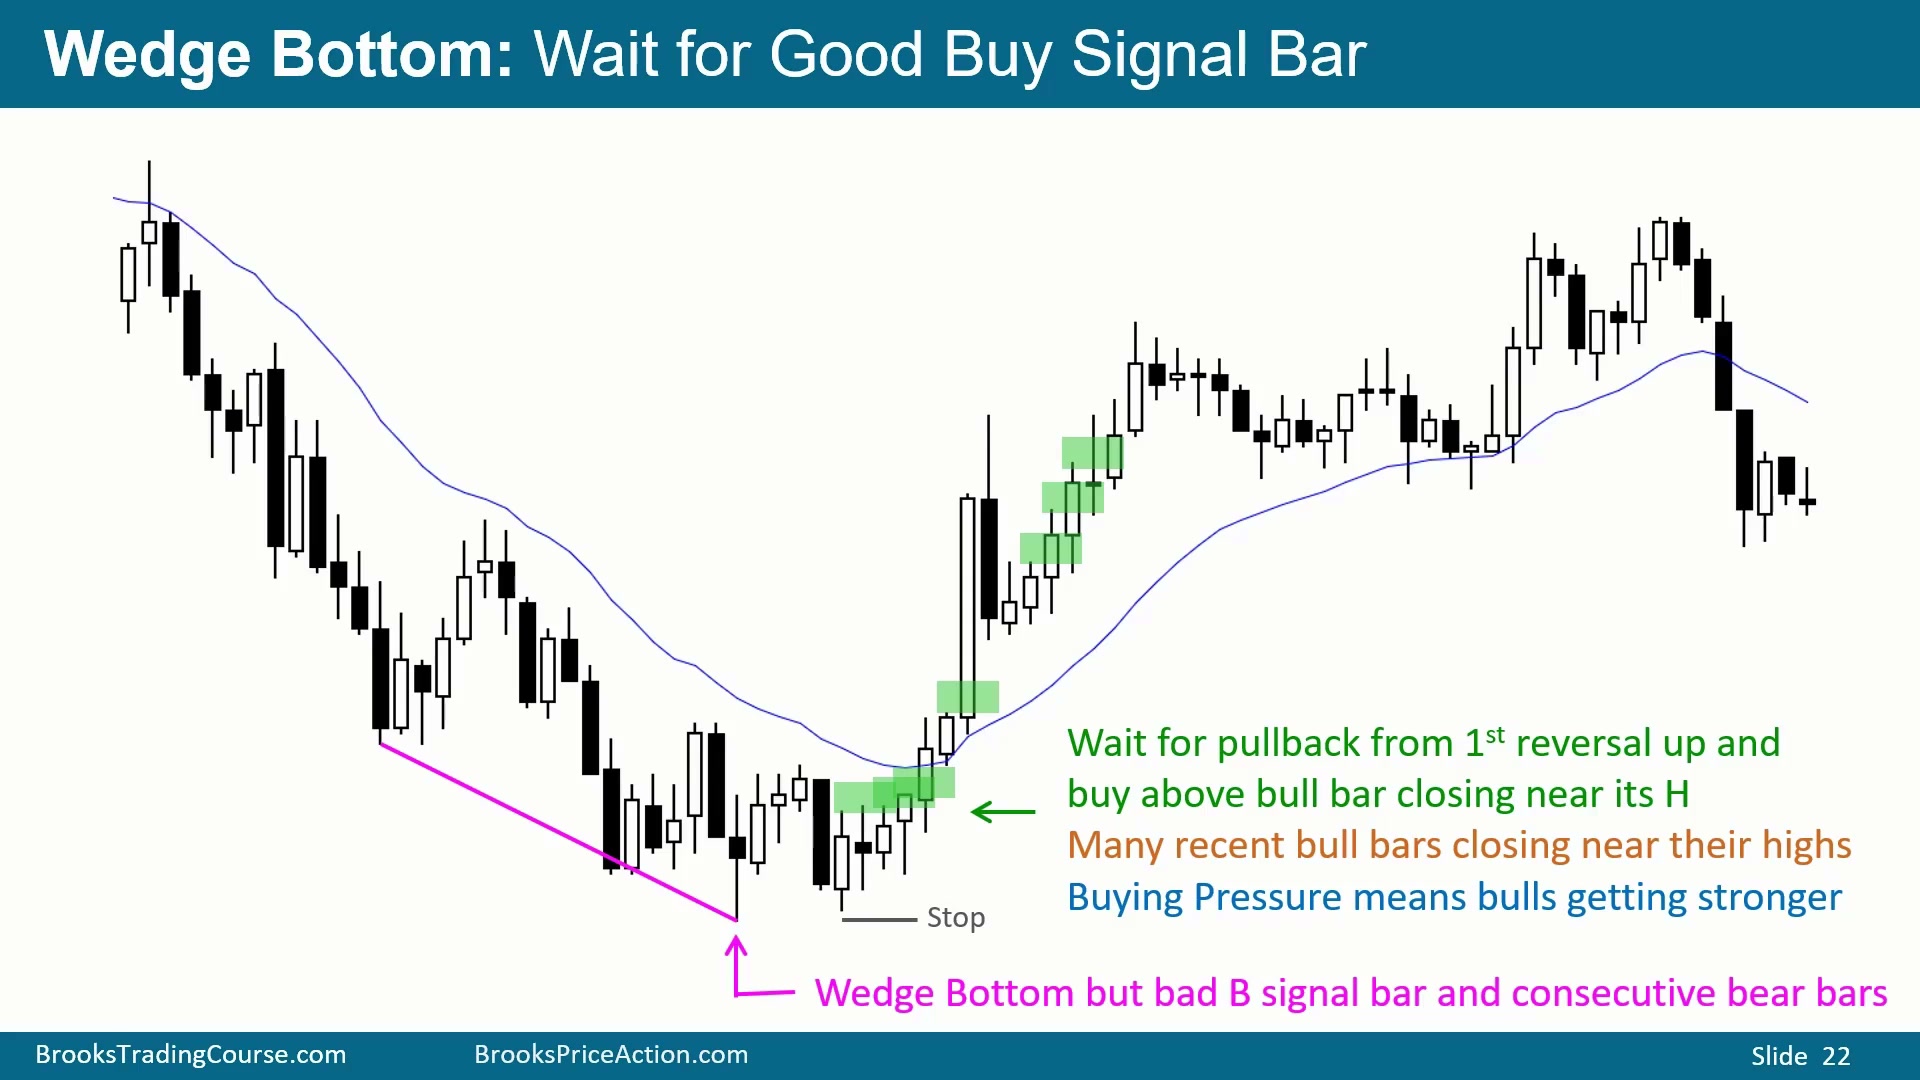
图中能看到一、二、三的 Wedge Bottom,但第一根买入信号不好:它是 bear doji,而且跟在大阴线后面。后面的多头 K 线也有上影线,实体不大。因此很多交易者会等第二个买点,或等真正收在高位的多头 K 线再买。
一旦开始连续出现收在高位的多头 K 线,向上概率提高,交易者会在这些多头 K 线高点上方买入。如果早期买入,可以把止损放在 Wedge 低点下方;但随着市场开始形成明显向上反转,止损可以提高到反转腿底部下方。
图中左侧有大量阴线,但右侧开始出现越来越多阳线,并且很多阳线收在高位。这是 Buying Pressure,说明多头开始积极买入,也提高继续上涨的概率。
Wedge bull flag 可以来自深回调后的 Higher Low
Time: 39:40
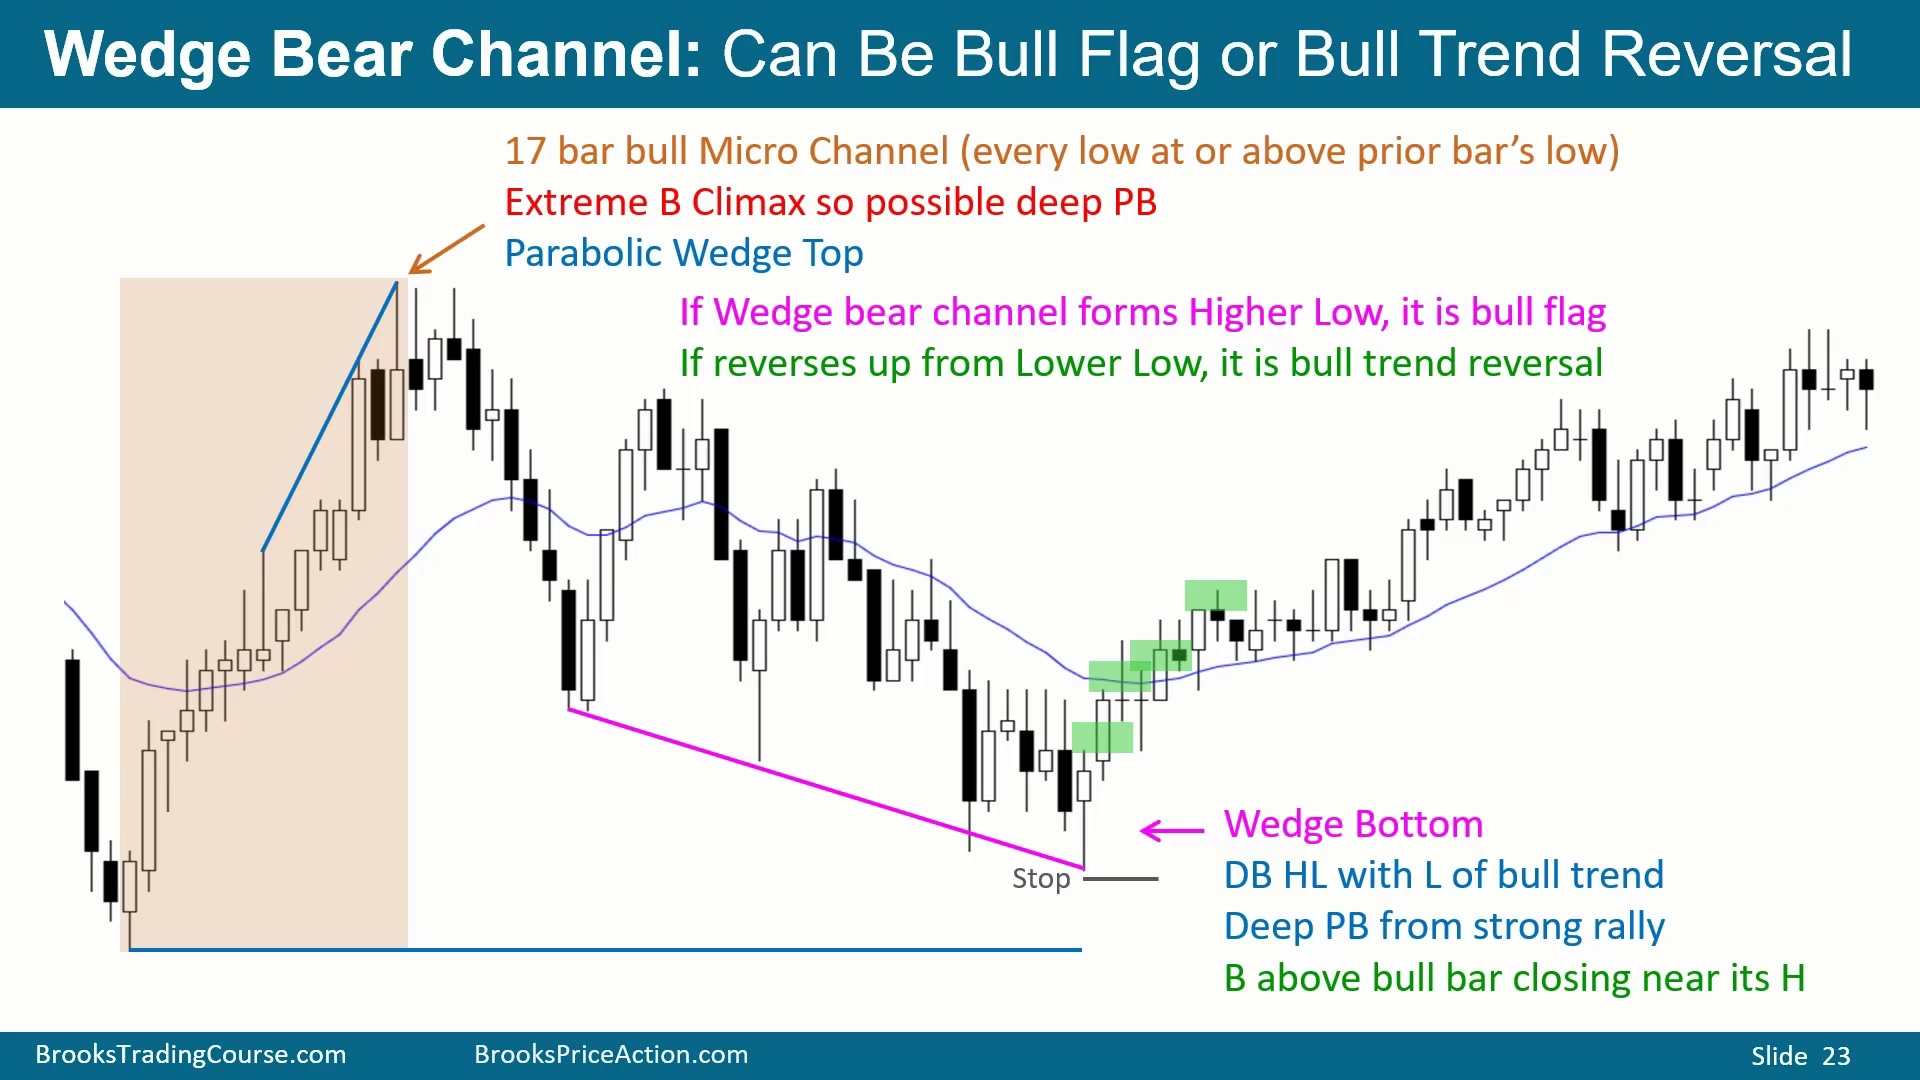
图中 Wedge Bottom 有多种画法。随后出现 Tight Bull Channel 的三段上涨:第一段、回调、第二次突破、回调、第三段。非常紧的多头通道中出现三个顶部,就是 Parabolic Wedge,常会带来某种回调,有时甚至反转成熊趋势。
虽然随后 selloff 很大,但低点仍守在前面重要低点上方,因此整体只是从上涨后的回调,仍是 Higher Low。可以把它叫 Wedge Bottom,也可以叫 Wedge bull flag。
更好的买点是收在高位的多头 K 线高点上方。图中某处跌破前低形成 Wedge 下破失败,也可以看作带 Lower Low Double Bottom 的 Wedge;最初的买点没有触发,随后出现第二根多头 K 线,概率更高。后面阴线减少,多头开始在多头 K 线和其他 K 线高点上方买入,期待向上 swing。
强熊趋势中的 Wedge Bottom 不应急着买
Time: 41:06
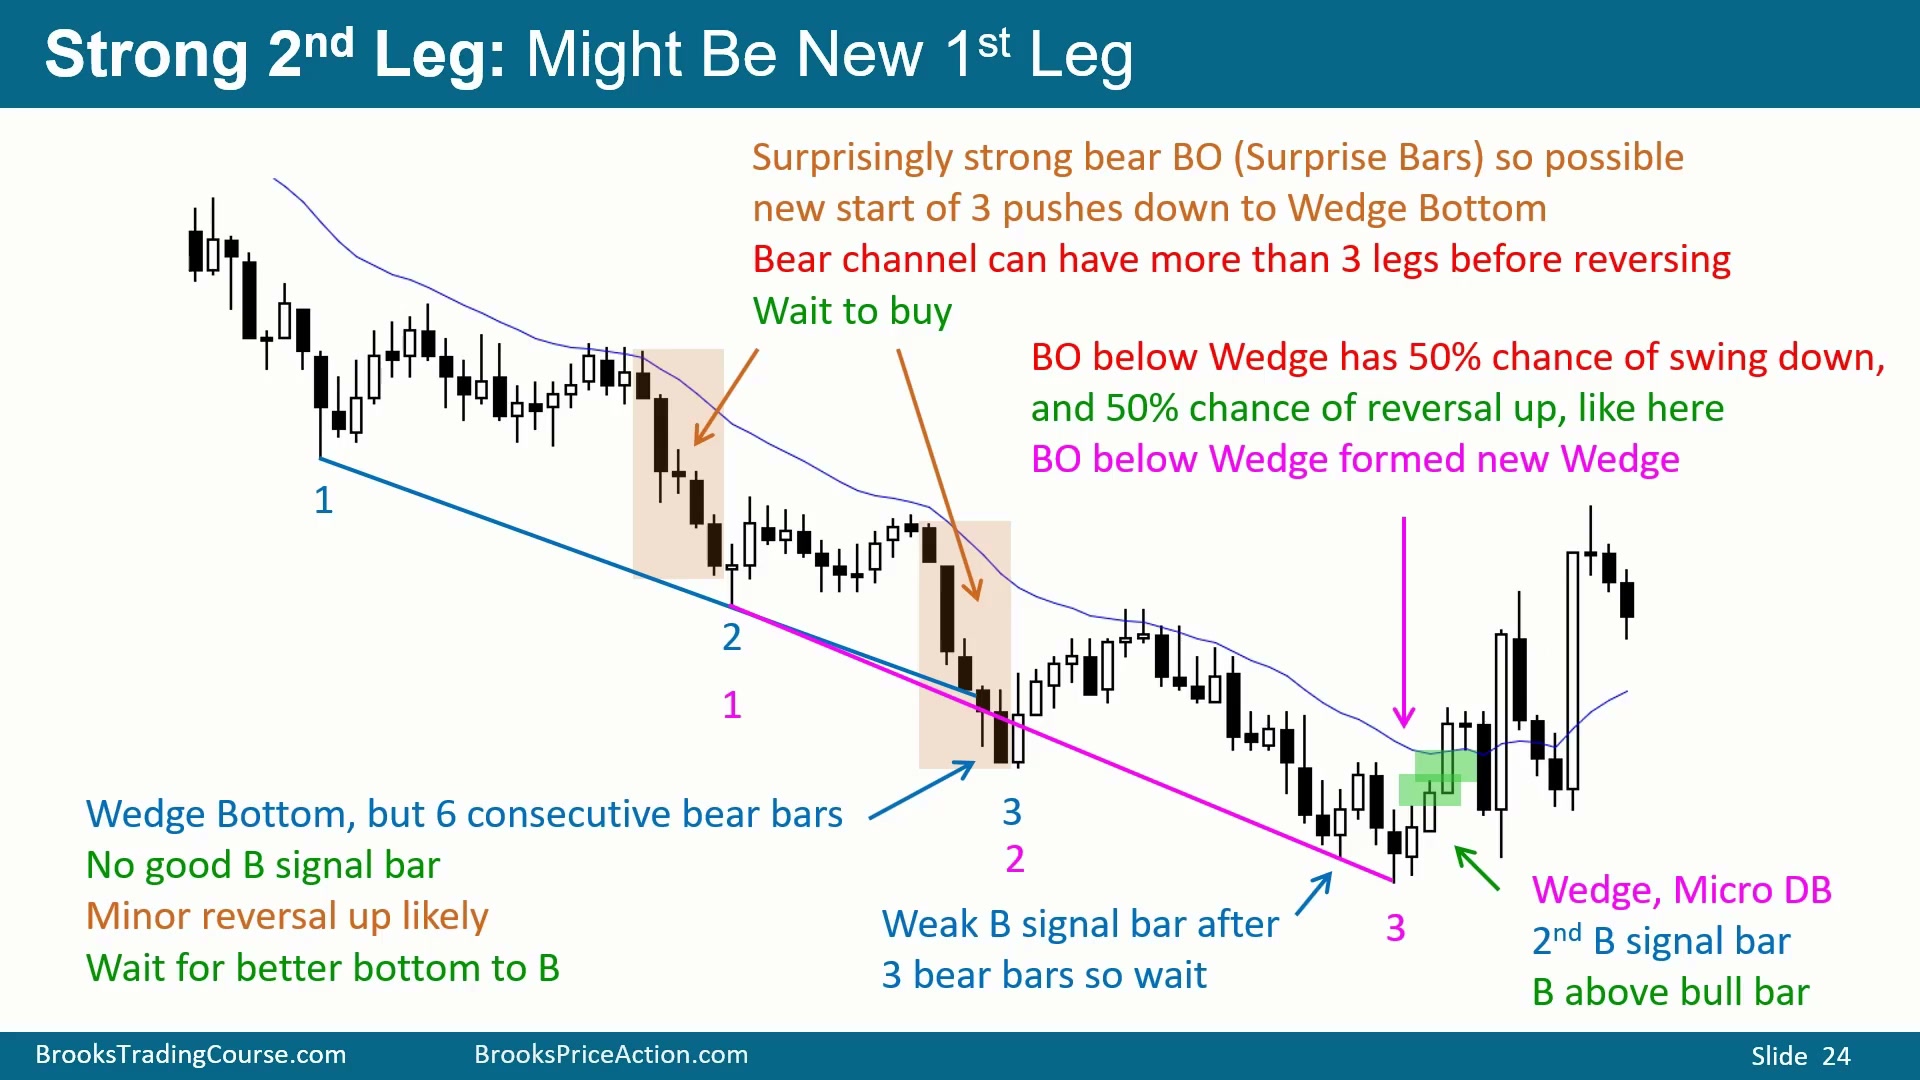
图中可以数出三段下跌,但必须先看背景。卖压很强,一串阴线构成强熊通道。强熊趋势里总会不断形成 Wedge Bottom,如果每个 Wedge 都去买,会反复逆势。
强 selloff 出现后,Wedge 计数应该重新开始。前面的一、二不一定还有效;新的强下跌腿可以成为新的第一腿。如果又来一段强下跌,还要再次重置。图中也可以有多种一、二、三的画法,但更重要的是等待第二次向上反转或更强买入信号。
第一买点信号 K 线弱:有尾巴、小实体,并且出现在三根阴线和 Tight Bear Channel 后面。更合理的是等第二买点。若已经买入,止损放在更低的底部下方,因此后面的 Higher Low 不会止损,仍可以持有多头。
早盘 Wedge 需要等 Buying Pressure
Time: 42:37
图中是 5 分钟图的开盘阶段,可以用当天低点数一、二、三,也可以把前一天的低点纳入,得到另一种 Wedge 画法。不同电脑会用不同点,因此会看到不同 Wedge。
早期某根多头 K 线不错,但前面有三根阴线处在 Tight Bear Channel 中,不是好买点。第二个买点本身是阴线,也不理想。后面虽然是上涨后的回调,但信号是一根很大的阴线,也不够好。
更后面出现两种 Wedge 画法,而且连续第三根或第四根多头 K 线收在高位或接近高位,Buying Pressure 开始出现。这时买入概率更高。Wedge Bottom 的质量不是只由三段下跌决定,还取决于后面是否出现足够强的多头跟随。
Trading Range 中形态难看但仍可交易
Time: 43:40
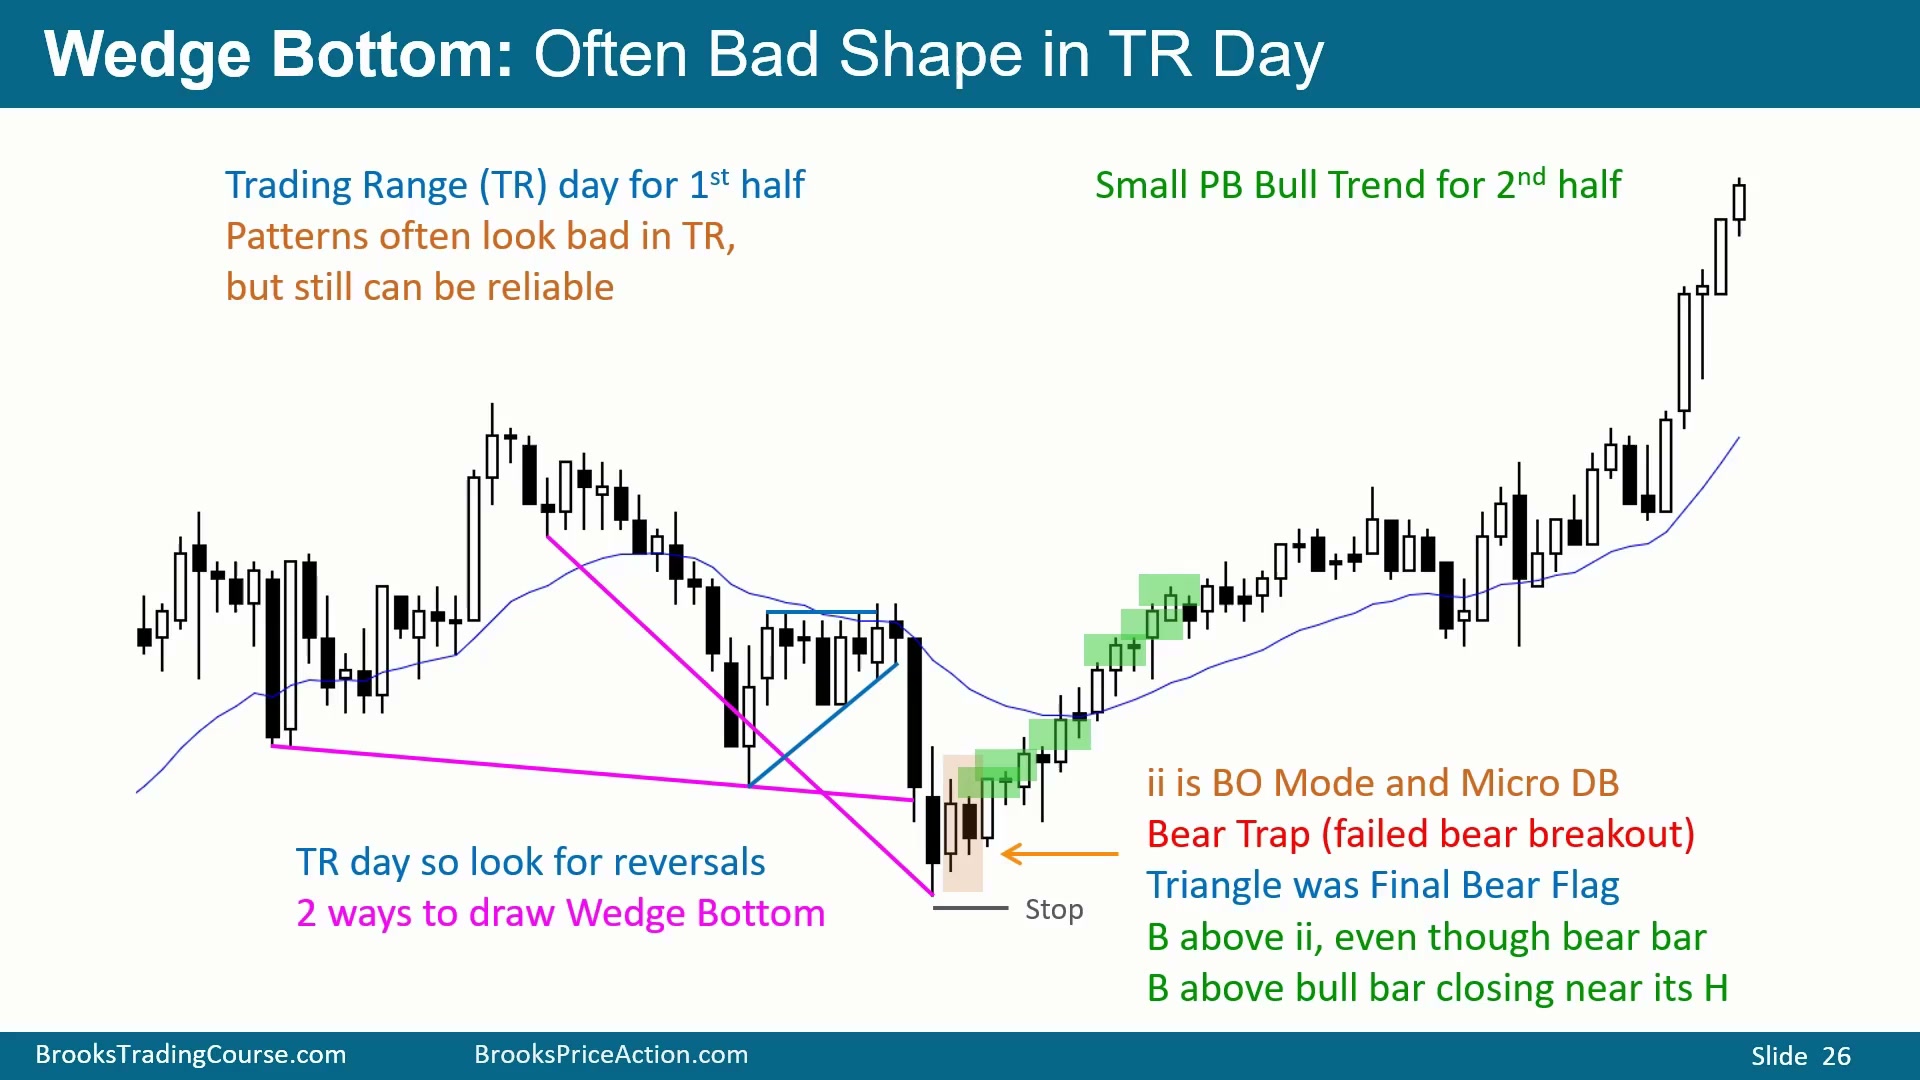
图中可以用不同方式画 Wedge。此时市场在 Trading Range 中,既有 Lower Low,也有 Higher High,方向并不清楚。震荡区间中的形态经常不好看,不会像教科书那样整齐,但仍然可以交易。
前半天是 Trading Range,后半天变成 Small Pullback Bull Trend。图中先有低点、回调、Sell Climax、回调和第三腿下跌,这是 Wedge 的一种画法;之后又有强向上反转,再次强向上反转,以及跌破某条线后的第三种画法。画线时仍可以按 overshoot 原则选择 Point 1、Point 2、Point 3,让其中一个点形成 overshoot。
图中还出现较晚的 Triangle,常常是 final bear flag。随后出现整个 30 根 K 线趋势中最大的两根阴线,这类后期大阴线有约 60% 概率意味着卖压结束或很快结束。Sell Climax 后出现 ii buy signal:一根 inside bar 套在前一根里,下一根又在里面。它可能是 bear flag,但若是 bear flag,常常也是 final bear flag;同时它也是买入信号。可以在阴线、阳线或后面的多头 K 线上方买入,也可以等 Small Pullback Bull Trend 开始。Sell Climax、两种 Wedge 画法、可能的 Final Flag 和 ii 叠加,使这里成为合理找买入的位置。
这个区域的价值在于多个交易者会用不同理由看到同一件事:有人看 Wedge,有人看 Sell Climax,有人看 Triangle final flag,有人看 ii,有人等后面的小回调多头趋势。Trading Range 中形态不整齐,但当多个理由集中到同一区域,买点仍然可以成立。
强熊趋势中 Wedge Bottom 多半只是卖点背景
Time: 46:17
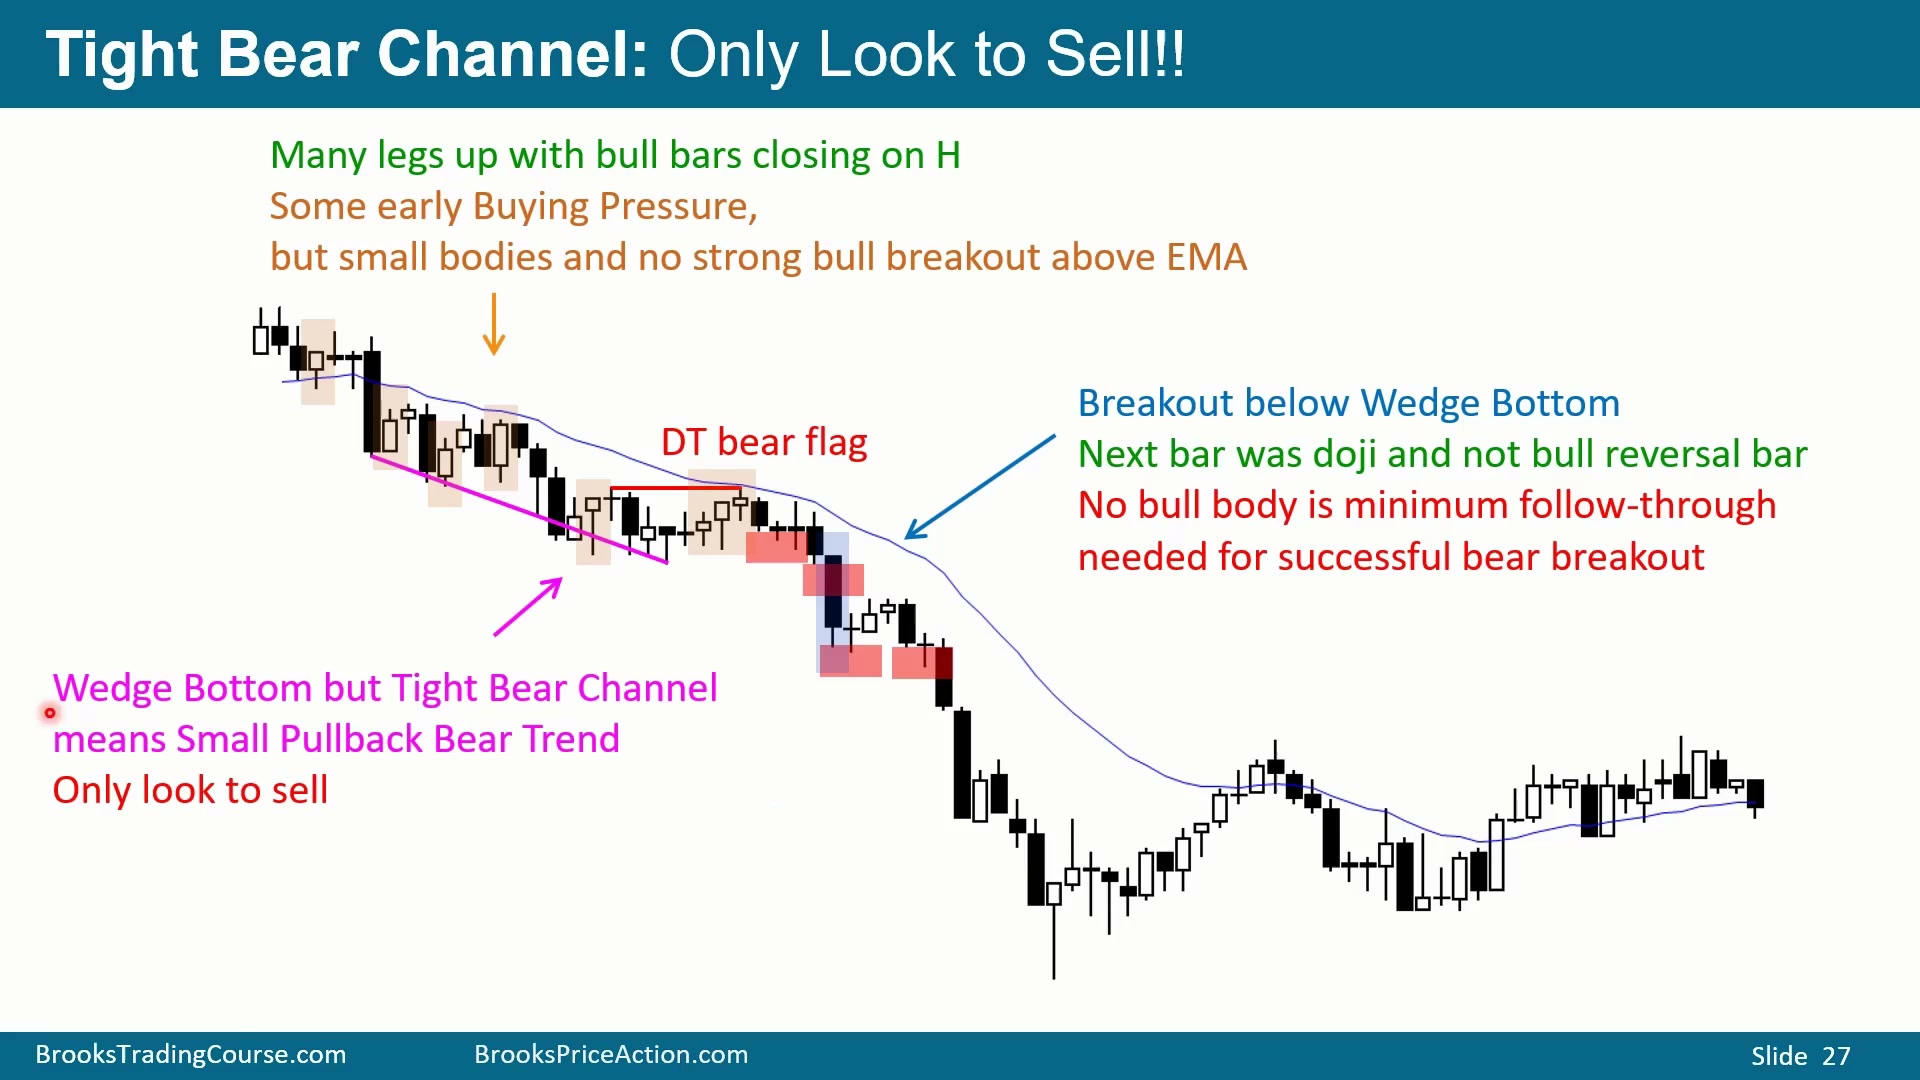
强熊趋势中总会出现很多潜在 Wedge Bottom。图中可以用大量多头 K 线画出一、二、三,但回调都很短,阴线很多,价格持续在均线下方。在这种背景中,不应找买入,只应找卖出。
另一个可能低点虽然可以画成 Wedge,但仍处于 Tight Bear Channel,反转大概率只是 minor reversal。价格两腿反弹到均线附近后,更合理的是等待从均线向下反转做空。Double Top bear flag 也是常见形态:市场两次试图向上反转都失败,交易者会在阴线下方卖出,尤其当信号发生在均线附近。
图中还出现 Wedge Bottom 下方的空头突破和 follow-through。理想 follow-through 是阴线,但关键是不能出现强多头 K 线。这里有空头突破和还可以的跟随,因此交易者会在后续 K 线低点下方卖出,押注这不是 exhaustion bar,而是 measured move down 的开始。一般 Wedge 下破有 50/50 概率失败或延续;但若背景是 Small Pullback Bear Trend,下破继续向下的概率可能提高到 60% 或 70%。
Wedge Top 后多头通常等待两腿下跌完成
Time: 48:19
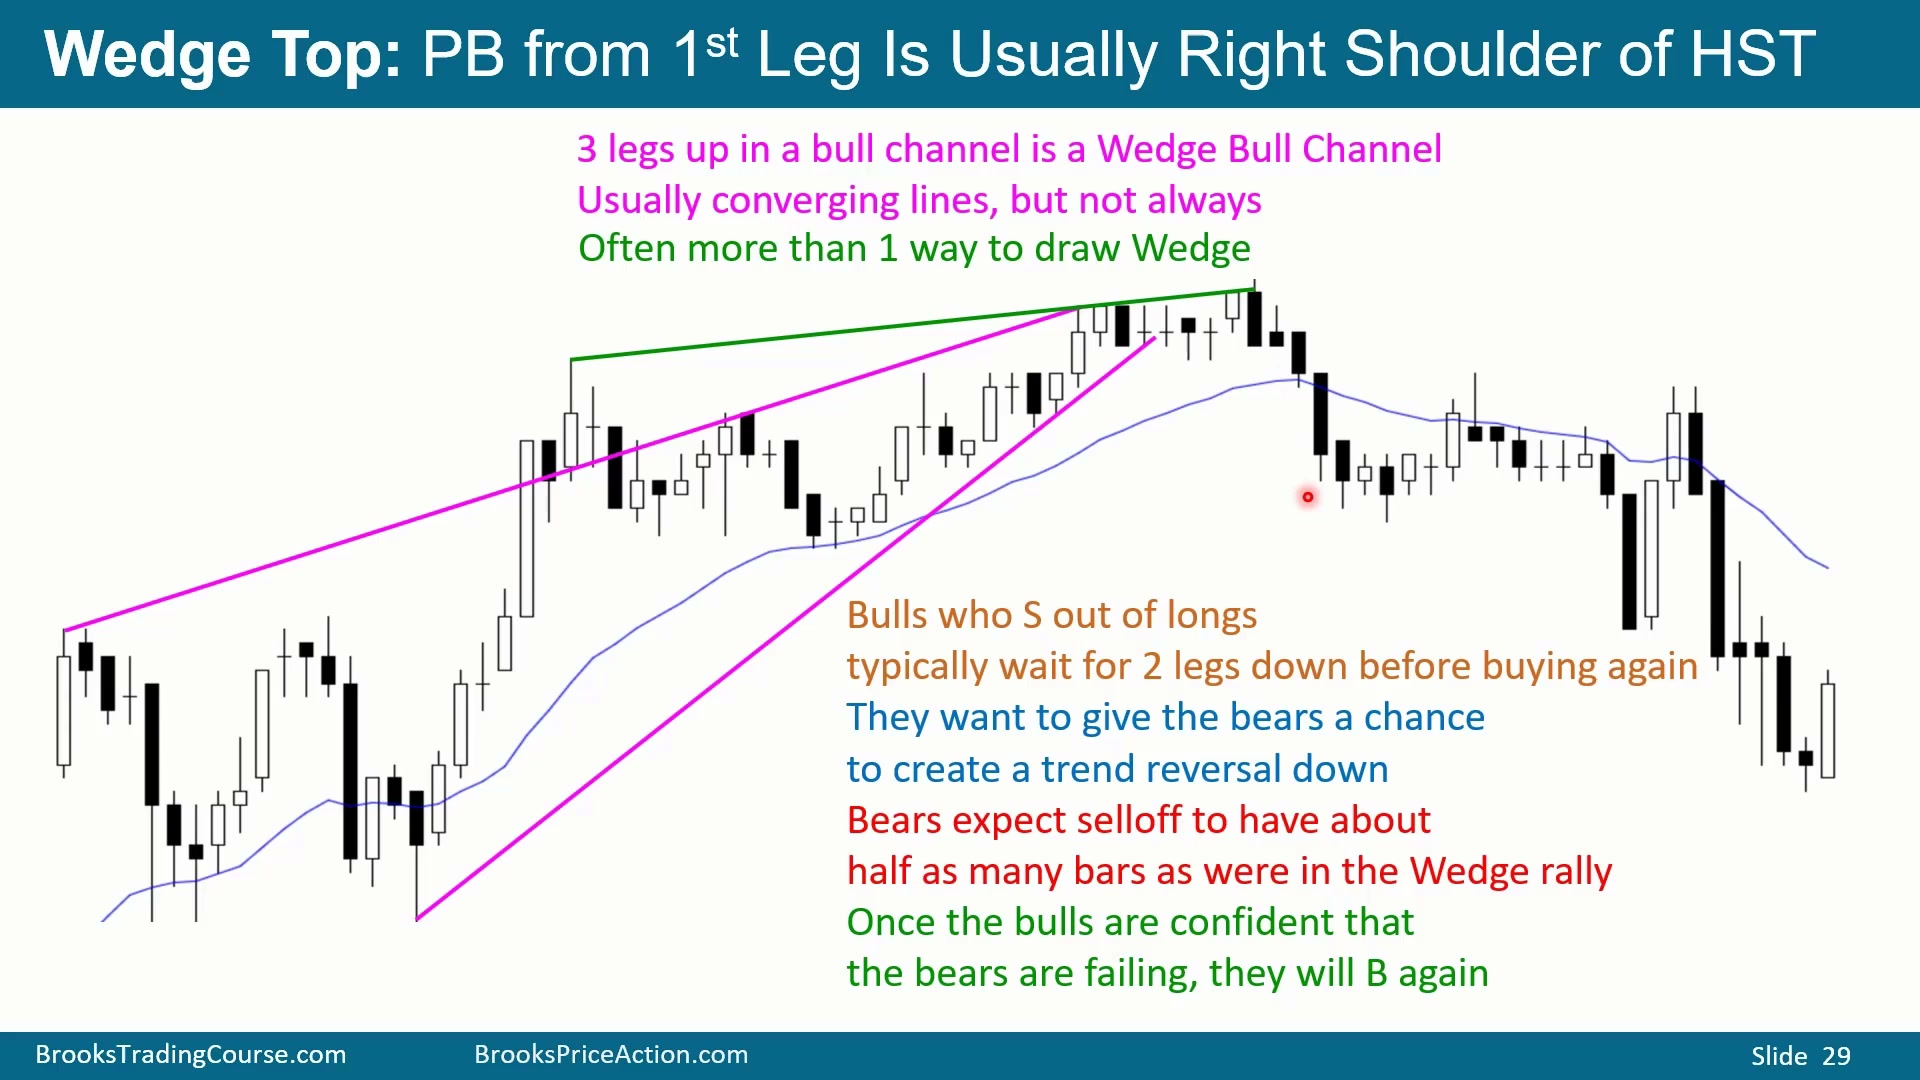
Wedge Top 的画法同样可以很多。图中有三个点,如果用 Point 1 和 Point 2 画线,Wedge 不明显;选择 Point 1 和 Point 3,则 Point 2 成为 overshoot,更容易看出 Wedge。画 Wedge 时可以选择 Point 2 或 Point 3,让其中一个形成 overshoot。
如果中间出现很强上涨,计数也可能重新开始:可以是一、回调、二、回调、三,也可以是另一组一、二、三,甚至是 nested Wedge。多头若在 Wedge 后的阴线下方退出,通常期待至少两腿下跌:一、回调、二,甚至三。下跌 K 线数量通常希望达到前面上涨 K 线数量的一半,有时会更多。
多头等待两腿下跌,是为了给空头机会证明自己能否真正反转。如果空头尝试两次仍无法把市场打下去,多头会重新寻找 High 2 bull flag 买点。图中空头已经有五根阴线组成 Tight Channel,因此大概率还要更低,不适合急着买。
Wedge 后的 Lower High 也是 Head and Shoulders Top
Time: 50:03
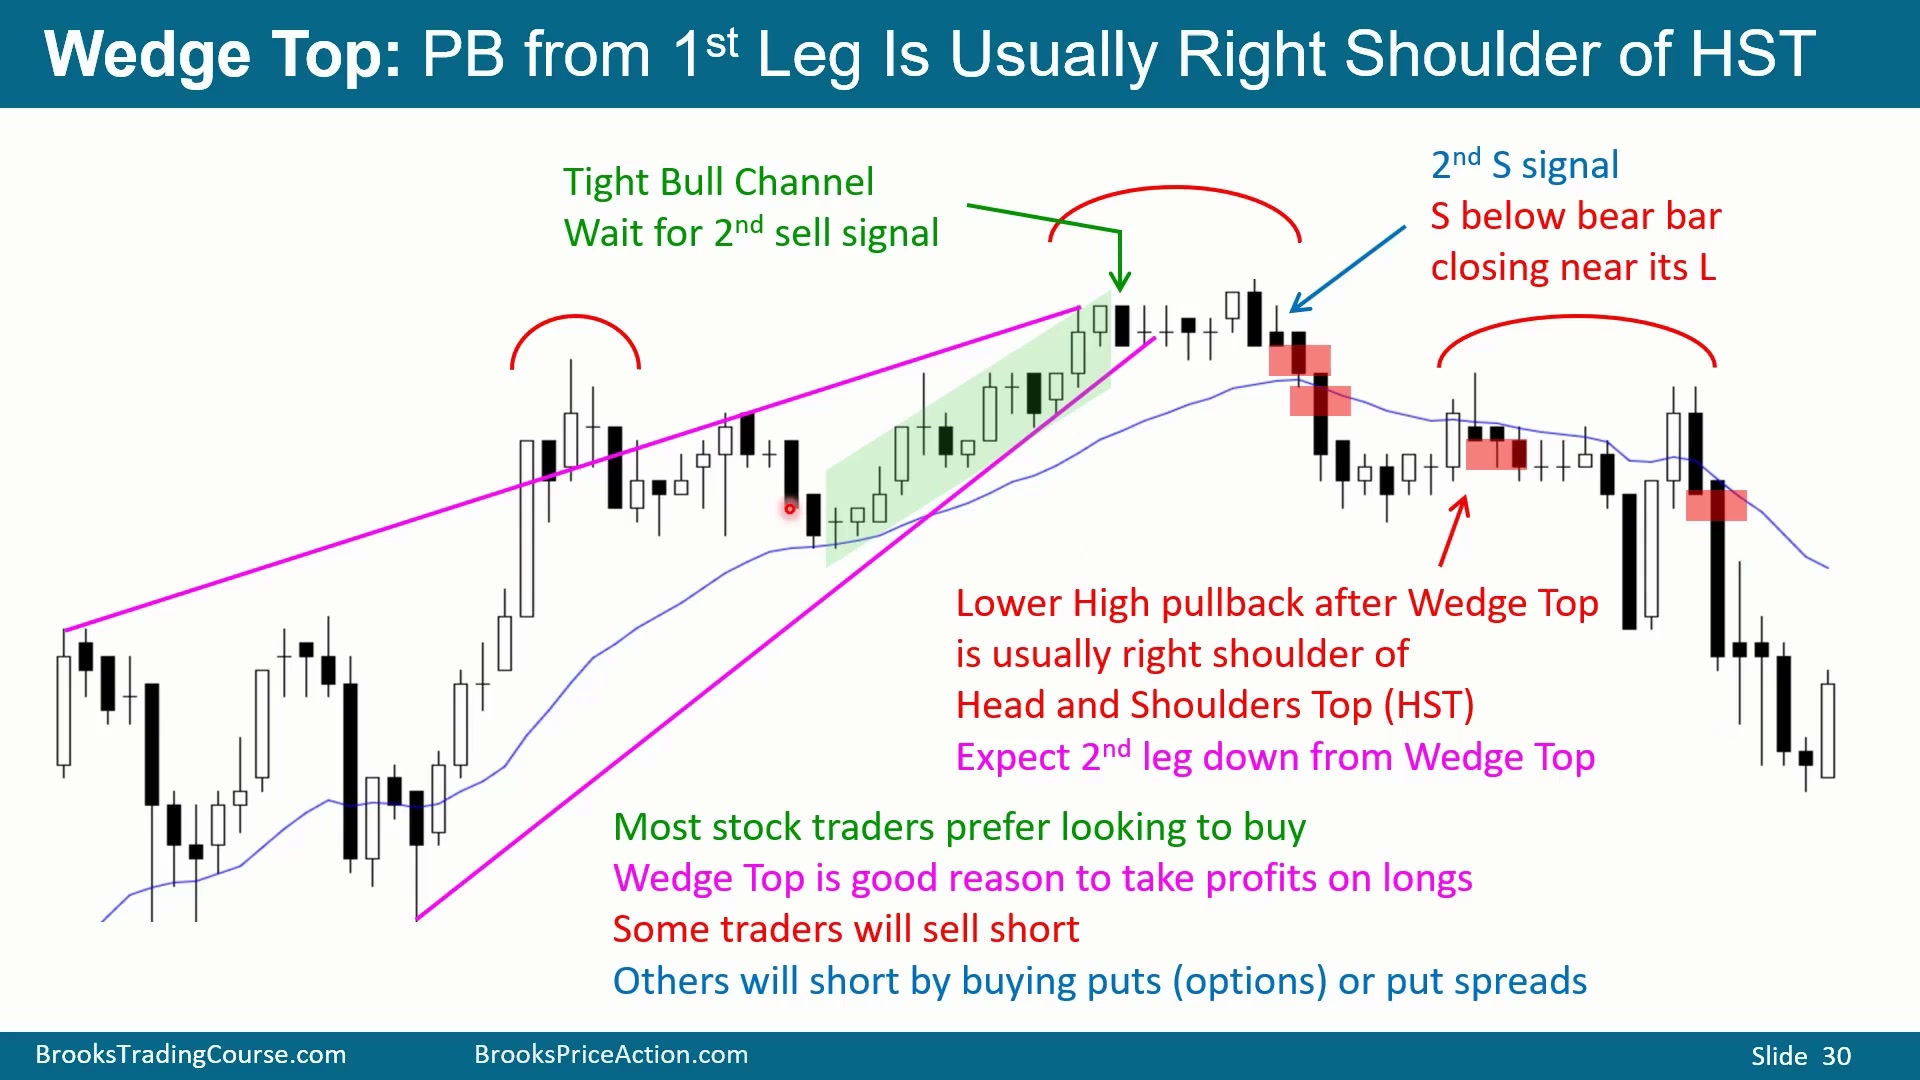
股票交易者多数更喜欢做多,不一定做空。但 Wedge 对股票交易者仍重要,因为如果这是周线图,已经持有多头的人可以把 Wedge 看成离场机会:市场可能出现深回调或反转。
图中最初是非常紧的多头通道,继续持有多头合理;但若出现第二次向下反转,并且阴线收在低位,就应考虑退出。空头会做空,有些交易者会通过买 put 或 put spread 表达空头观点。
Wedge 后出现 Lower High 或 Double Top Lower High 时,结构也变成 Head and Shoulders Top:Wedge 的第二段上涨是左肩,Wedge 高点是头部,后面的 Lower High 是右肩。它通常也是 Lower High Major Trend Reversal,因此预期至少还有第二腿下跌。
Truncated Wedge 和强 Selling Pressure
Time: 51:28
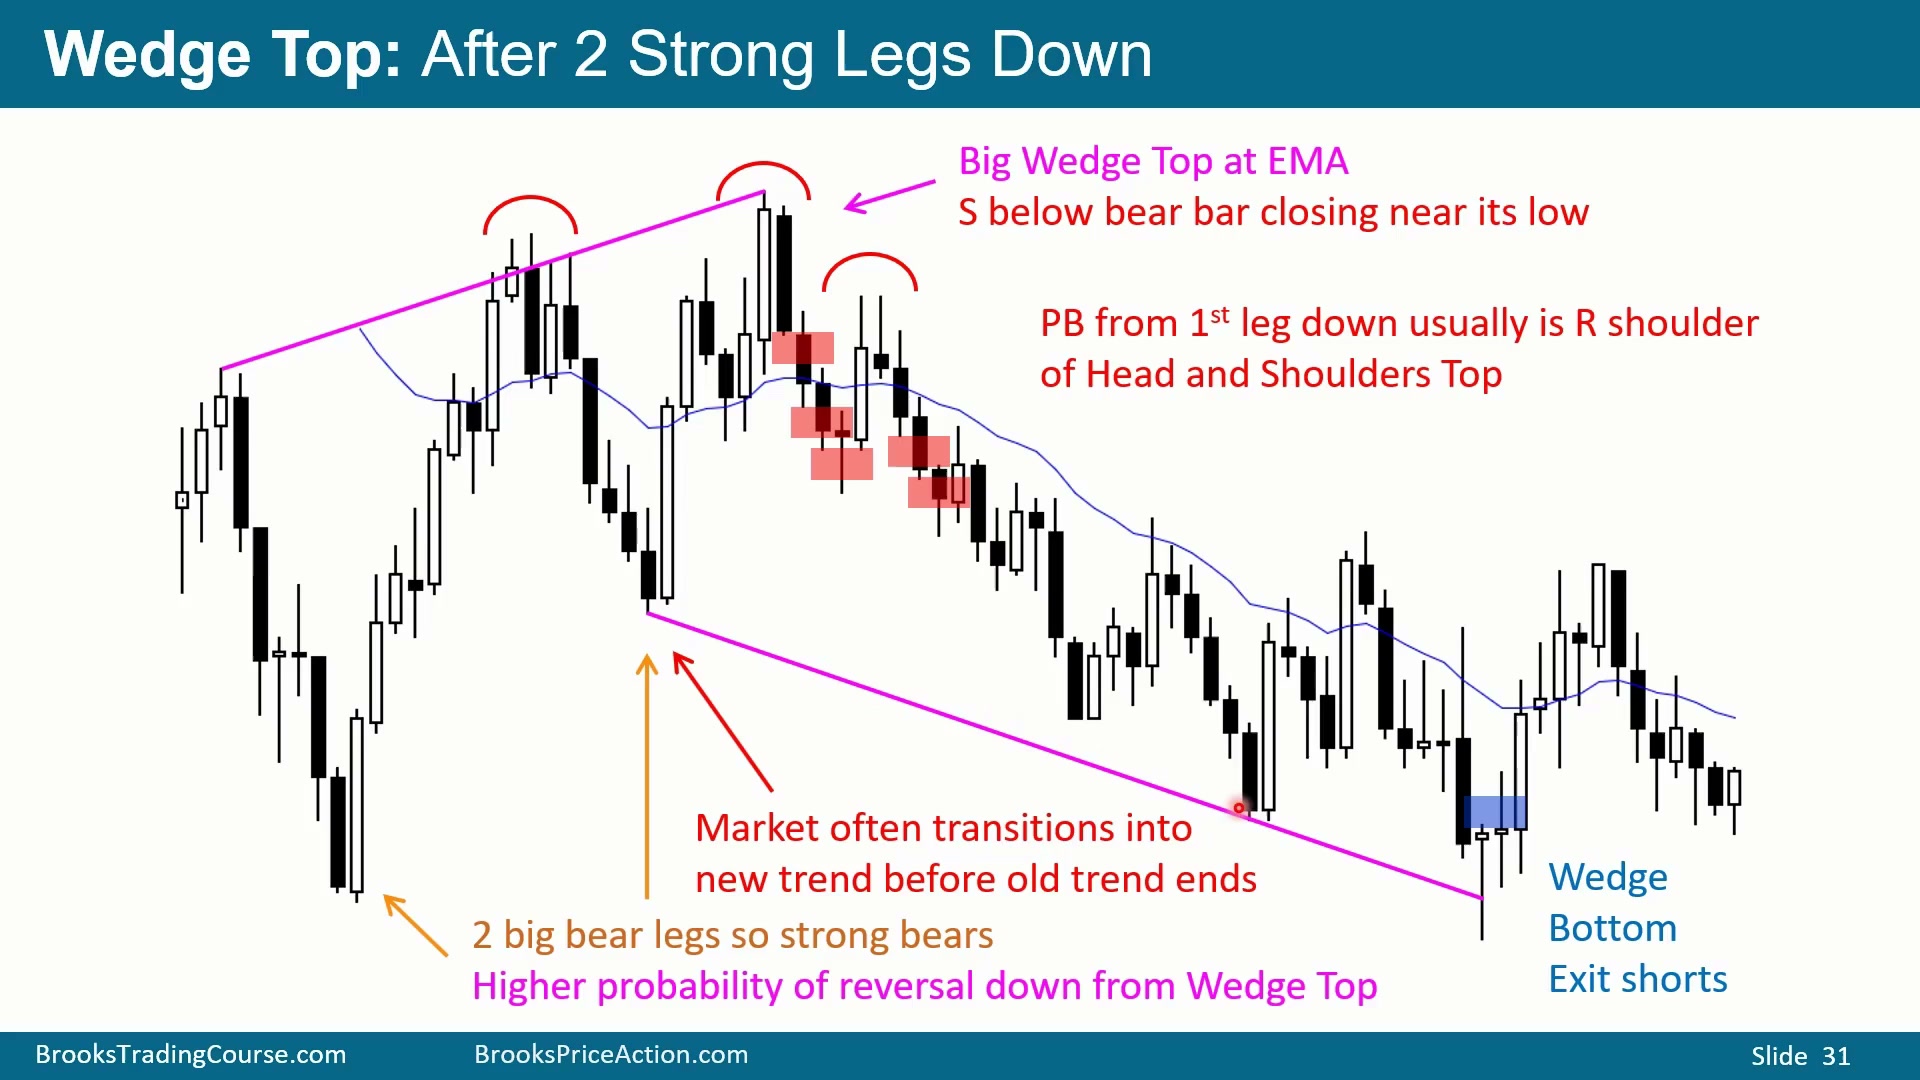
图中可以数三段上涨:一、回调、二、回调、三,并有第一次向下反转。若第三个高点没有高过第二个高点,它严格说不是标准 Wedge,可以叫 Truncated Wedge。因为前面还有两根阳线,最好等第二个 sell signal,图中后面确实出现了。
交易者会开始在收在低位或接近低位的阴线下方卖出,寻找至少两腿下跌。图中两段强下跌代表明显 Selling Pressure,提高最终向下反转的概率。第一次回调往往成为 Head and Shoulders Top 的右肩。
下方的结构也有多种看法:可以数一、二、三形成 Wedge,或另一种一、二、三。如果这是 5 分钟图且接近日内尾盘,空头在向上反转处平仓合理;即使是日线图,价格接近前低,也会吸引买家,因为之前有人在该价位买过。图中还要留意新的通道:很强的向下腿虽然未必立刻结束牛趋势,但熊通道的开始常在牛趋势真正结束前出现。
Buying Pressure 太强时不要急着做空 Wedge
Time: 53:25
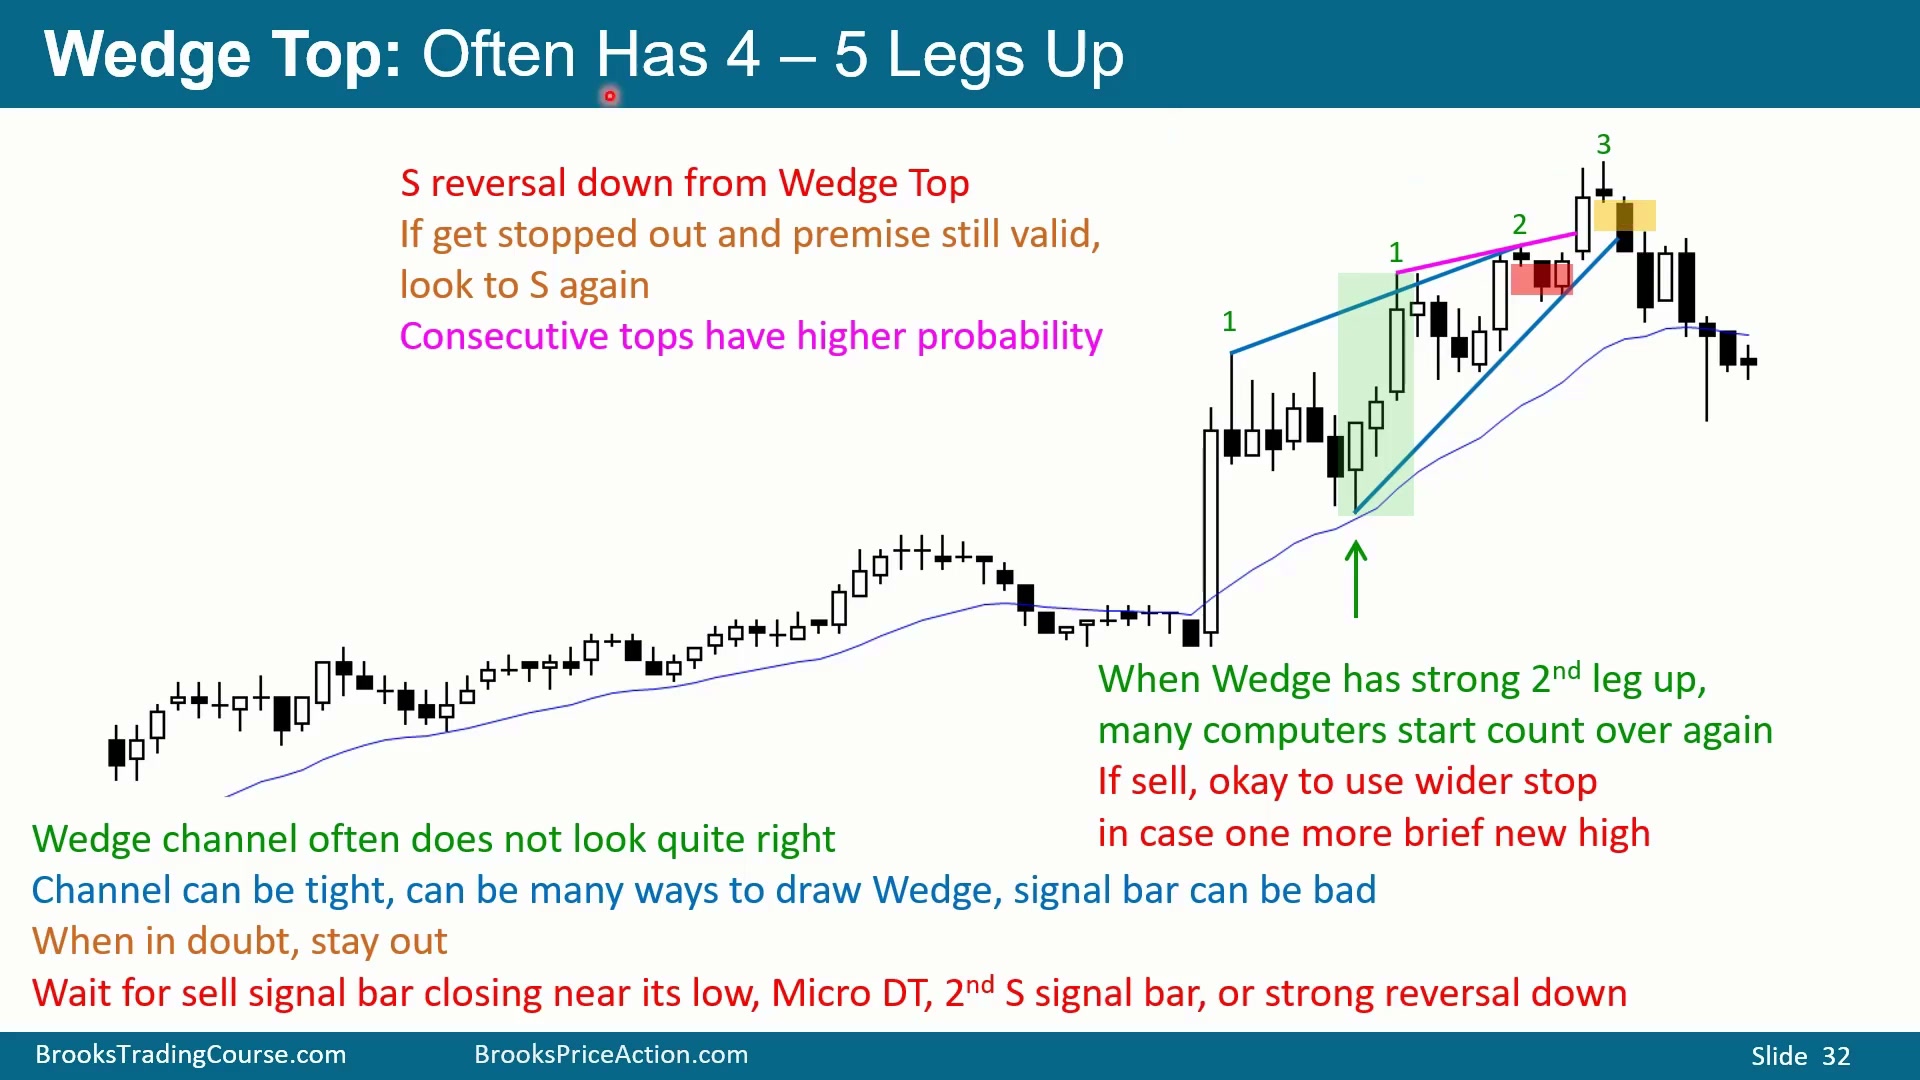
Wedge 可以有三段、四段、五段,甚至更多段。图中有强上涨、第二段、第三段,看起来可以做空;但信号只是小阴线 doji,前面又有两根大阳线,Buying Pressure 很强。这种强上涨可能让计数重新开始,因此很多时候不做第一笔空单,而是等市场横向后出现第二个 sell signal,或等更高位置再次向下反转。
后面可以看成连续尝试的 Wedge Top,概率更高。另一种画法中,强上涨让某些电脑把计数从这里重新开始,形成新的一、二、三。有些交易者会在第一处卖出,用宽止损防止新计数继续向上,并在更高处加仓;另一些会先卖,若突破某根阴线高点就退出,再在后面更高概率位置重新卖。
一般原则是,如果认为 Buying Pressure 太强、趋势太强,就不要勉强做空,等更高概率的空头信号。拿不准时,保持观望。
Wedge 上破后再反转,空头会寻找 swing down
Time: 55:05
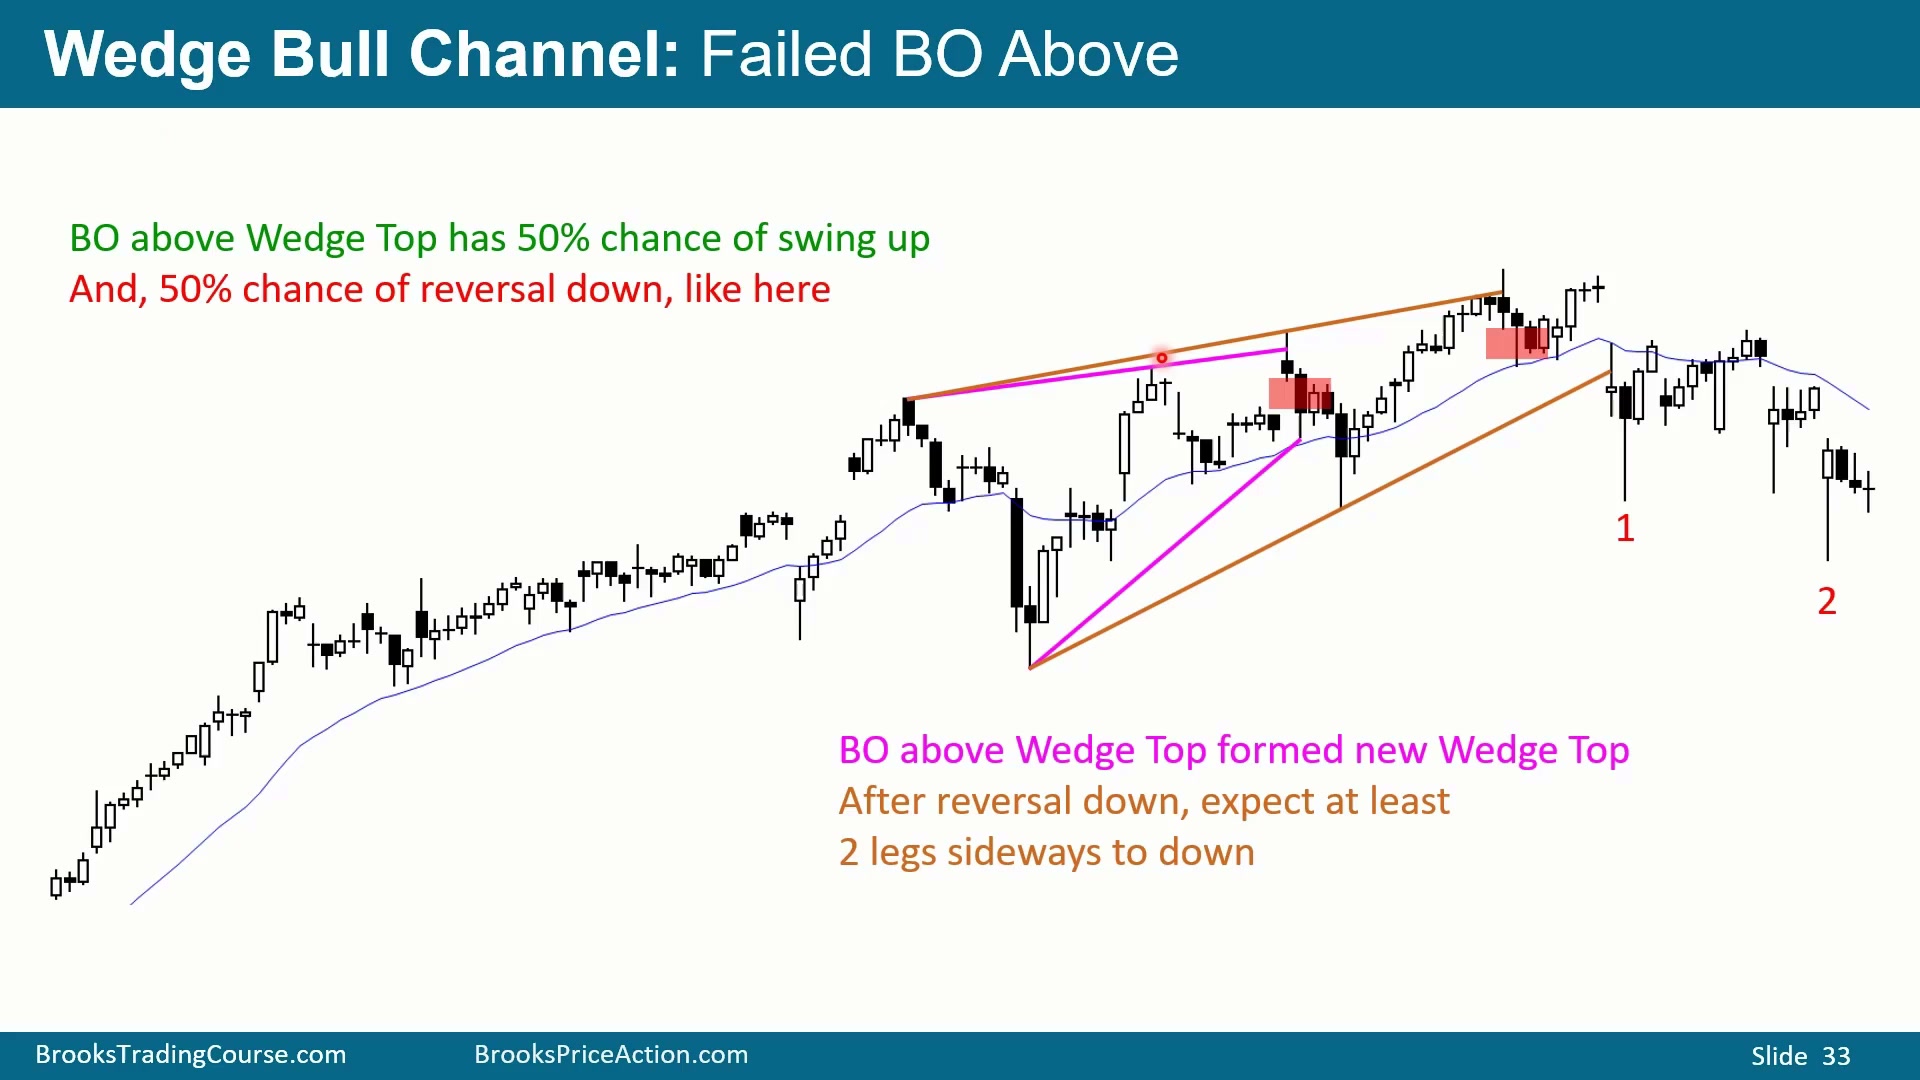
图中确实有 Wedge,也提供可信做空点。空头已经得到两小腿下跌,但市场开始向上反转。许多已经做空的交易者会在第二根阳线高点上方退出;多数人在第三或第四根上涨 K 线后会退出,因为他们开始判断 Wedge Top 没有成为真正顶部。
随后价格突破 Wedge 顶部。突破 Wedge 顶部后大约 50% 概率出现向上 swing,50% 概率突破失败并反转向下。若价格上破后又向下反转,交易者会卖出,寻找向下 swing。很多时候,市场还会形成第二种 Wedge 画法,目标至少是两腿下跌。
极强多头趋势里的 Wedge Top 应忽略
Time: 56:05
图中是 Tight Bull Channel,可以用很多方式画 Wedge:一、二、三,或另一组一、二、三。但极强多头趋势中不要找 Wedge Tops。它们一定会出现,而且会很多;但背景是 Small Pullback Bull Trend,交易者应只找买入。
买点来自收在高位或接近高位的多头 K 线。图中的突破不应被简单视为耗尽型 Buy Climax,因为 Small Pullback Bull Trend 中经常连续突破,市场可以上涨很远。强趋势中的 Wedge Top 往往只是下一段上涨前的停顿。
Wedge 后常回测顶部或形成 Double Top
Time: 57:05
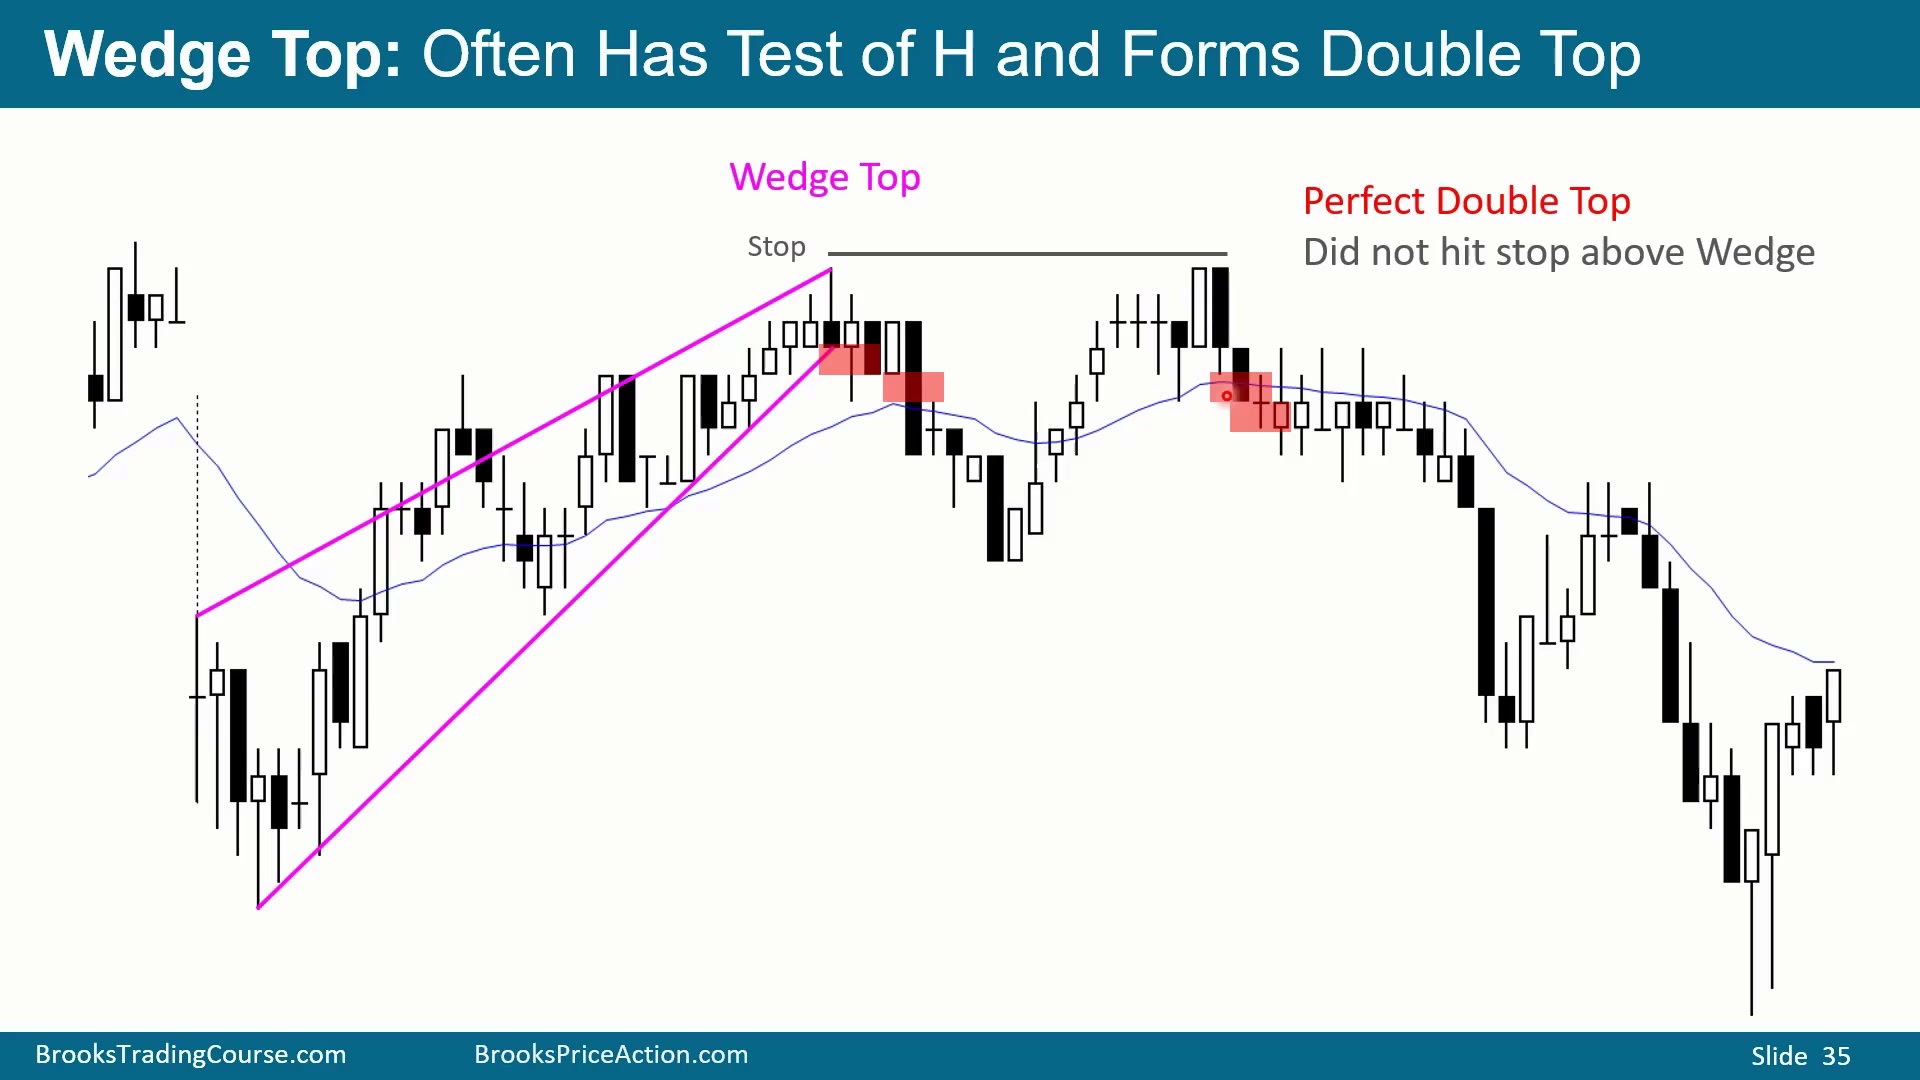
图中出现不错的阴线,可以卖出,也可以等第二个 sell signal 再卖。Wedge Top 后,市场常会回测 Wedge 顶部:有时突破 Wedge 后反转,有时接近 Wedge 顶部就反转,有时形成几乎完美的 Double Top。
若空头在 Parabolic Wedge 的上破处退出,后面又出现两次向下反转和 Double Top,那么在这些阴线下方做空是可信的。Wedge 后出现完美 Double Top 很常见,尤其当市场尝试再次上破但失败时。
Parabolic Wedge 通常是小反转,但少数会转成熊趋势
Time: 57:50
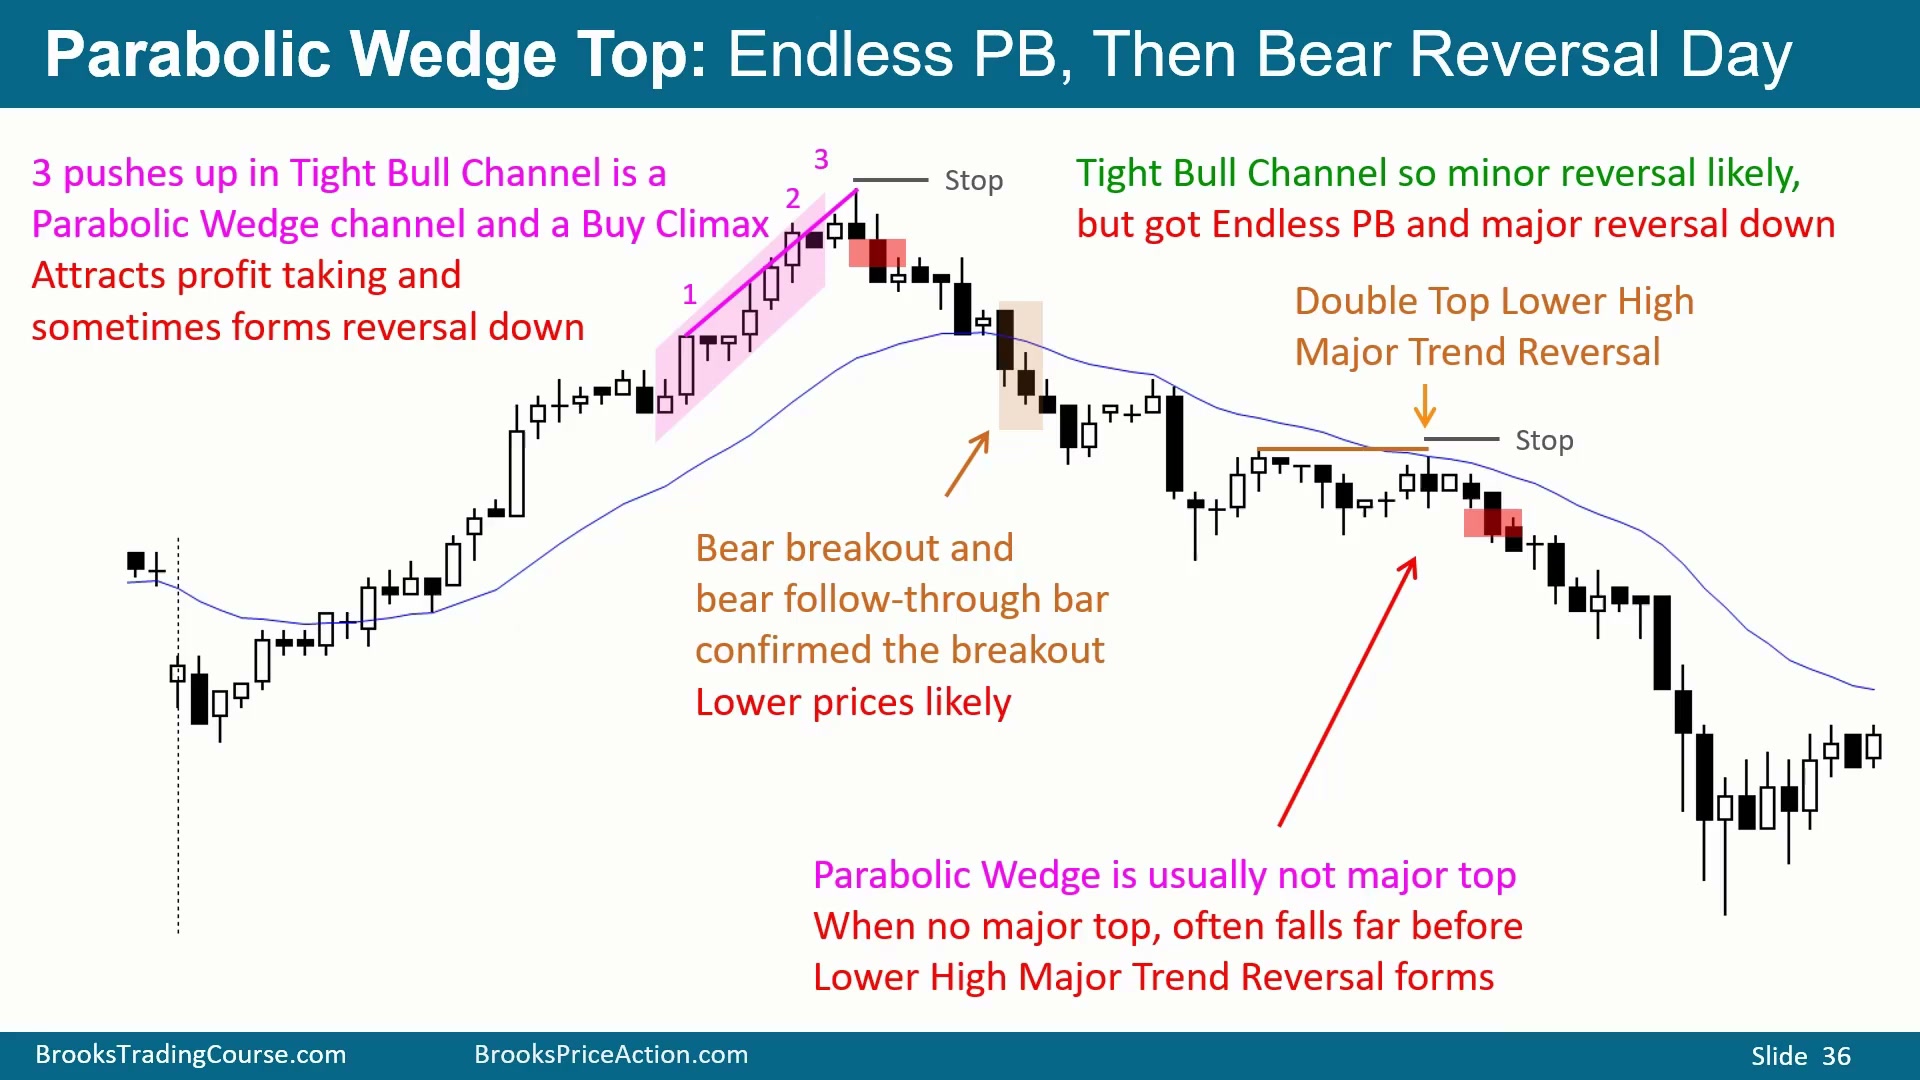
趋势强到图中这种程度时,通常不值得做空。不过在多头趋势后期,常会出现三次上推:一、二、停顿、三,随后出现合理的空头信号 K 线。多头至少应考虑退出,因为可能出现深回调;以后总能再买。部分交易者会做空,风险不大,目标是至少两腿下跌,可能回到均线附近。
这是趋势 20 到 30 根 K 线后的 Parabolic Wedge 和阴线。由于原趋势是 Tight Bull Channel,反转通常是 minor reversal,只有大约 30% 概率发展成 major reversal。图中展示了这 30% 的情况:一开始多头把回调当 bull flag,但随后出现 gap、收盘跌破前一根低点、另一个 gap,走势开始像 Small Pullback Bear Trend。空头突破和 follow-through 后,市场大概率 Always In Short,交易者从找买转为找卖。
图中空头突破 K 线收在前一根低点下方,并有空头跟随,意味着更低价格很可能出现,可能小跌,也可能大跌。随后反弹第二次尝试向上,但无法突破均线,形成可能的 Double Top bear flag。
Parabolic Wedge 本身通常不是 major reversal,而是 minor reversal;传统 Wedge 才更可能成为 major reversal。若最初没有 major reversal,交易者会寻找后面的 Lower High 是否成为真正 major reversal 的起点,有时这个 Lower High 会远低于原高点。Double Top、均线、收在低位的阴线叠加后,交易者会在阴线低点下方卖出;突破后也会继续卖阴线低点下方。
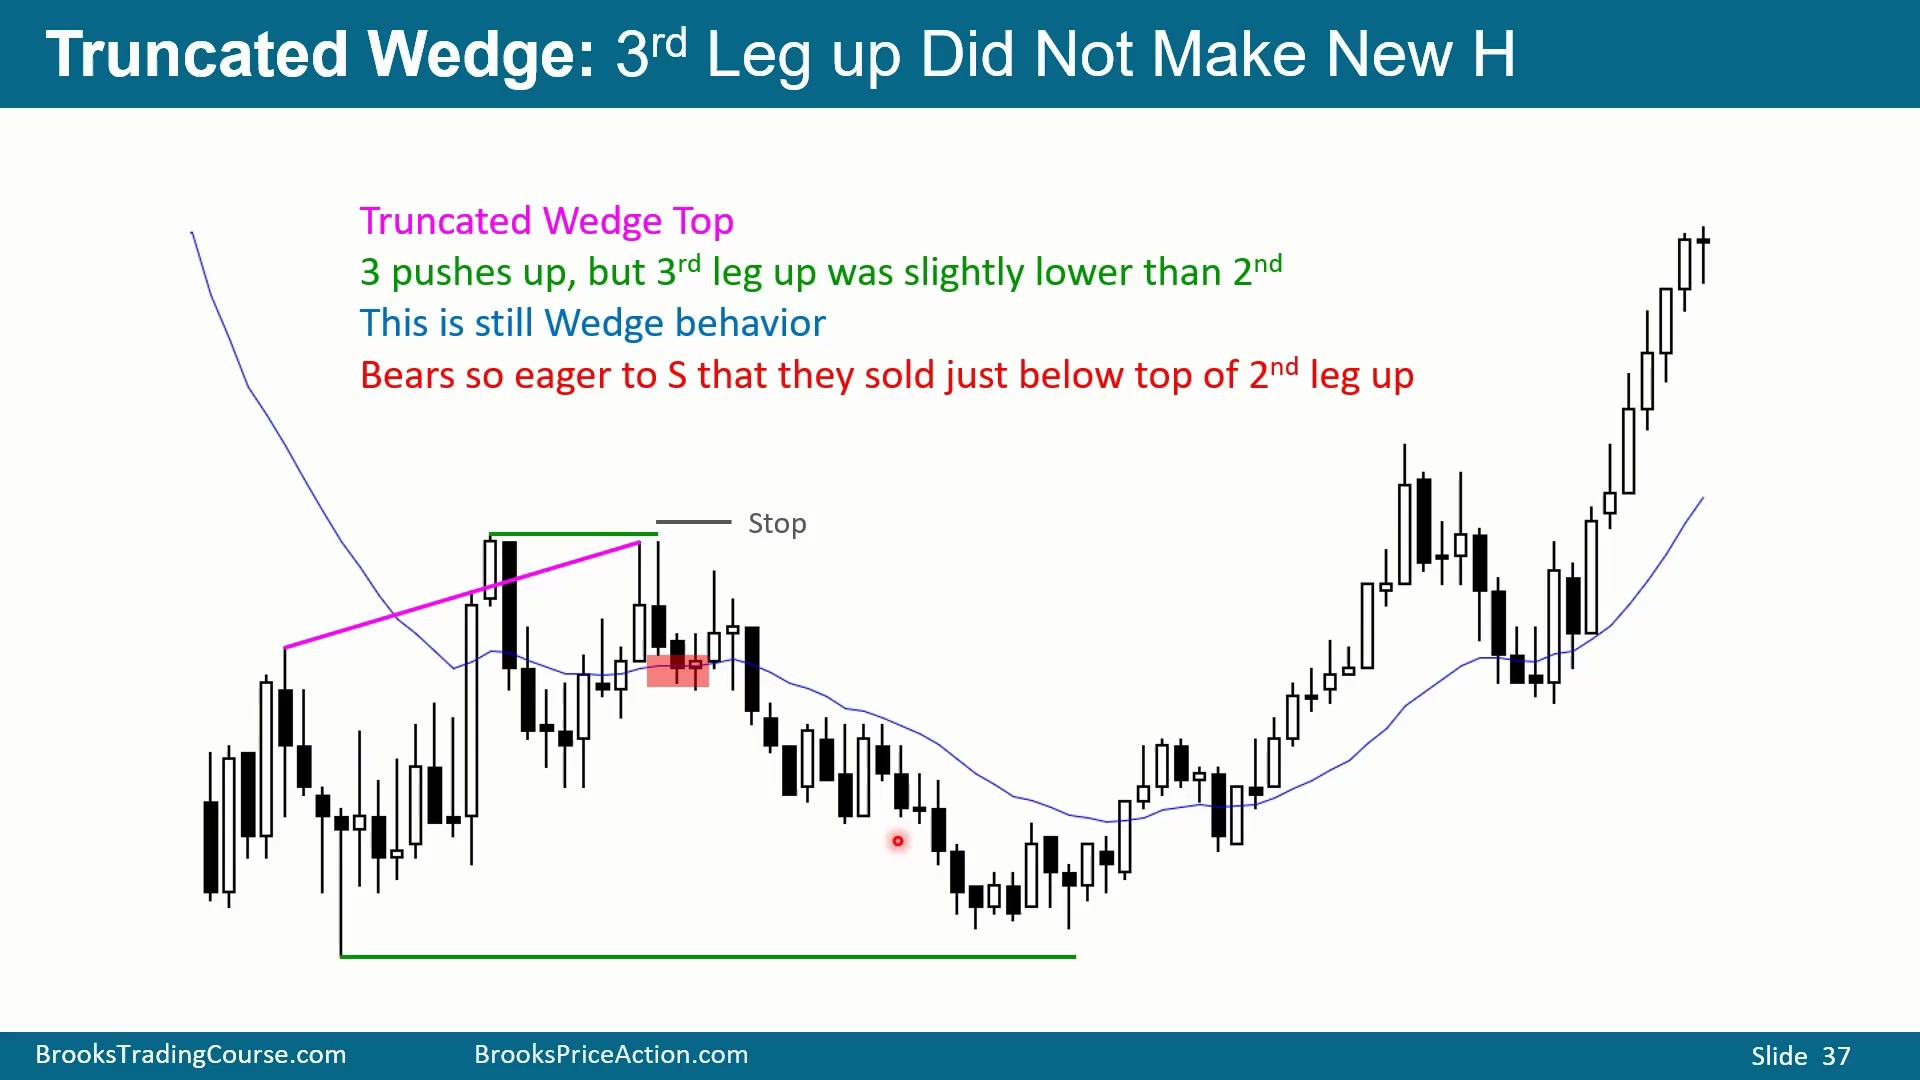
Truncated Wedge 本质上仍是三次上推失败
Time: 01:00:25
图中价格远低于均线,交易者会观察反弹是否形成 Lower High 并恢复熊趋势。横向 K 线多、阴线多、影线多,说明这不是强多头趋势。
市场出现第一段上涨、第二段上涨、第三段上涨。交易者开始预期第三腿会成为 Wedge Top 或 Wedge bear flag,并向下反转。当很多人都期待 Wedge 时,他们会在上涨途中提前卖出,防止第三腿无法突破第二腿高点。
结果第三腿没有高过第二腿,形成 Lower High,但市场心理力量仍类似 Wedge:大家都在寻找三次上推后的反转。这个结构可以叫 Truncated Wedge,也可以简单叫 Double Top;交易方式按 Wedge 处理,卖出并寻找至少两腿横向到下跌。
Brooks 课程与交易室网站
Time: 01:01:35
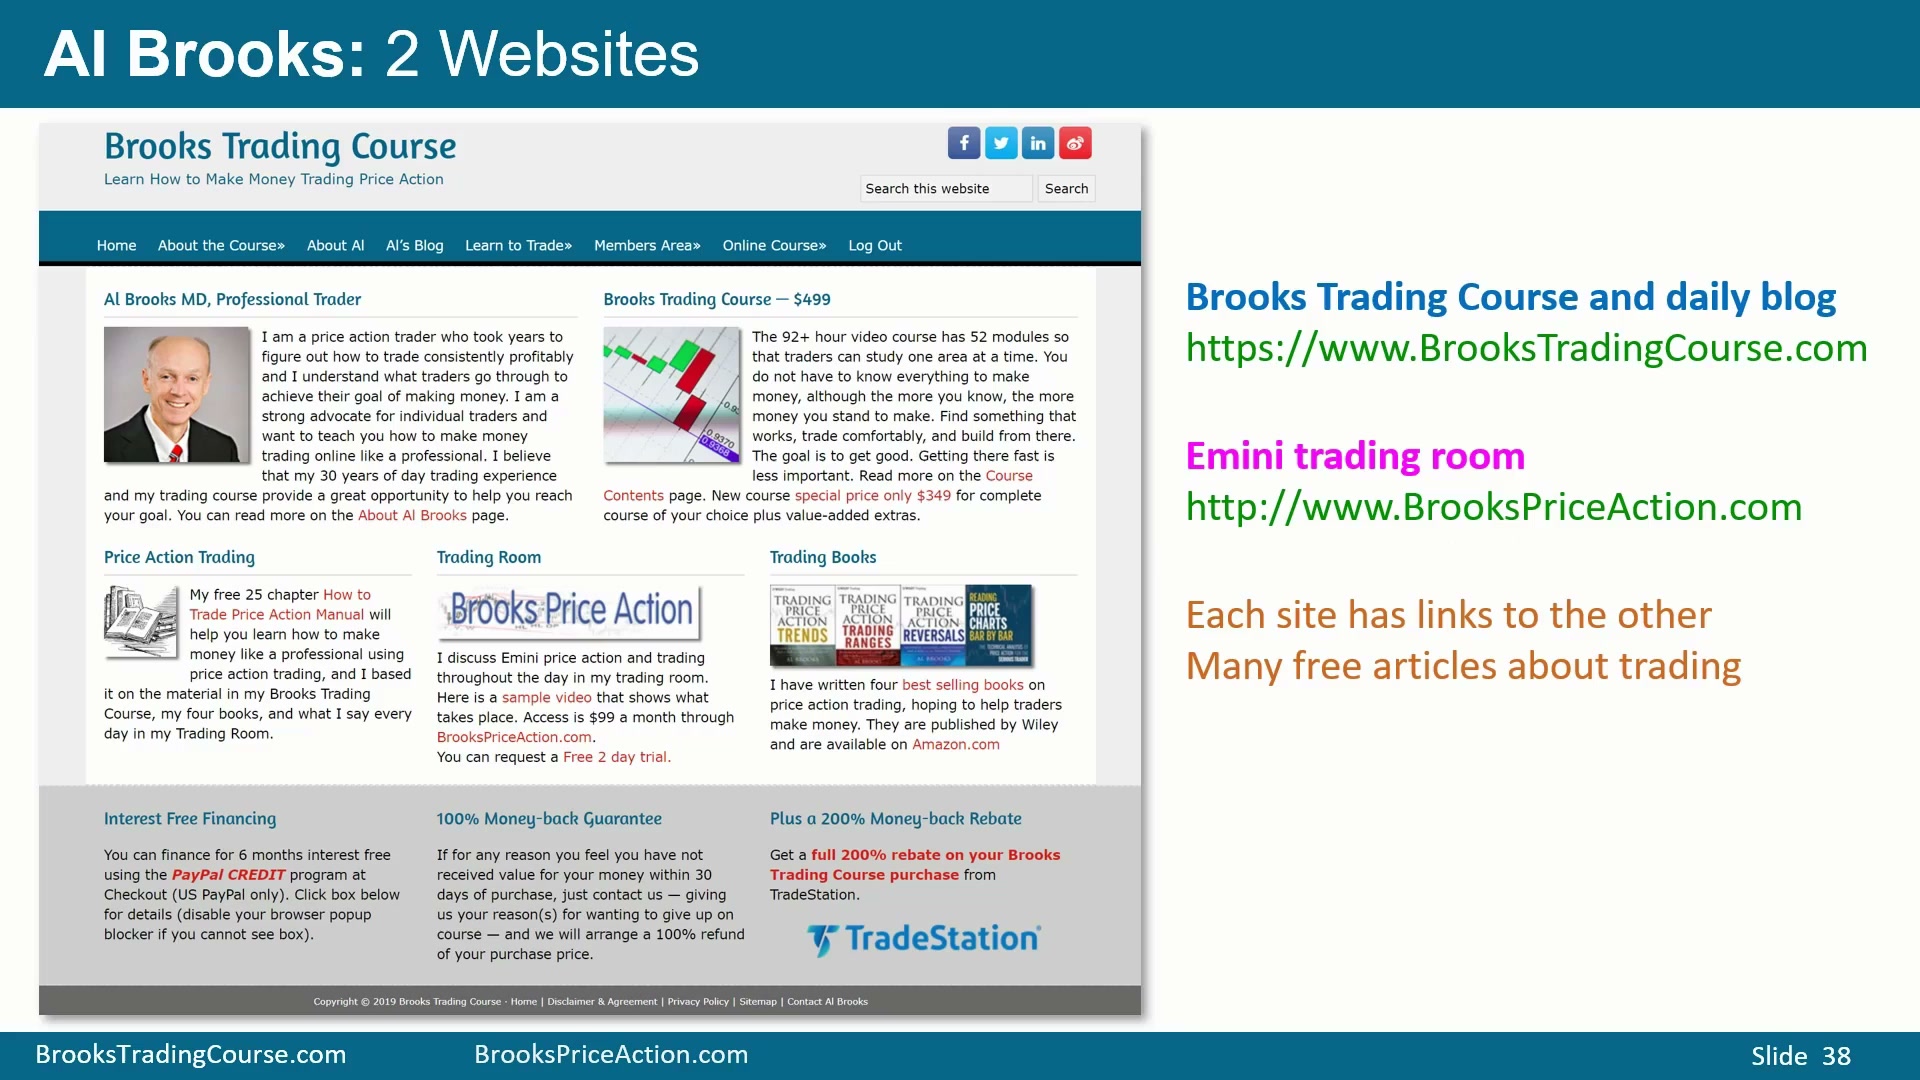
相关资源有两个。Brooks Trading Course 网站就是这套课程所在的网站,同时也放有每日博客;另一个是 Brooks Trading Room,地址是 brookspriceaction.com。
三种形态的交易结论
Time: 01:01:53
价格行为就是图表上的移动。交易者寻找重复形态,并随着经验增长,开始预判形态形成后市场可能如何反应。
第一种形态是强多头趋势。趋势足够强时,只找买入。第二种形态是强多头趋势中的回调,同样只找买入,但要分辨 High 1、High 2、High 3、Wedge bull flag 和信号 K 线质量。第三种形态是 Wedge。Wedge 可以是顶部、底部、bull flag 或 bear flag;它可以反转,也可以在强趋势中失败。交易关键是先判断背景强弱,再决定是顺势买、等待第二信号,还是在 Wedge 后寻找反转。