al-brooks-course
48K - Trading the End of the Day
Readable self-study lecture notes for 48K - Trading the End of the Day.
Source Media
尾盘要防范牛陷阱、熊陷阱和高周期磁力
Time: 00:12
牛陷阱是市场诱使交易者在不该买的时候买入;熊陷阱则是诱使交易者在不该卖的时候卖出。尾盘剩余时间少,许多交易者急于抓最后一段走势,因此陷阱更容易造成追高或追空后的快速反向。
尾盘还必须关注更高周期支撑和阻力。这里的更高周期指任何高于当前交易图表的周期。如果交易者看 5 分钟图,60 分钟图、日线、周线、月线的关键价位都可能重要。临近收盘时,市场常常会被这些更高周期的收盘、前高、前低或开盘价吸引。
嵌套 High 2 失败会形成牛陷阱
Time: 00:47
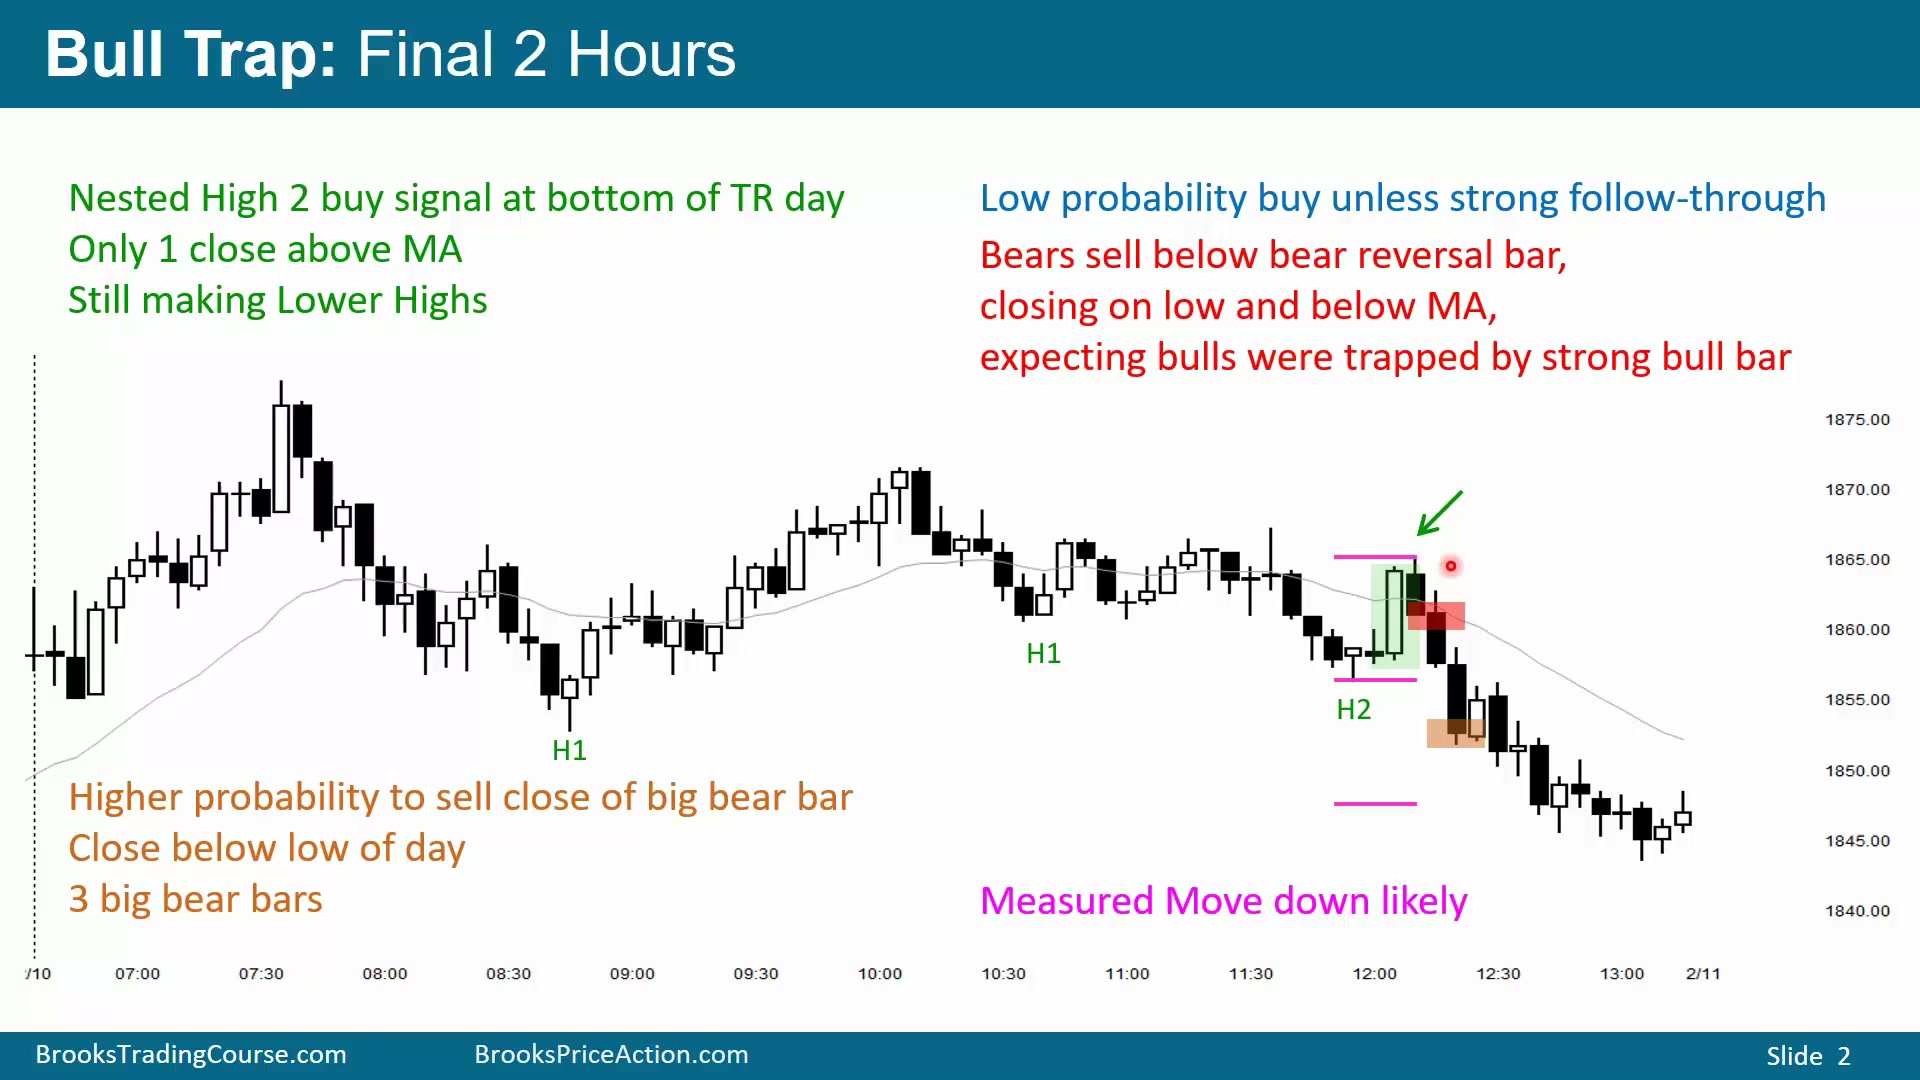
图中的买入形态是嵌套 High 2。小级别上有两段下跌:第一段下跌、回调、第二段下跌;它又包含在更大的两段下跌中。如果切到 15 分钟图或 60 分钟图,这可能只是一个简单的 High 2 买入形态。
这个位置本身不错:震荡区间日底部、Higher Low、嵌套 High 2,都支持向上反转。但它还不是 Buy The Close 上涨,因为当时只有一根 K 线收在均线上方。继续上涨和失败反转大约各有 50% 机会,交易者还需要再看到一根好的阳线和跟随 K 线。
图中没有出现跟随阳线,反而出现空头反转 K 线。这说明多头被困住了:他们以为 High 2 会带来上涨,结果市场向下反转。空头知道多头被套,很多空头会在这根阴线下方卖出,也有人会等两三根阴线收盘后再卖收盘。这里就是牛陷阱,市场诱使多头在高位买入,随后反转。
等待确认通常胜率更高。多头若想买 Buy The Close,最好先看到两三根强阳线;空头若想卖这个反转,也可以等两三根阴线确认。由于这是反转,空头会寻找下方支撑目标,例如 measured move。该反转也可以看作与前高形成双顶,measured move 目标可能从不同高点计算,目标区域大致在当日低点附近。
紧多头通道中的第一次做空常是熊陷阱
Time: 03:00
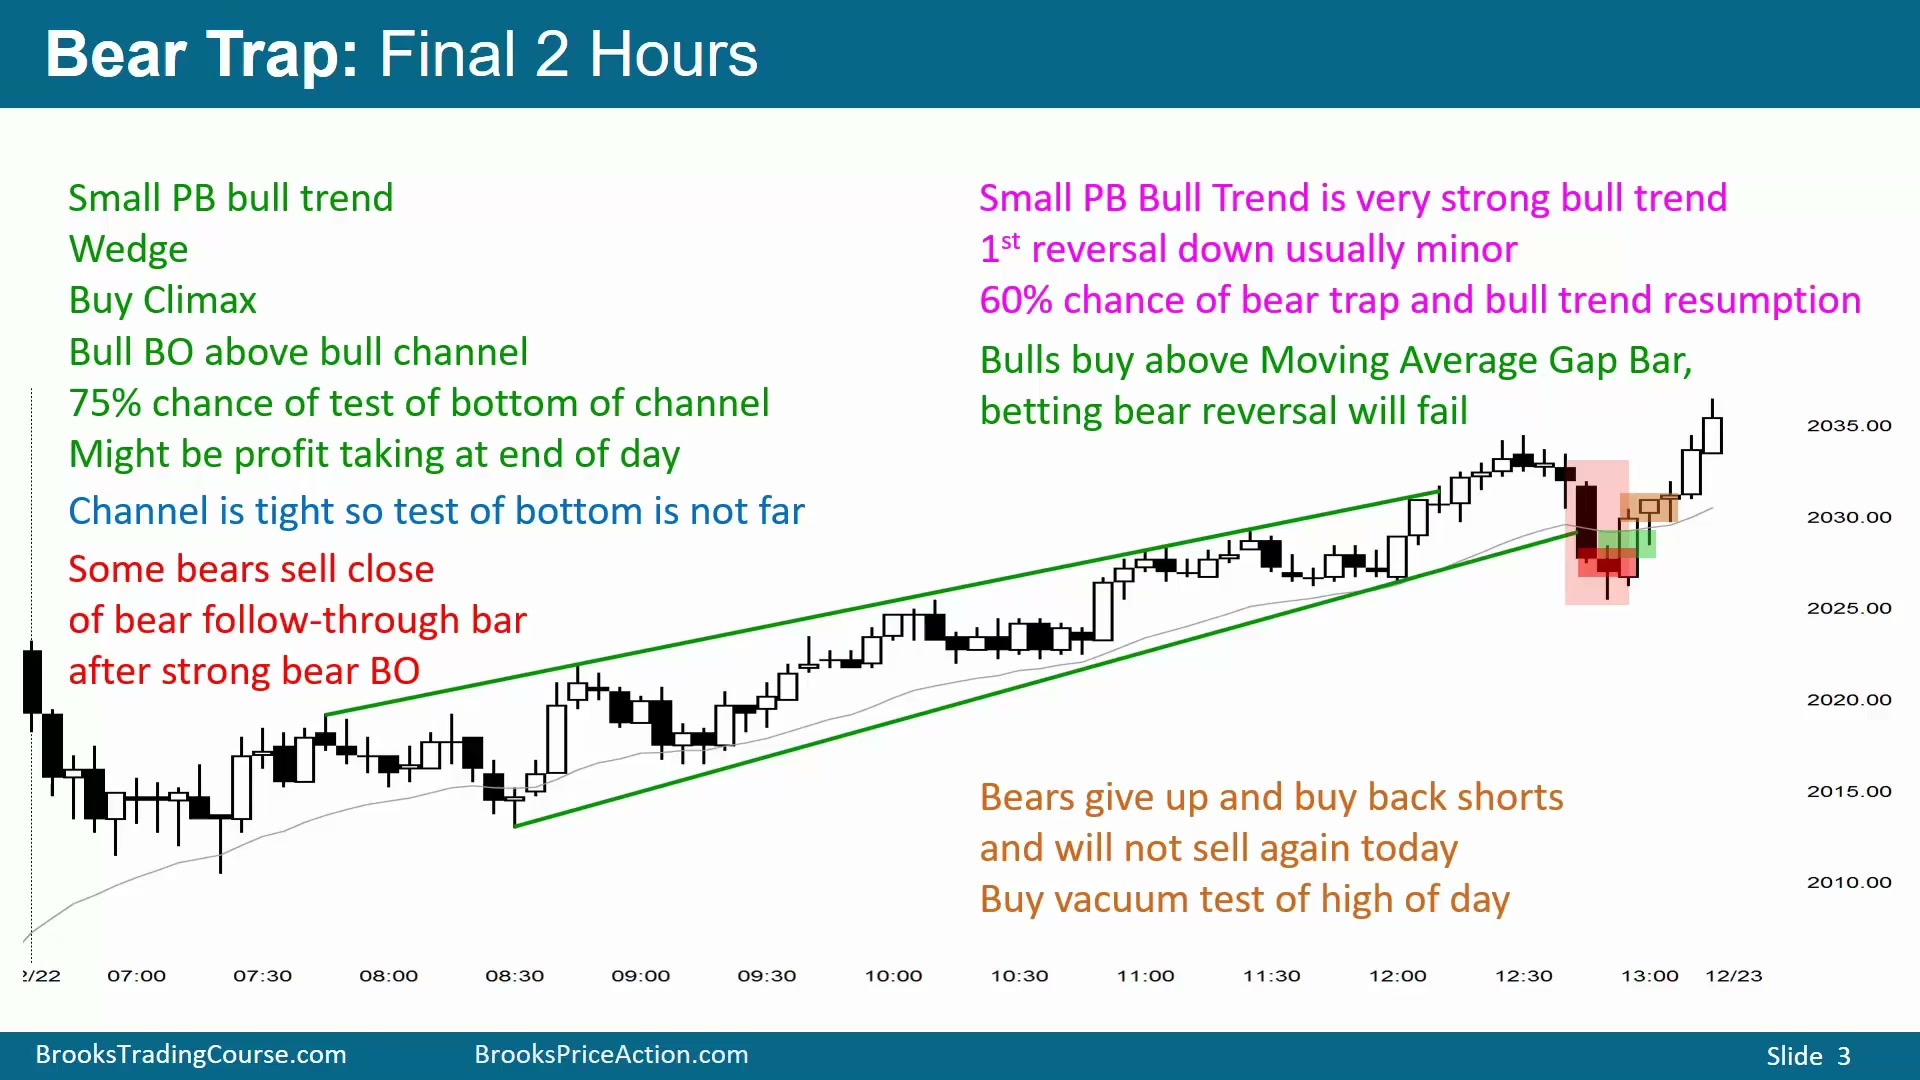
图中反转后有阴线,也有跟随阴线,但背景还包含其他因素。此前是 Small Pullback Bull Trend,也可以说形成楔形,或者说多头向上突破多头通道。通道上方突破后,大约 75% 的概率会在 5 根 K 线内向下反转到通道底部;多头获利了结,空头也会尝试把它做成一段下跌,这些判断都成立。
但在图中的案例中,通道很紧,目标并不远,而且市场每次接近均线时,多头都重新买入。Very Tight Bull Channel 后的第一次向下反转通常是小反转,结果更可能是多头旗形后趋势恢复,或进入震荡区间;它直接转为空头趋势的概率很小,通常需要至少一个 Micro Double Top 才更可信。因此这里更可能是熊陷阱,而不是新空头趋势的开始。
空头当然可以卖收盘或在阴线下方卖出,但更合理的预期是:这只是测试支撑、测试最后多头旗形底部的轻微反转。强多头趋势中,尾盘或 11 点、12 点附近经常出现较大回调;它既是多头获利了结,也是空头尝试反转趋势。但 Small Pullback Bull Trend 直接变成空头趋势的概率很小。
图中还有 Moving Average Gap Bar:某根 K 线高点与均线之间存在缺口,空头第一次把 K 线压到均线下方。第一次空头突破通常会失败,所以多头会把它视为潜在熊陷阱,预期市场要么横向,要么恢复上涨。随后出现跌破通道底部失败和阳线,多头会在阳线高点上方或第二根 K 线收盘买入,期待尾盘恢复上涨。
空头看到反转失败会放弃。他们原本希望 Sell The Close,但市场开始向上反转,空头会在阴线上方 3 到 4 ticks 或阳线上方 1 tick 止损。多头知道空头要回补,也知道空头当天不太会继续卖出,于是也会买入,推动尾盘恢复上涨。
反转日尾盘常测试开盘价和当日低点
Time: 06:29
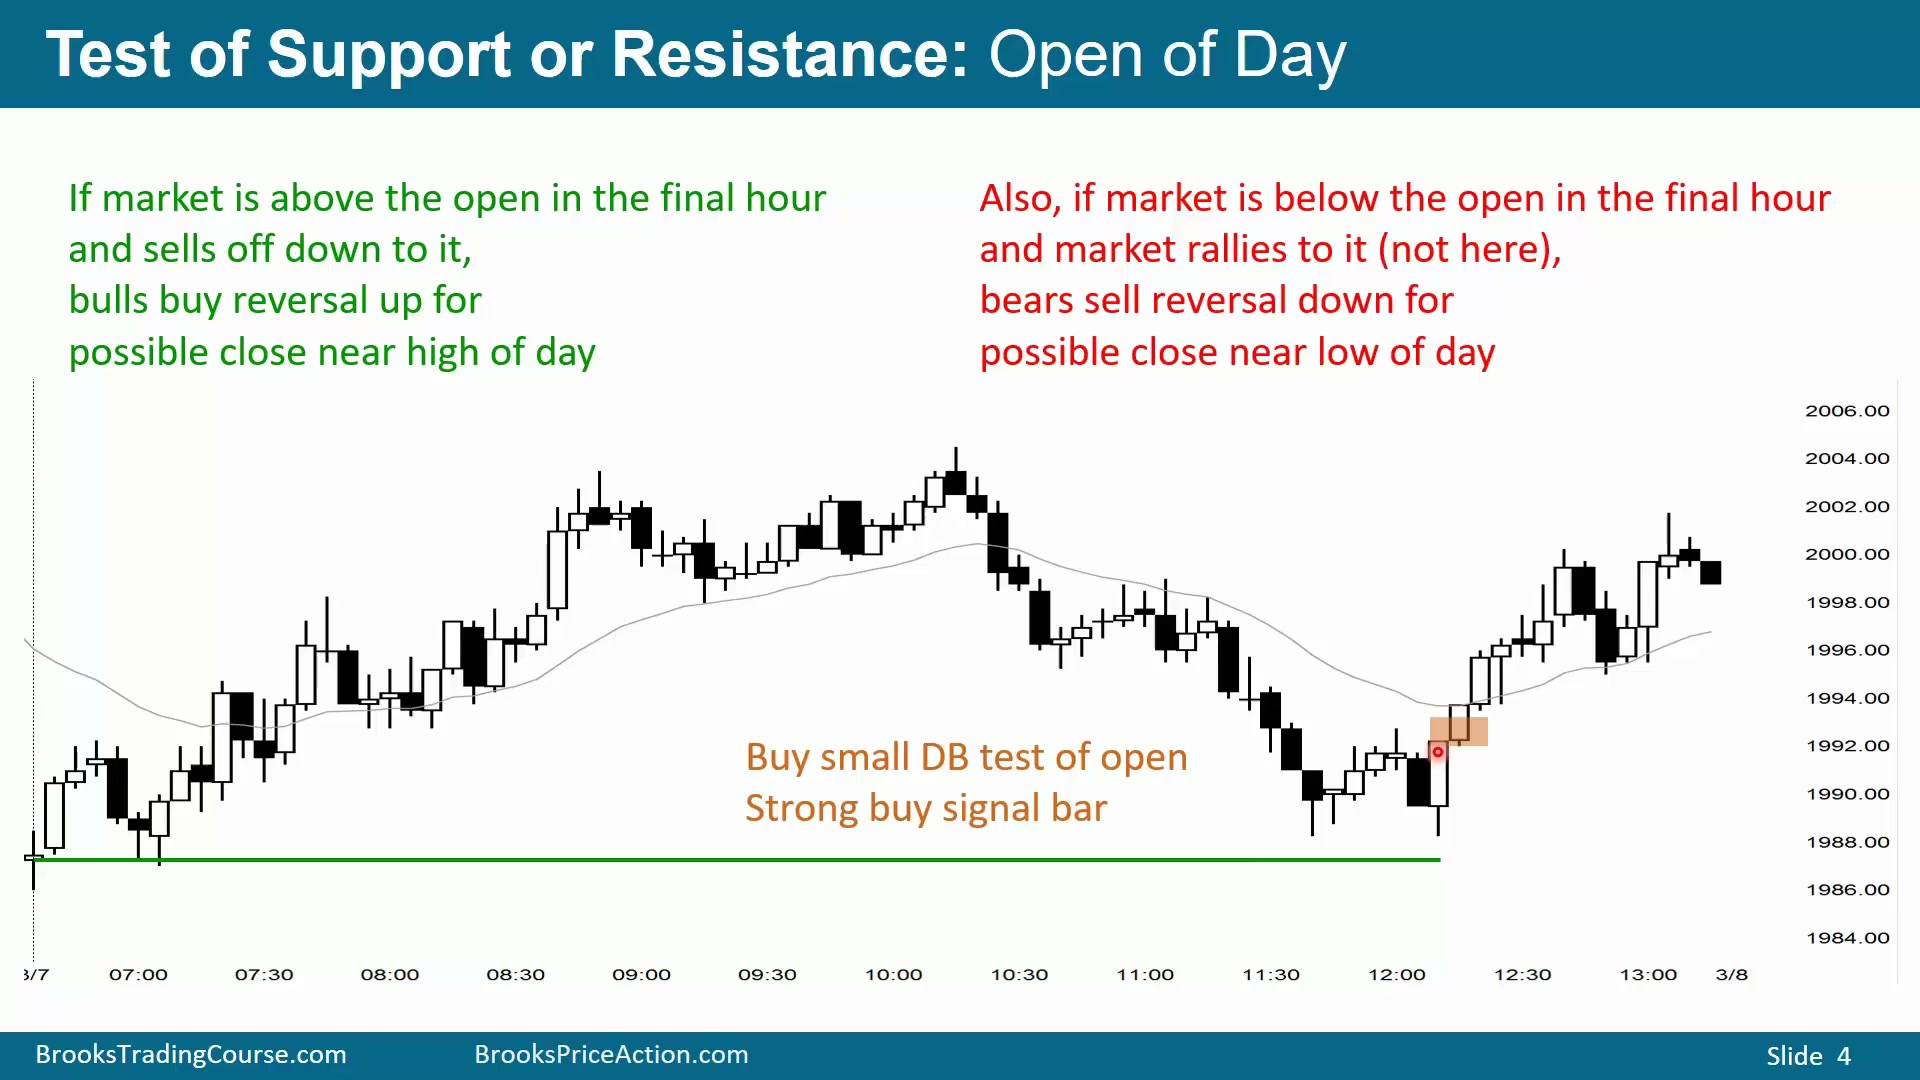
尾盘经常测试支撑和阻力。若当天前半段是多头趋势,后半段开始形成空头趋势,市场可能正在测试当日开盘价、当日低点,或此前 Higher Low。价格接近这些目标时,交易者必须准备反转。
图中的 Sell The Close 可能开始得太早,因此未必能一路维持到收盘。如果价格在支撑处形成双底,例如测试当日开盘价,同时出现质量好的阳线,实体足够大并收在高位,就要准备买入反转。后面若出现第二次买入信号,比如底部的 Micro Double Bottom,也仍然合理。
反转日本质上通常是震荡区间日。前半天大涨、后半天大跌,意味着市场出现大幅困惑,最终往往转为横向。除非下跌明显跌破当日低点并持续很远,否则这种反转日不太可能远远跌破当日低点,反而经常在低点附近反转。震荡区间日如果在低点附近出现第二次买入,是合理的买入。
反过来,如果尾盘市场低于开盘价,而当天又是震荡区间日,最后一两个小时常会尝试回测开盘价。图中的情况是市场在一个已经转成震荡区间日的环境里位于开盘价上方,尾盘向下测试开盘价;到达那里后,市场可能横向、反转,也可能跌穿。图中出现 Micro Double Bottom 和好的阳线,看起来更像会向上反转。尾盘的日内开盘价、当日高低点和前面关键高低点都非常重要。
高周期支撑阻力会改变尾盘磁力
Time: 08:40
尾盘不仅要看当天的支撑阻力,也要看更高周期的关键价位。随着日线、周线或月线即将收盘,5 分钟图最后几根 K 线会影响更高周期 K 线的形状,因此价格常会被更高周期的开盘价、收盘价、前高或前低吸引。
交易者在尾盘看到强反转或收盘趋势时,应先问一个问题:市场是否正在靠近更高周期磁力。如果答案是肯定的,目标附近的价格行为可能突然改变,趋势可能加速到目标,也可能到达后停止、反转或横向。
日线收盘和昨日收盘是尾盘磁力
Time: 08:44
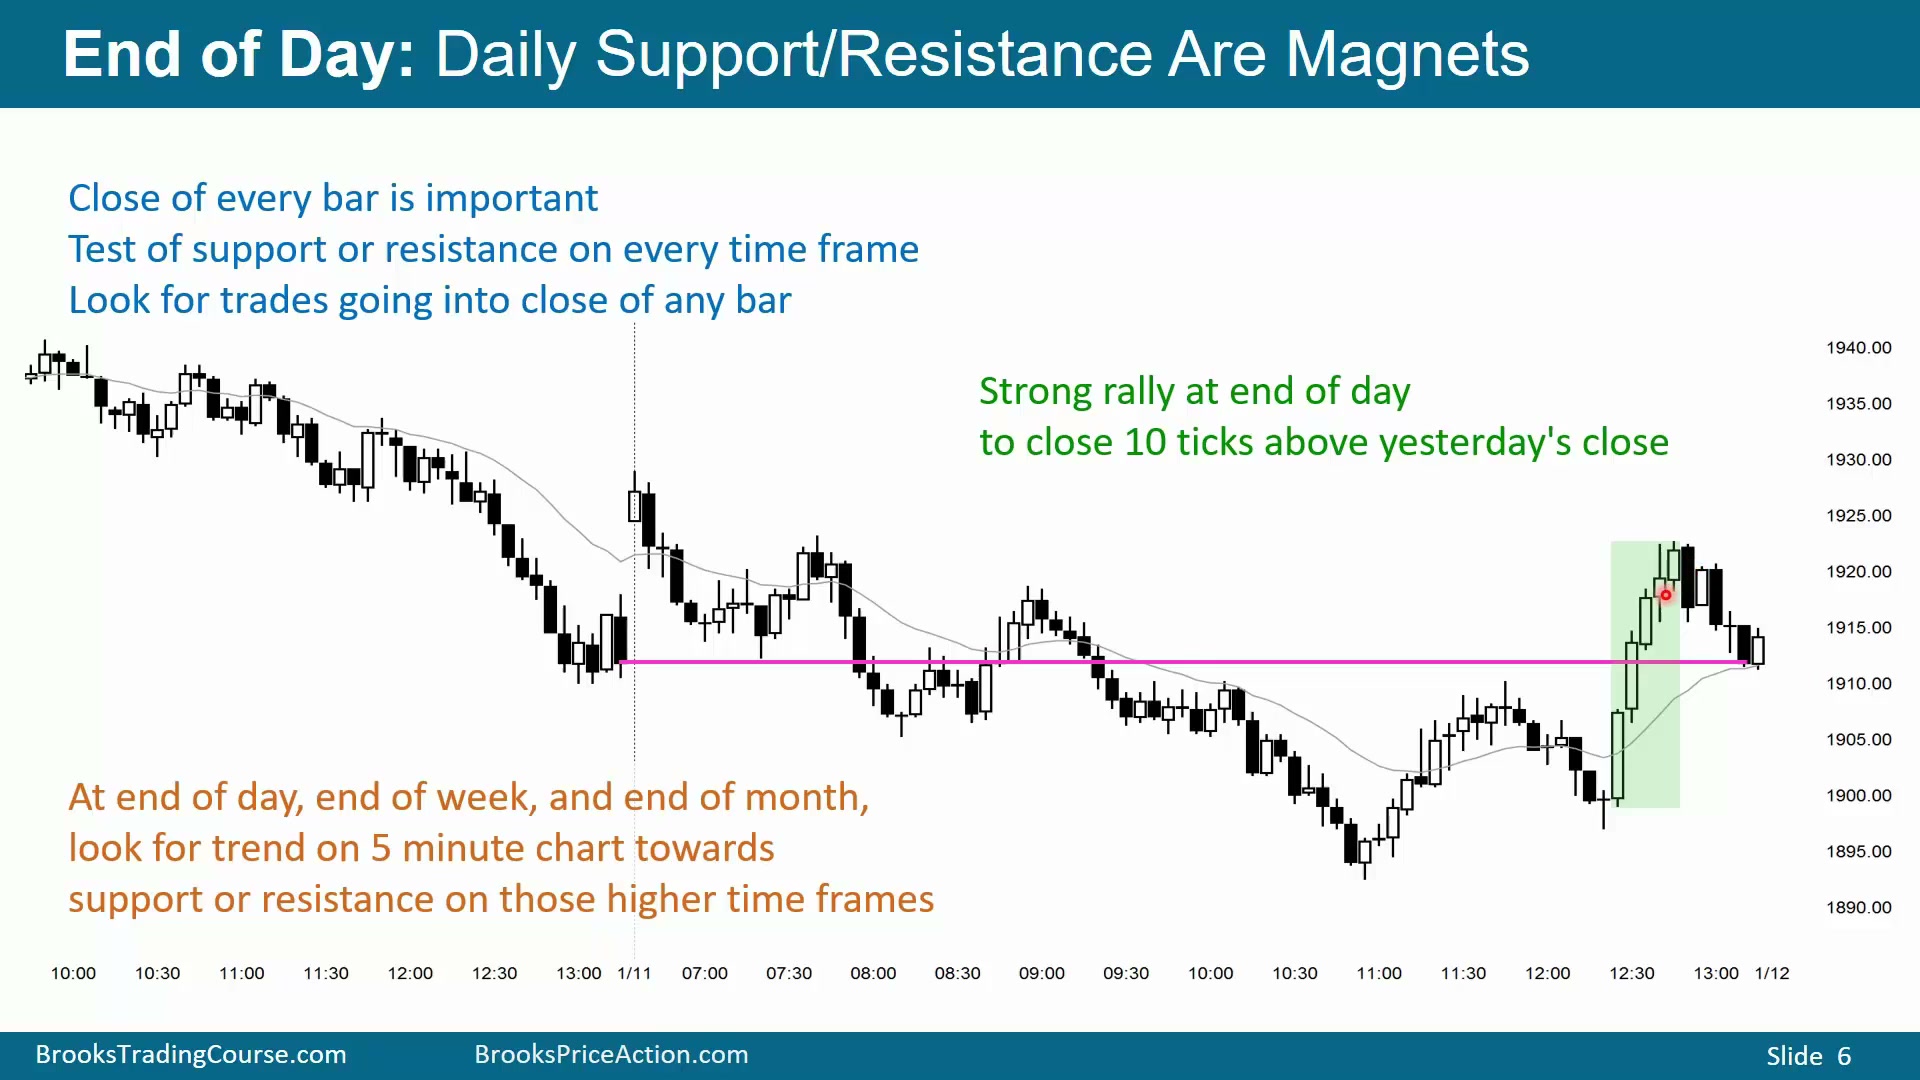
每根 K 线收盘时,交易者都会关注收盘价,因为收盘通常是对支撑或阻力的测试。这个原则适用于所有周期。日线即将收盘时,5 分钟图最后几根 K 线会影响日线形态;周线和月线也一样。
如果是周五,最后一到三个小时的 5 分钟图常常会测试周线支撑或阻力,例如上周低点、上周高点、上周收盘价,或更早某周的高低点。月末最后几个小时也常测试月线支撑阻力,例如上月收盘价、上月高低点,或更早月份的高低点。因此,在 5 分钟图交易时,如果正处在周末或月末尾盘,就要主动查看更高周期目标。
图中是 Emini 5 分钟图,昨日收盘价是上方磁力。当天开在昨日收盘价上方,随后多数时间卖出,但尾盘开始尝试向上反转。市场可能想重新站上昨日收盘价。图中出现不错的反转,随后形成 Higher Low Major Trend Reversal;在最后一小时、最后 30 分钟,昨日收盘价会成为重要磁力,因此应寻找向上反转机会。
图中随后出现 Buy The Close 上涨,交易者可以买这个收盘、下一个收盘,也许再买第三个收盘。但第三或第四次收盘后通常要停止继续买,因为最后一小时的 Buy The Close 往往只持续四、五、六根 K 线,买第五或第六根通常已经不赚钱。
高概率买入要用更远止损换取确认
Time: 11:10
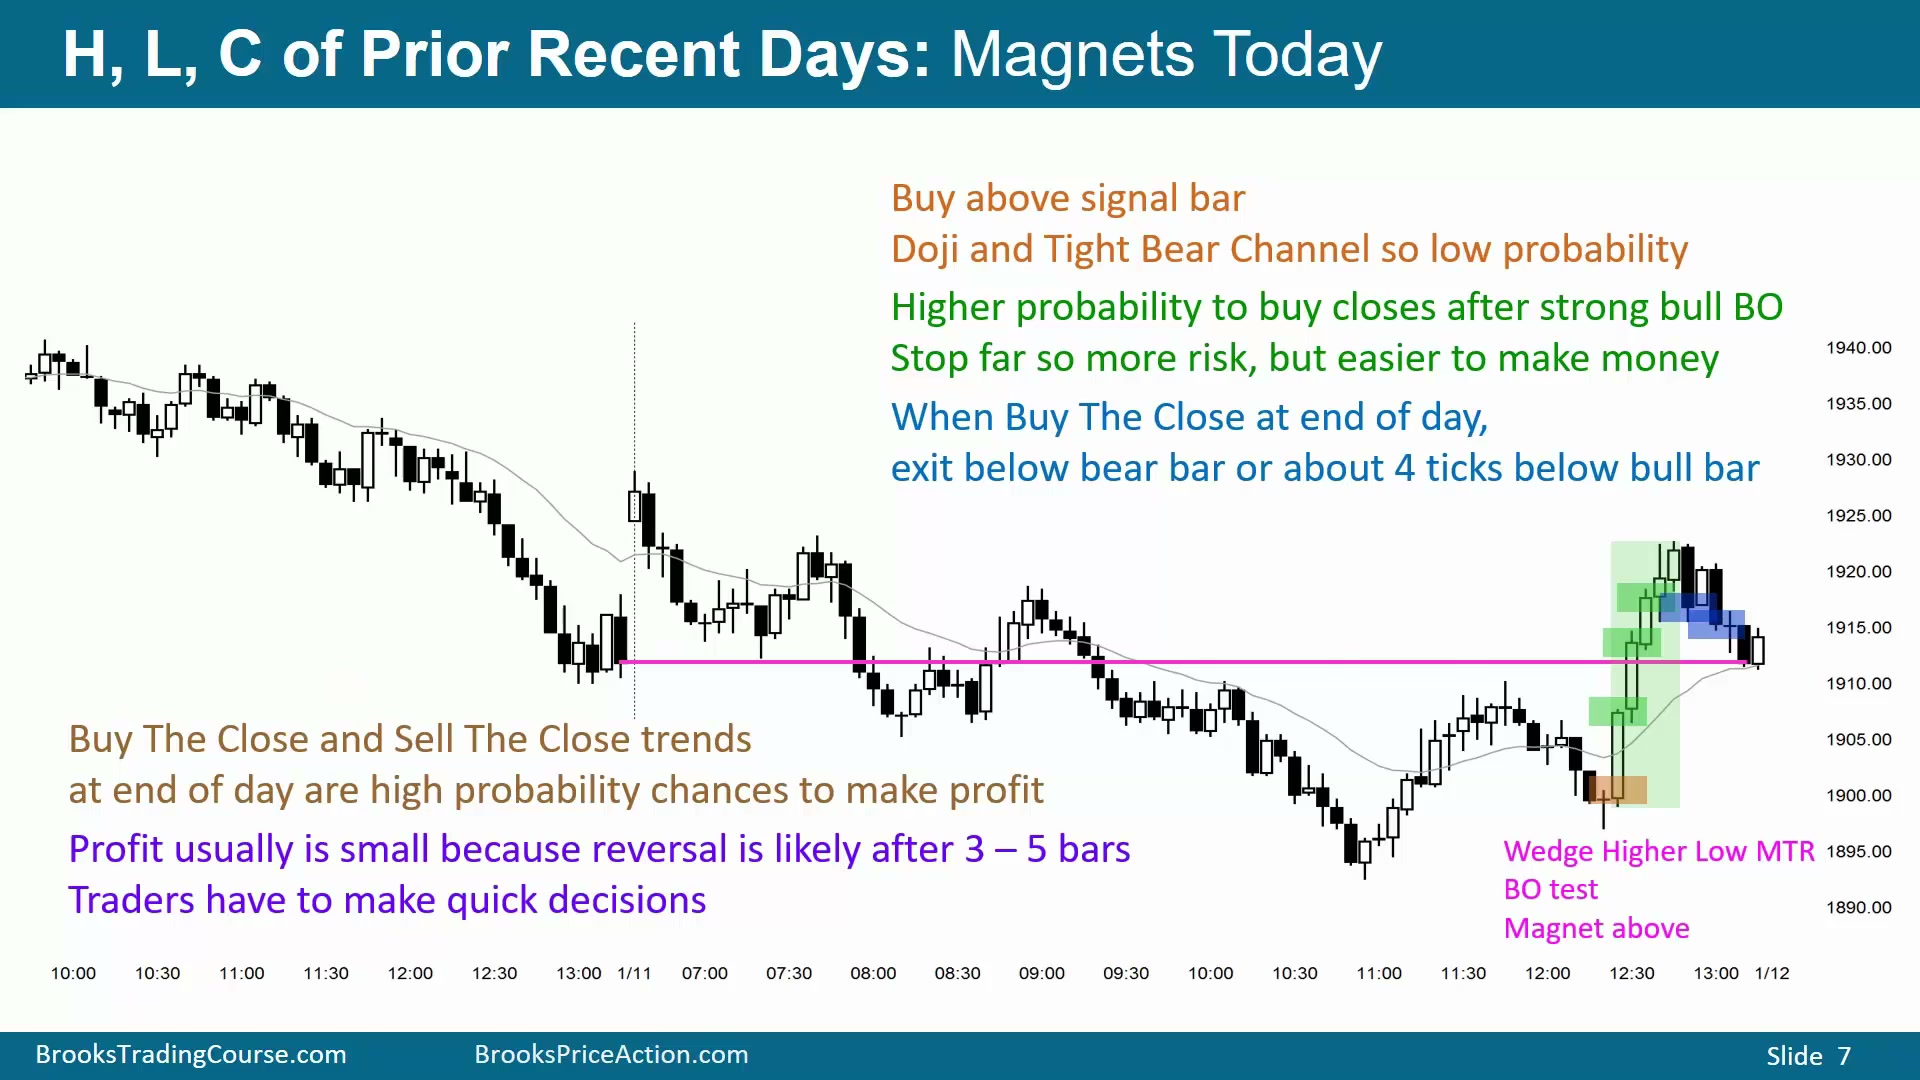
图中多头可以在较早的收盘附近开始买入;如果行情停滞,也可以在第二次入场附近获利了结。但随后出现 Higher Low Major Trend Reversal:先是空头趋势,再向上突破,回调很弱,约 50% 回撤,测试前面的买入信号 K 线,形成十字星,同时上方有昨日收盘价磁力。
这时在十字星高点上方买入是合理的,也可以等后面的收盘买入。等待收盘确认会提高赚钱概率,但止损距离更远;这是高概率交易的常见代价。最后一小时或最后半小时参与 Buy The Close,通常目标只是剥头皮,不要期待很大的波段。
图中还可以看成楔形反转:市场多次反转向上,形成 Wedge,同时又是 Higher Low 和 Major Trend Reversal。它还在测试前面买入信号 K 线的高点,属于突破测试;上方又有昨日收盘价磁力。多头会买入这个向上反转,想要更高概率的交易者会等收盘买入。
尾盘强上涨的管理规则仍然适用:任何阳线下方 3 到 4 ticks 出场,任何阴线下方 1 tick 出场。这样既给趋势一点空间,又能在 Buy The Close 明显失败时快速退出。
周五尾盘要看周线阻力是否守住
Time: 13:04
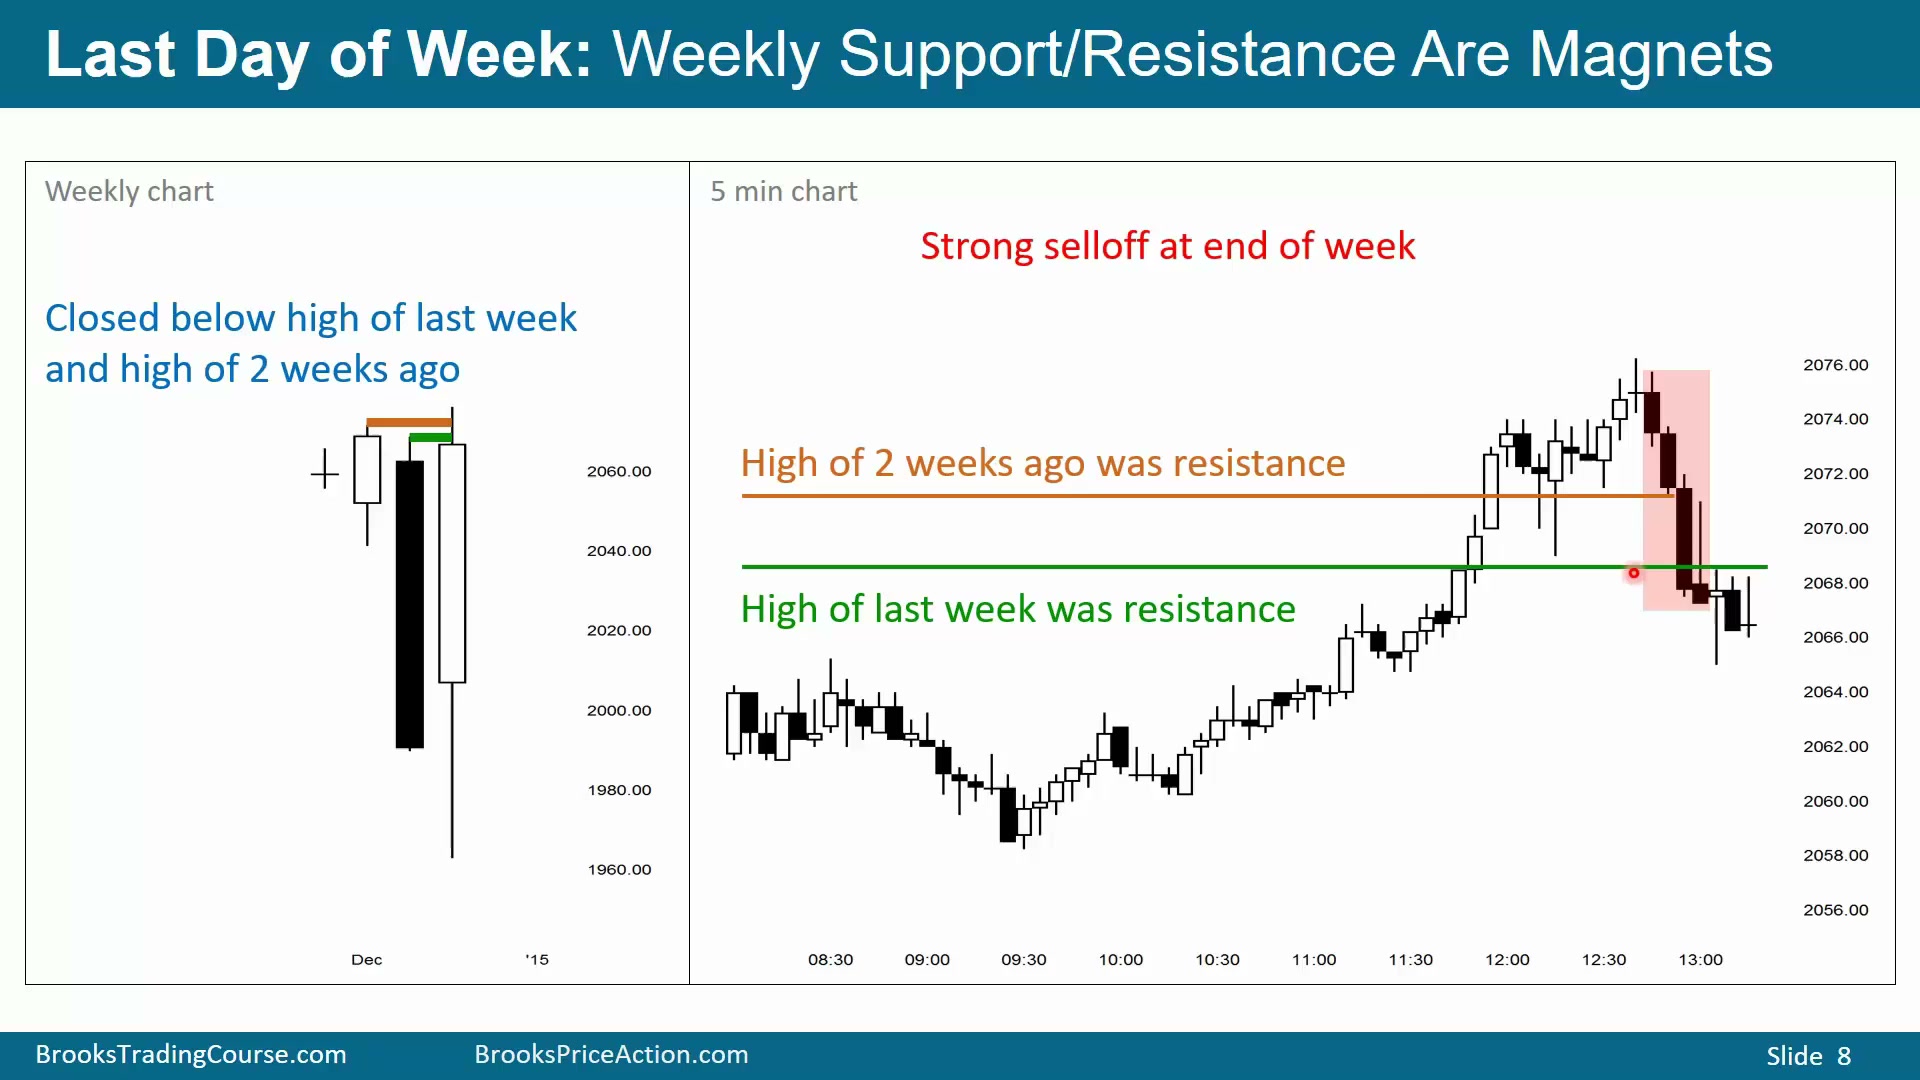
周五尾盘,周线支撑阻力很重要;月末最后一小时,月线支撑阻力很重要。图中是周五,已经接近一周最后几根 K 线,左侧显示周线图,右侧是 5 分钟图。5 分钟图正在上涨,测试上周高点和两周前高点,并试图向上突破。
这类上涨是对周线阻力的买入真空测试。价格快速上冲,试图站上上周高点和两周前高点;突破成功还是失败都要准备。图中动能开始减弱,可能形成 Final Flag,因此也要准备反转回到下方目标。
即使价格突破了阻力,阻力也不会自动消失。若市场大幅突破并持续远离阻力,突破才更可能成功;如果只是略微突破后停滞,阻力可能仍然有效,市场可能回到阻力下方。图中价格曾强力突破两周前高点,也第二次尝试突破,但距离阻力并不远,跟随很差。
尾盘是周五收盘,所以当天收盘同时也是周线收盘。图中的收盘价最终落在周线阻力下方,而且低于两个阻力位。虽然盘中一度强力突破,但缺乏跟随,最后收在阻力下方,说明突破失败。
周线突破失败后的做空要考虑时间和止损
Time: 15:40
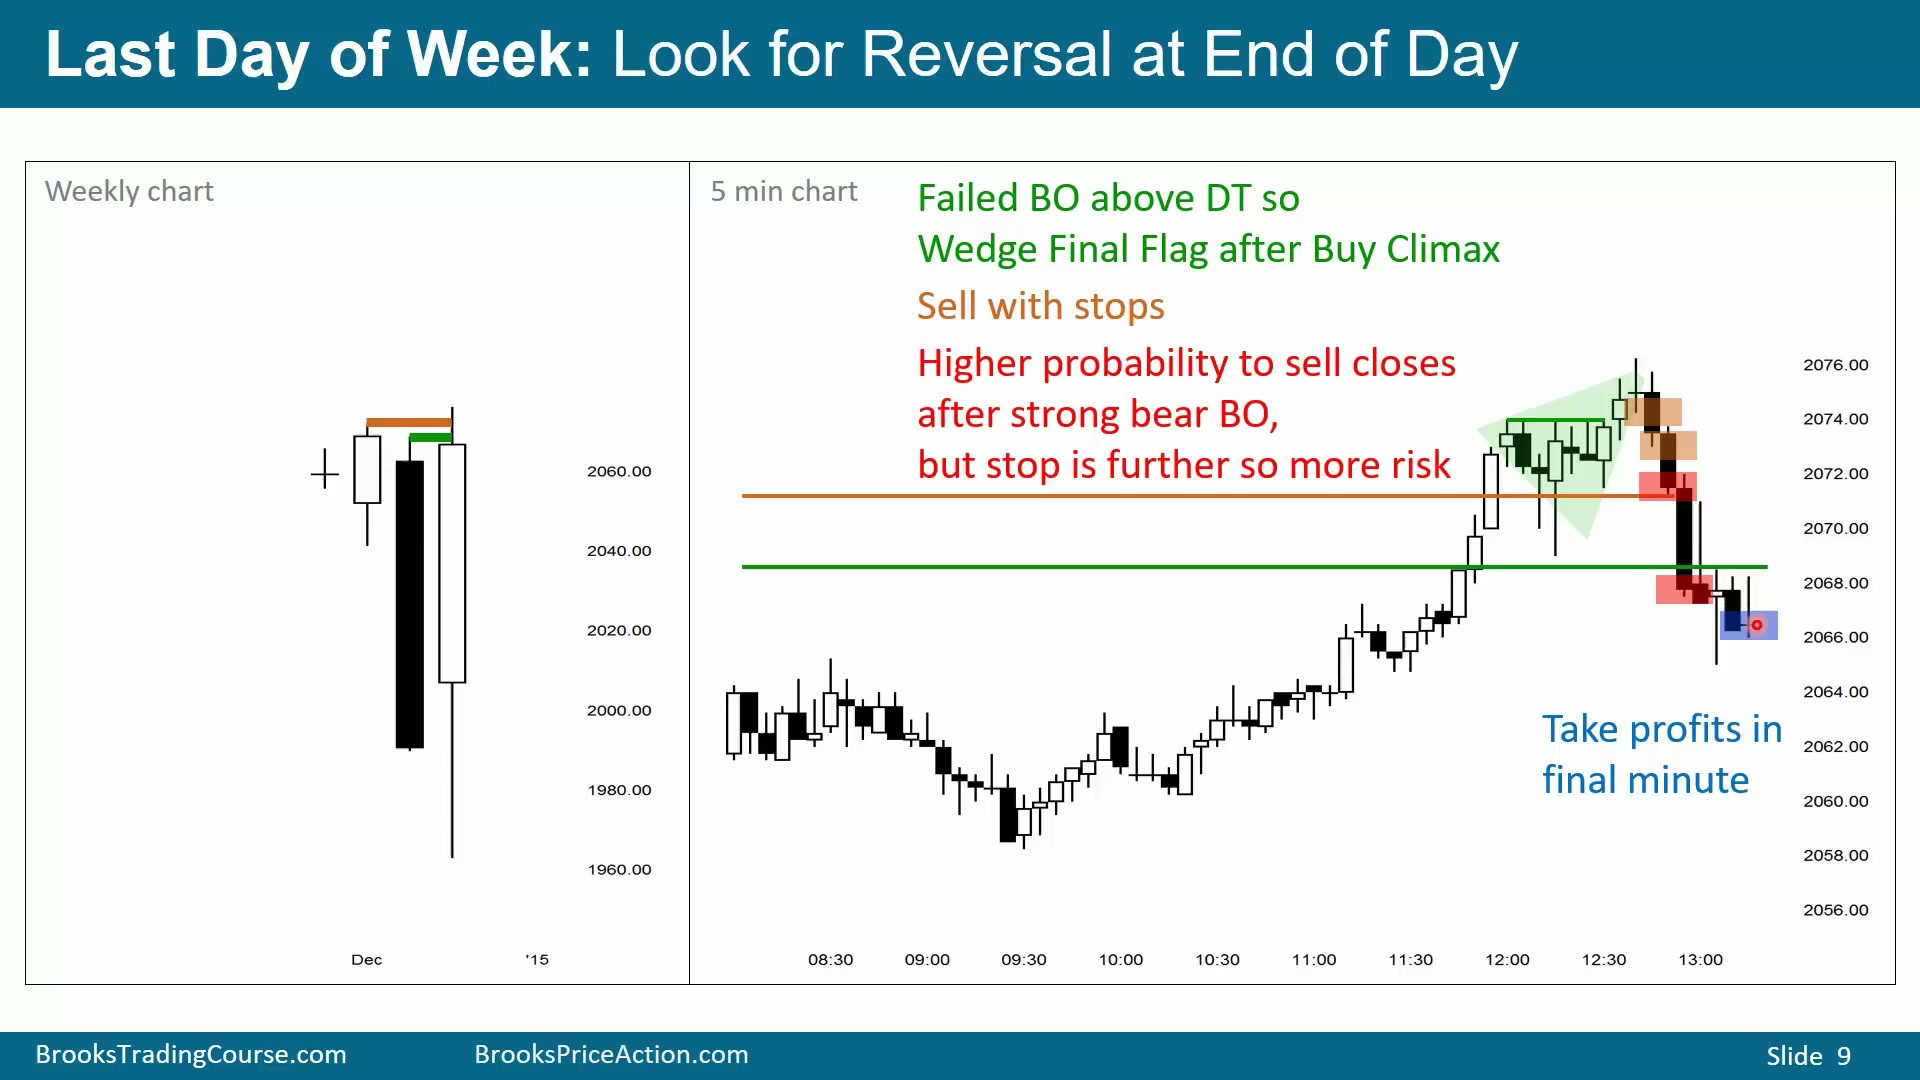
图中的顶部结构可以叫三角形、楔形,也可以叫 Final Flag,名称不是关键。关键是向上突破正在失败,周线阻力可能守住。部分交易者会在十字星下方卖出,但更高概率的做法是在一根真正的阴线下方卖出,押注阻力阻止上涨,市场可能最终收在阻力下方。
也有人会等待第二或第三根阴线收盘后再卖收盘。这样胜率更高,但已经很晚,剩下只有几根 K 线,利润潜力有限。高概率交易通常伴随更远的止损,这里也一样:确认越充分,入场越晚,风险距离越大。
两种入场都可以接受,但必须按尾盘规则管理。空头应在任何 K 线上方 3 到 4 ticks,或任何阳线上方 1 tick 出场。若这些出场条件都没有触发,交易者会在当天最后一分钟左右平仓;因为这是周五,那个时刻同时也是本周最后一分钟。
月末尾盘会测试月线磁力
Time: 16:55
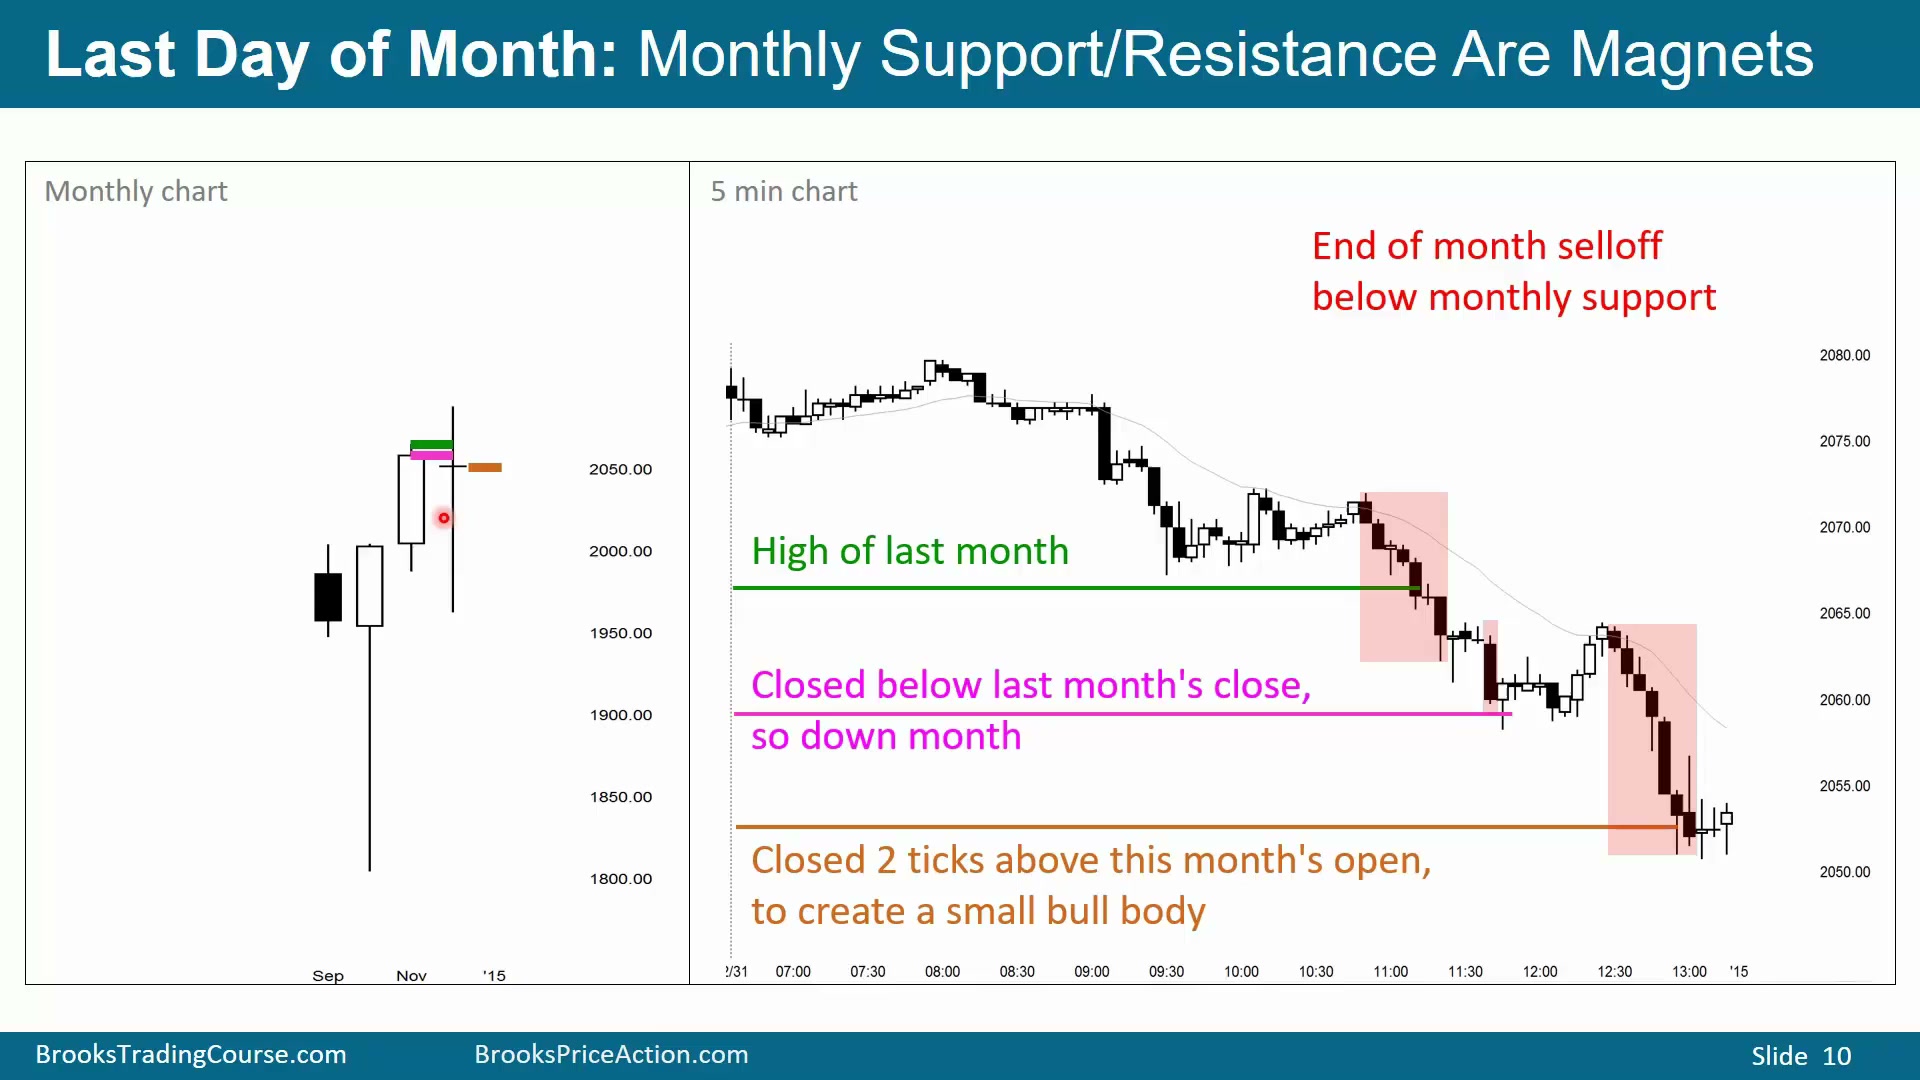
图中是月末最后一天的 5 分钟图,最后一小时市场可能正在测试月线支撑和阻力。上月高点、上月收盘价、本月开盘价都可能成为磁力。如果价格离这些磁力较近,尾盘常会被吸过去,因此交易者知道磁力在哪里,就可能抓到朝磁力移动的交易。
图中尾盘开始卖出,市场原本在上月高点上方,随后下跌。卖压较强时,应假设价格会测试上月高点;一旦跌到上月高点下方,又要考虑是否继续测试月线上的其他目标,例如上月收盘价。
价格在上月收盘价附近尝试反弹,形成第二次入场反弹,但当时仍是紧空头通道,上涨不太可能走很远。随后市场在均线附近再次向下反转,形成 Low 2:空头趋势中的两段上涨,第一段上涨、回调、第二段上涨,然后出现收在低位的阴线。此时可以在阴线下方卖出,也可以等几根阴线收盘后卖收盘,目标是测试下一个月线目标,也就是本月开盘价。
图中最终月线收盘只比本月开盘价高 2 ticks,形成月线十字星,也是一根 outside bar。这说明 5 分钟图最后一小时的下跌,直接影响了月线 K 线的最终形态。
强空头趋势中卖出理由可以很多
Time: 18:53
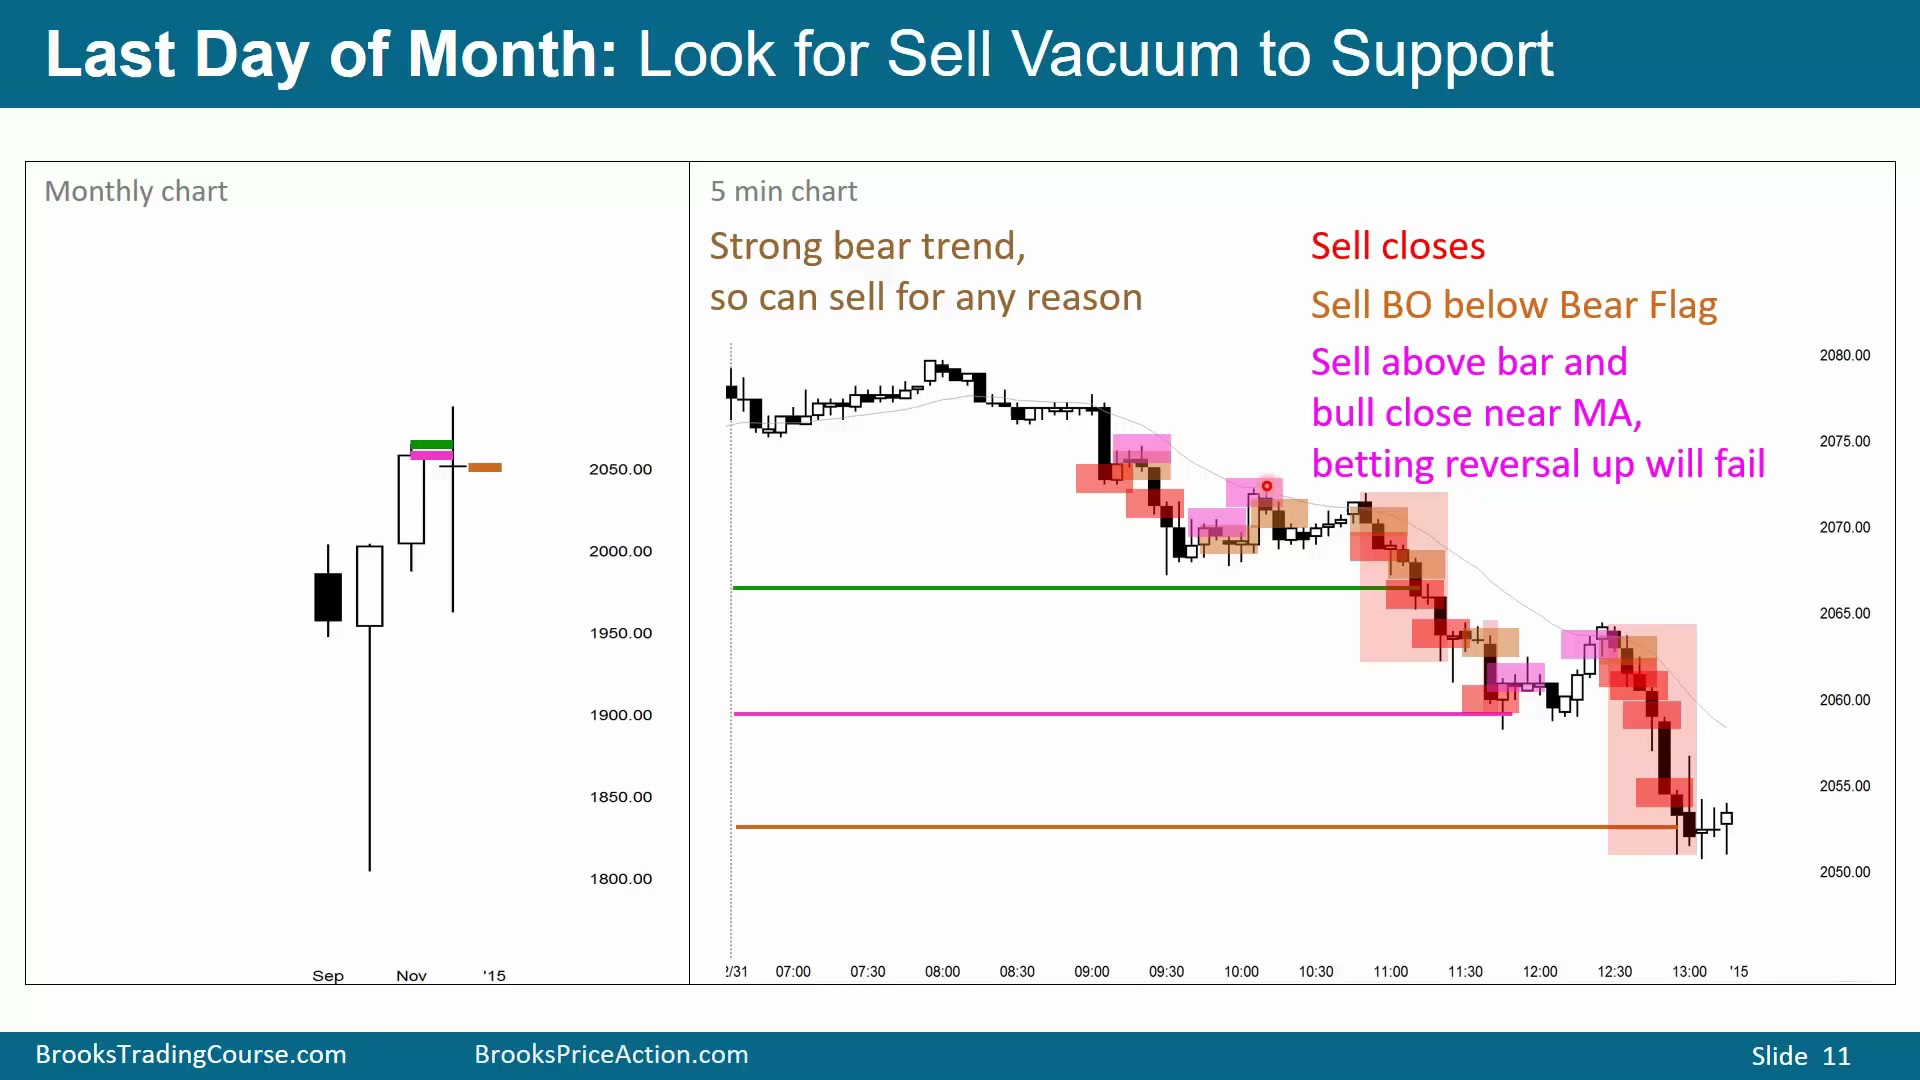
强空头趋势中,可以因为很多理由卖出。交易者可以卖收盘,可以在空头旗形下方卖出,也可以在阳线或阴线上方卖出,押注向上反转会失败。轻微反转后,如果价格在均线附近出现强阳线收盘,也可以卖出,押注它失败。
图中还可以卖双顶空头旗形,尤其是在均线附近出现阴线时;可以卖强阴线收盘,押注任何向上反转都只是小反转;也可以卖空头旗形向下突破,在相应阴线下方入场。只要空头通道足够紧,也可以在任何 K 线上方卖出,无论那根是阳线还是阴线,因为第一次向上反转通常是小反转。
管理上仍然要使用合适止损,必要时加仓。紧空头通道中的第一次向上反转,多头最多通常得到震荡区间,更可能只是空头旗形。因此尾盘交易者必须准备好识别牛陷阱和熊陷阱:看起来可以买的反转可能只是套多头,看起来可以卖的反转也可能只是套空头。
尾盘要识别陷阱并跟随磁力
Time: 20:00
最后一小时经常出现看似很好的买入或卖出信号,但其中不少是陷阱。市场可能让交易者以为应该买入,实际是在诱多,随后准备向下反转;也可能在强多头趋势中给出做空形态,诱使空头低胜率卖出,然后趋势恢复上涨。
尾盘还要始终寻找磁力。当天的开盘价、最高价、最低价,昨日高点、低点、收盘价,都可能成为尾盘目标。若当天是周五,还要看周线图上的上周高点、上周低点、上周收盘价,以及更早几周的高低点。若当天是月末最后一天,最后一小时还要关注月线支撑阻力,只要市场离这些目标不远,它们就可能吸引价格。
如果市场开始朝这些更高周期磁力移动,反应快、能识别背景的交易者常能找到有利交易。核心不是预测新闻原因,而是看价格是否正在被磁力吸引、是否到达后出现反转或横盘,以及当前信号是真突破还是陷阱。