al-brooks-course
13 - 5 Steps to Finding Today’s Trades
Readable self-study lecture notes for 13 - 5 Steps to Finding Today’s Trades.
Source Media
每天收盘后用同一套流程训练识别模式
Time: 01:20
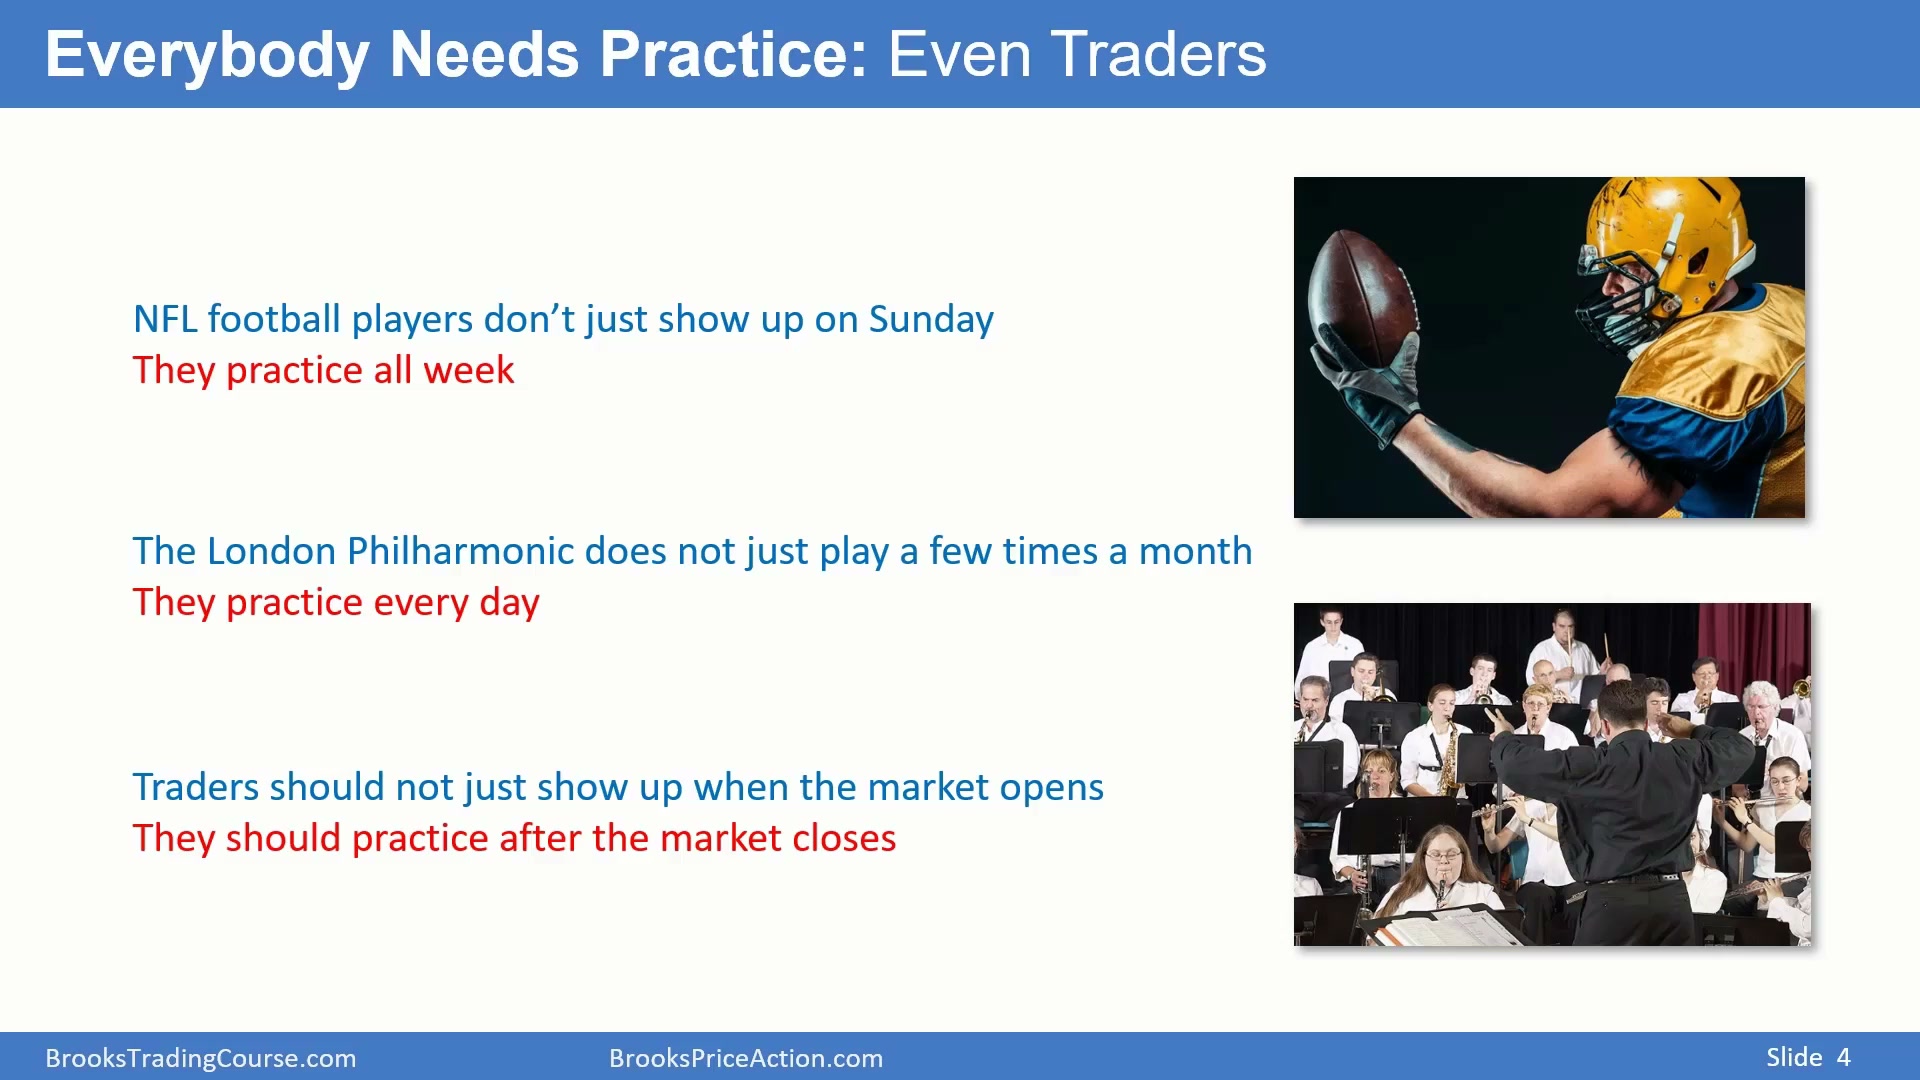
交易训练的核心不是临场才寻找灵感,而是在每天收盘后复盘当天图表。把图表标注出来,画线,思考可能的进场、出场和管理方式;这样做的目的,是在未来某天、下周或下个月实时看到同类模式时,可以提前预判后续发展,组织交易计划,并在交易触发后管理好持仓。
这套练习方法需要每天重复。职业交易者应像职业运动员或音乐家一样训练:真正“上场”的时间有限,但练习必须持续。反复标记图表会让模式从事后认识逐渐变成盘中识别能力。
任何市场和周期都可以用同一套价格行为逻辑
Time: 01:50
复盘时要尽量使用固定流程。无论图表来自书、网站、每日博客,还是自己的交易平台,标注方法都应该一致:先画线和框,再添加说明文字。交易本质上是买方和卖方之间的理性互动;图表只是这种互动的记录。市场可以是股票、商品、外汇、期货,甚至现实世界里的水果或房产交易;周期可以是分钟图、小时图、日线或月线。只要是人类在做买卖,图表上就会反复出现相似行为。
第一步通常是画线。先找 channel、Wedge、Double Top、Double Bottom 和 Triangle,用线条把这些结构突出出来。第二步看特殊 K 线:大 K 线、小 K 线、Inside Bar、连续 Inside Bar、Outside Bar、大 K 线后更大的 K 线、Inside-Outside-Inside 等组合。第三步再画红色和绿色盒子,标出理想进场位置或可能进场位置。最后添加文字框,把模式名称和处理逻辑写上去,帮助以后遇到同类模式时知道该怎么做。
长期观察每一个 tick 后,交易者会自然开始分类、命名并积累模式。模式一旦开始发展,市场后续“倾向于”做什么,会成为结构交易的基础。
这种通用性也解释了为什么复盘不应只盯着自己交易的一个市场。看股票、外汇、黄金、Emini 或房地产价格,本质上都是在看参与者如何在不确定中买入、卖出、获利了结和止损。图表上反复出现的趋势、通道、突破失败和反转,来自相同的人类决策。
因此,训练素材越多样越好。看外汇 4 小时图、黄金月线图或 Emini 5 分钟图时,不要先被品种和时间框架分散注意力;先问同样的问题:市场是在趋势、交易区间、突破、失败突破,还是在形成某种反转。只要这个习惯稳定,换市场时就不会像重新学习一套语言。
复盘就是每天练习发现模式
Time: 05:11
交易练习最直接的方法,就是看图并寻找模式。市场收盘后,花时间检查自己交易的图表,寻找价格行为结构,思考当天自己做了什么,以及还能怎么做。训练目标是更快理解市场正在做什么,更快预判它接下来可能做什么。
识别速度直接影响交易质量。越早认出模式,越早能定义进场、止损、目标、仓位和失效条件。盘中没有足够时间从零开始推理;复盘时反复标注,才会让这些判断在实时行情中变得可用。
Wedge Bottom 后用风险两倍目标组织交易
Time: 06:03
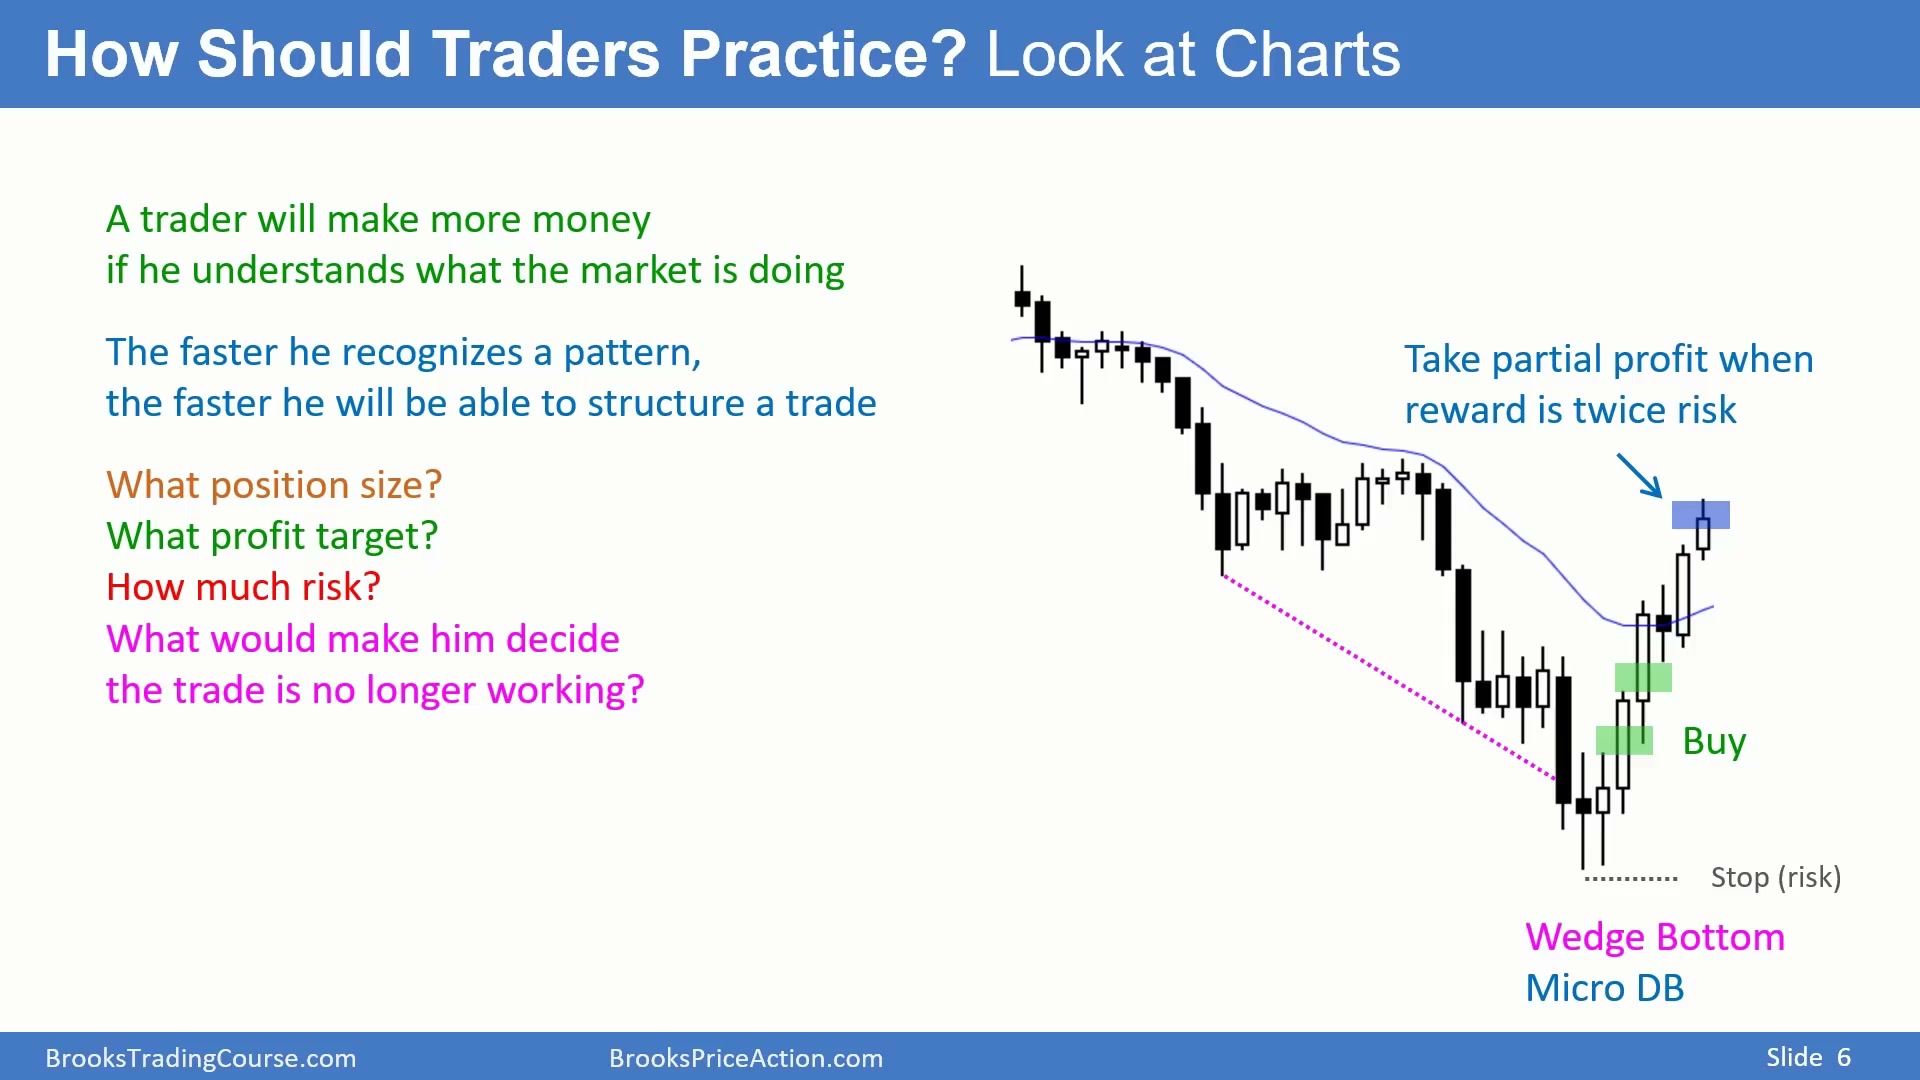
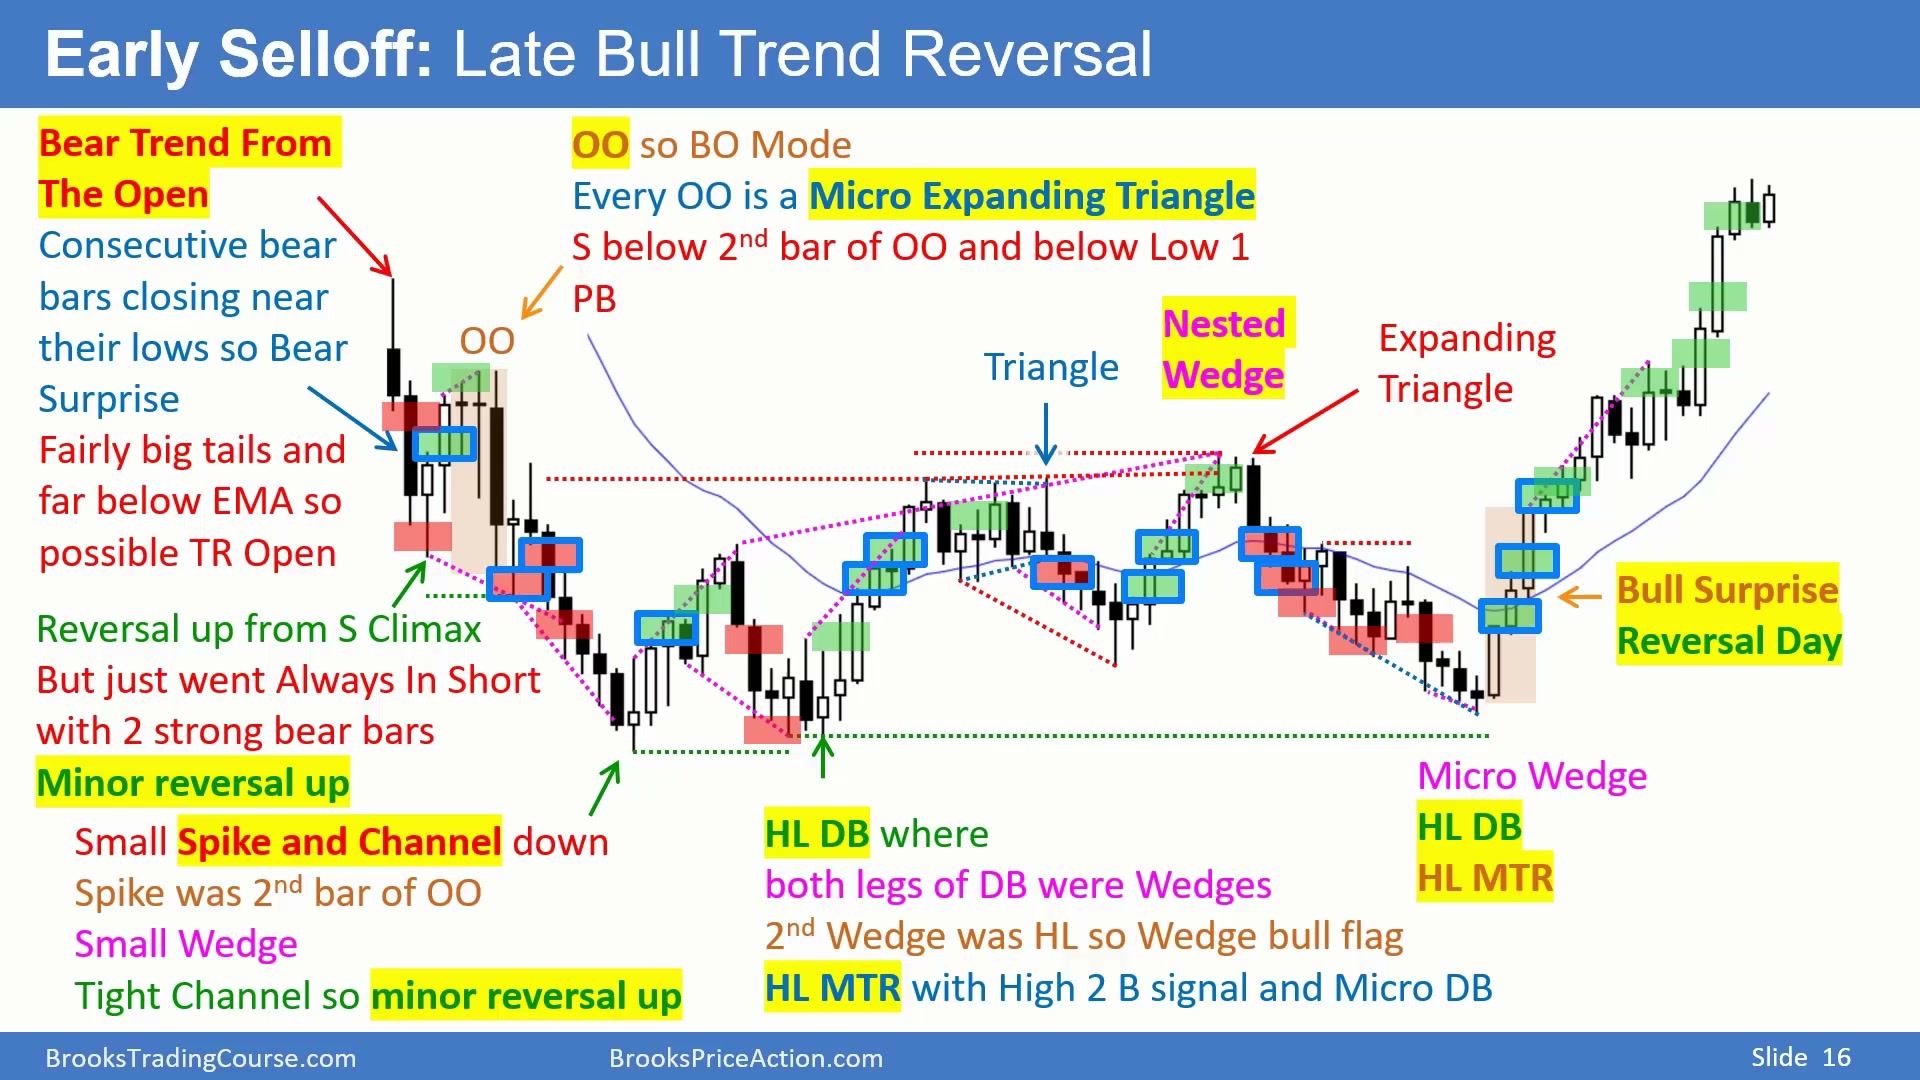
图中的下跌段先形成 bear channel,顶部可以画出通道线,价格沿通道下行并跌破通道下轨,随后向上反转。通道里有三段下跌,构成 Wedge。反转位置还出现 Micro Double Bottom:一根 K 线先下后上,后一根又先下后上。如果换到更小周期,这种两三根 K 线内形成的结构可能就是一个真正的 Double Bottom,两个低点之间可能隔着 10 根或 20 根小周期 K 线。
Wedge Bottom 加 Micro Double Bottom 后,市场出现收在高点的牛 K 线,而且是连续第二根牛 K 线,继续上涨的概率上升。合理做法是在这根 K 线高点上方 1 tick 用 stop 买入,下一根 K 线触发。最小目标应至少是风险的两倍:进场价到止损价是 risk,把同样距离向上量两倍,就是 2R 目标。若交易者持续只选择能组织成良好 risk/reward 的交易,就更有机会长期稳定盈利。
组织一笔交易不只是找方向。还要确定仓位大小、利润目标、初始风险、获利概率,以及市场做出什么行为时说明原计划不再有效。某些时候应该提前出场,而不是机械等待止损。
图中的买点并不是因为 Wedge 这个名称本身,而是因为它把风险、概率和目标组合在一起。进场后如果市场没有继续形成牛 K 线,或者快速跌回信号 K 线低点下方,说明买方并没有接管,交易计划就需要重新评估。若行情按预期上涨,则先看 2R;如果 momentum 很强,也可以用后续价格行为决定是否持有更久。
用截图和固定组件快速制作复盘图
Time: 08:29
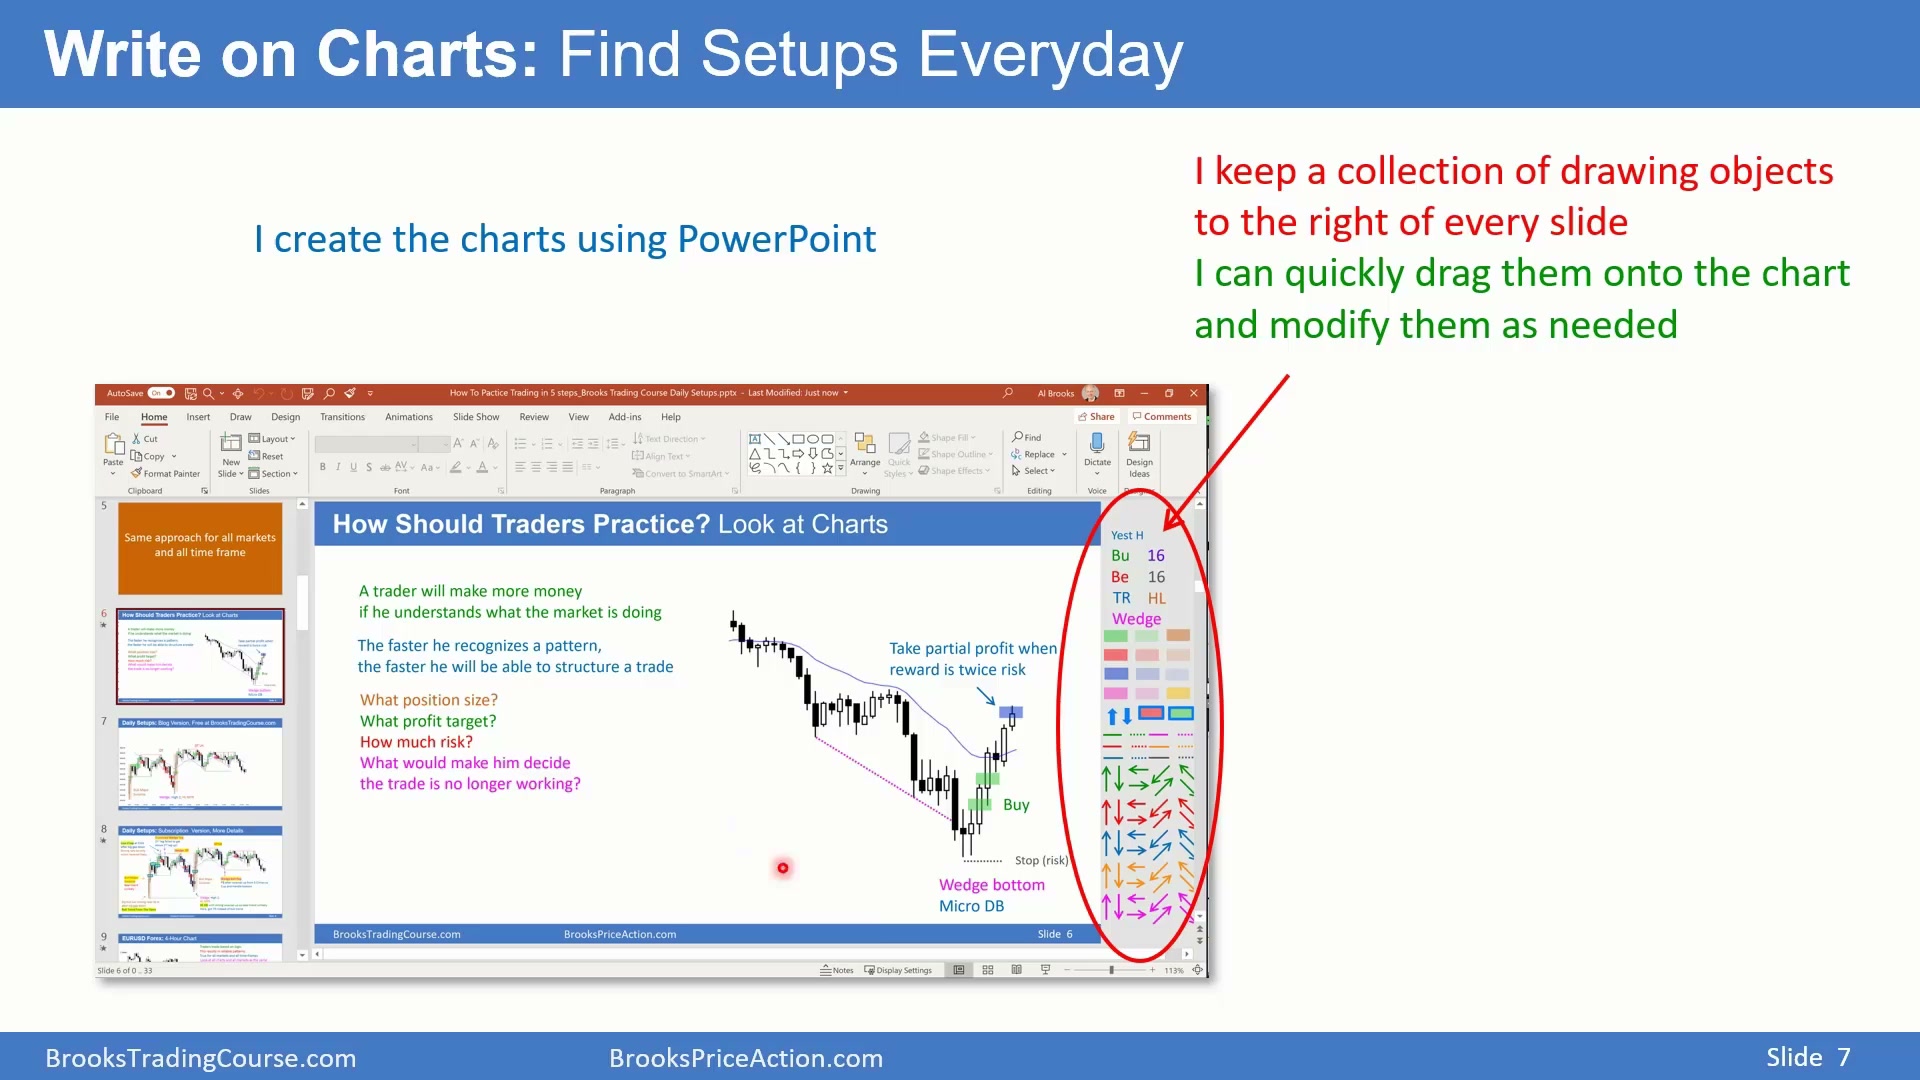
复盘图可以用 PowerPoint 制作。先用 Snagit 或 Windows 截图工具从交易平台截取图表,粘贴到 PowerPoint 页面,再添加线条、进场盒、必要时的出场盒,以及解释交易理由的文字。
图右侧保存了一组可复用对象:短线段、文本框、颜色和格式模板。需要画线时,按住 Control 拖动现有线段,再调整方向和端点;需要文本框时,复制现有文本框并改字;需要统一文字颜色时,用格式刷快速套用。固定工具集能让每天标图更快、更一致。
工具不需要复杂,关键是降低重复操作成本。每天如果都要重新找颜色、重新设置线宽、重新排版文本框,很容易因为麻烦而停止练习。把组件放在图旁边,复盘时只复制、拖动、改字,就能把注意力留给模式本身。
Daily Setups 是免费公开的日常复盘样例
Time: 09:50
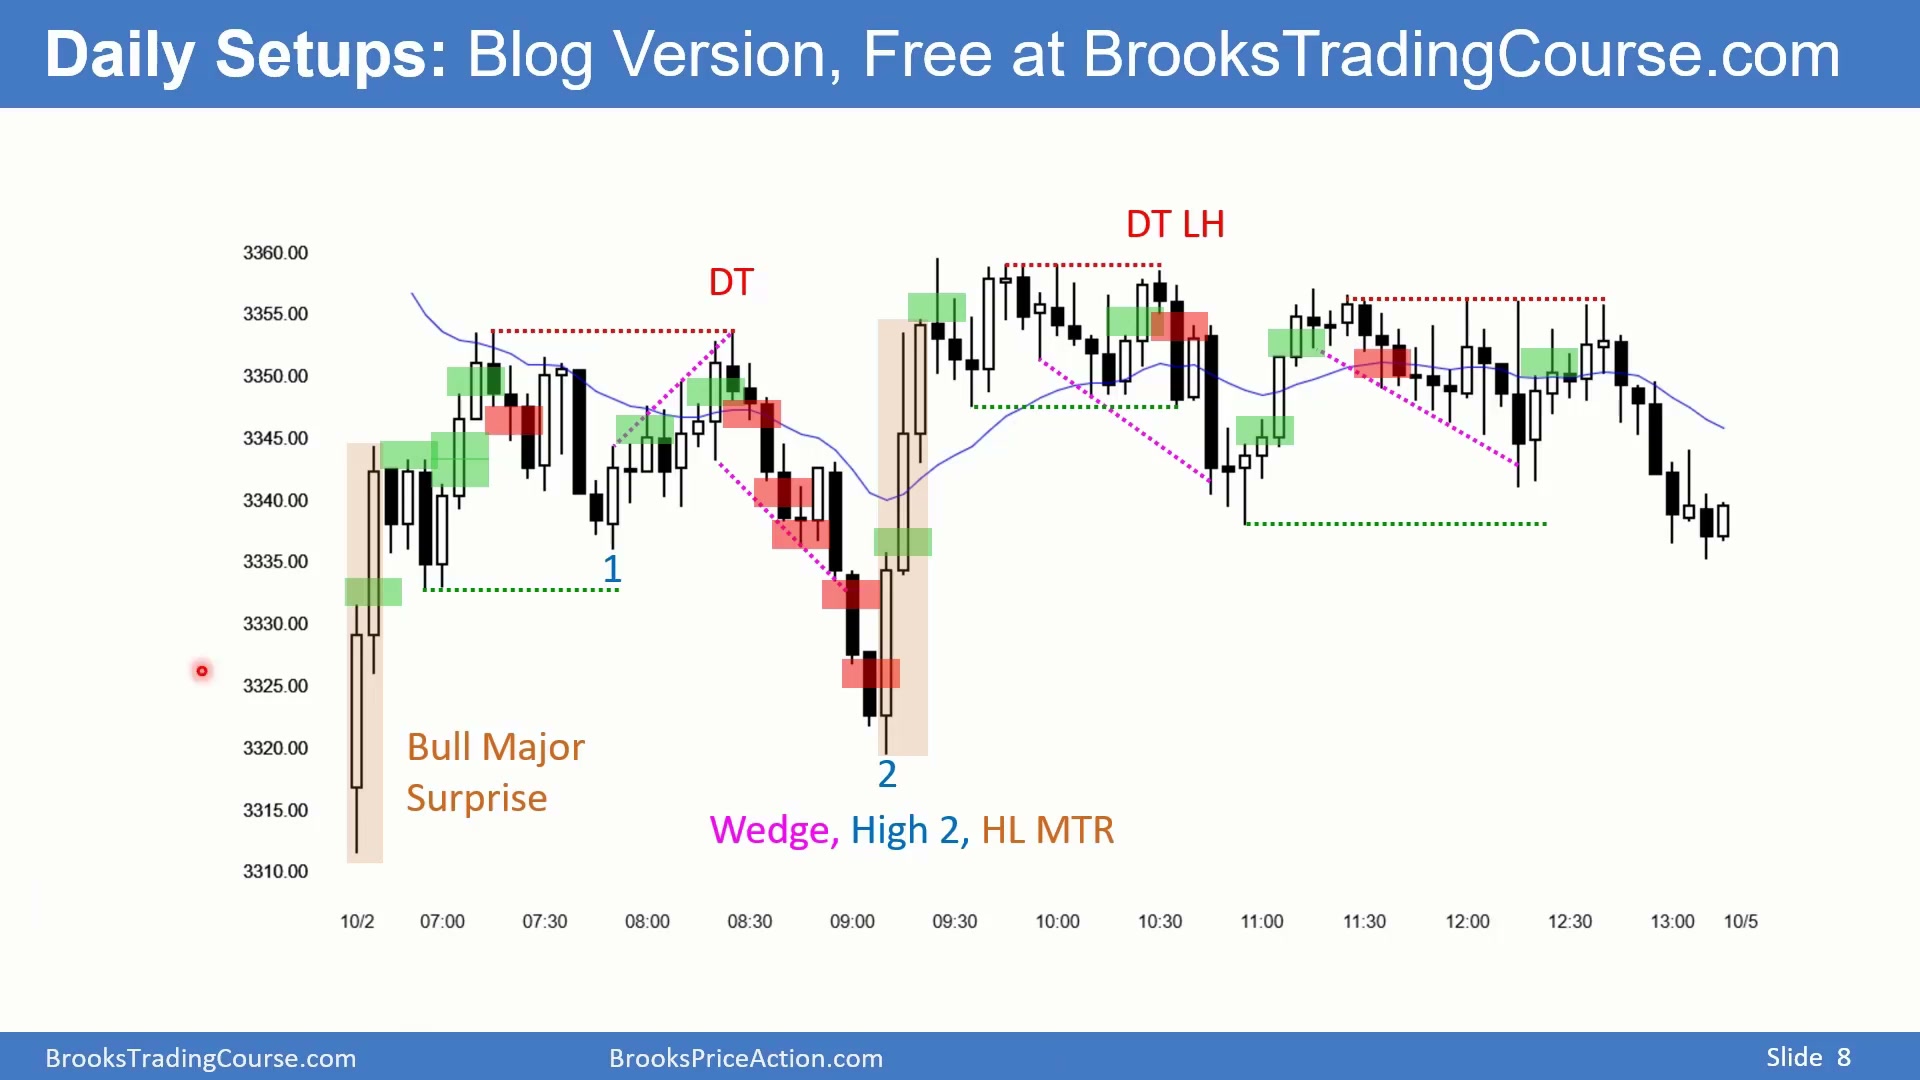
每日复盘图可以长期公开积累成 Daily Setups。图中的样例是 Emini 5 分钟图,横轴是时间,纵轴是价格,上面有线条、盒子和被强调的重要区域。这样的图表不只是记录当天走势,也是在训练读者:哪些地方有模式,哪些 K 线特别,哪些区域适合考虑交易。
付费详细图会加入更多背景说明
Time: 10:20
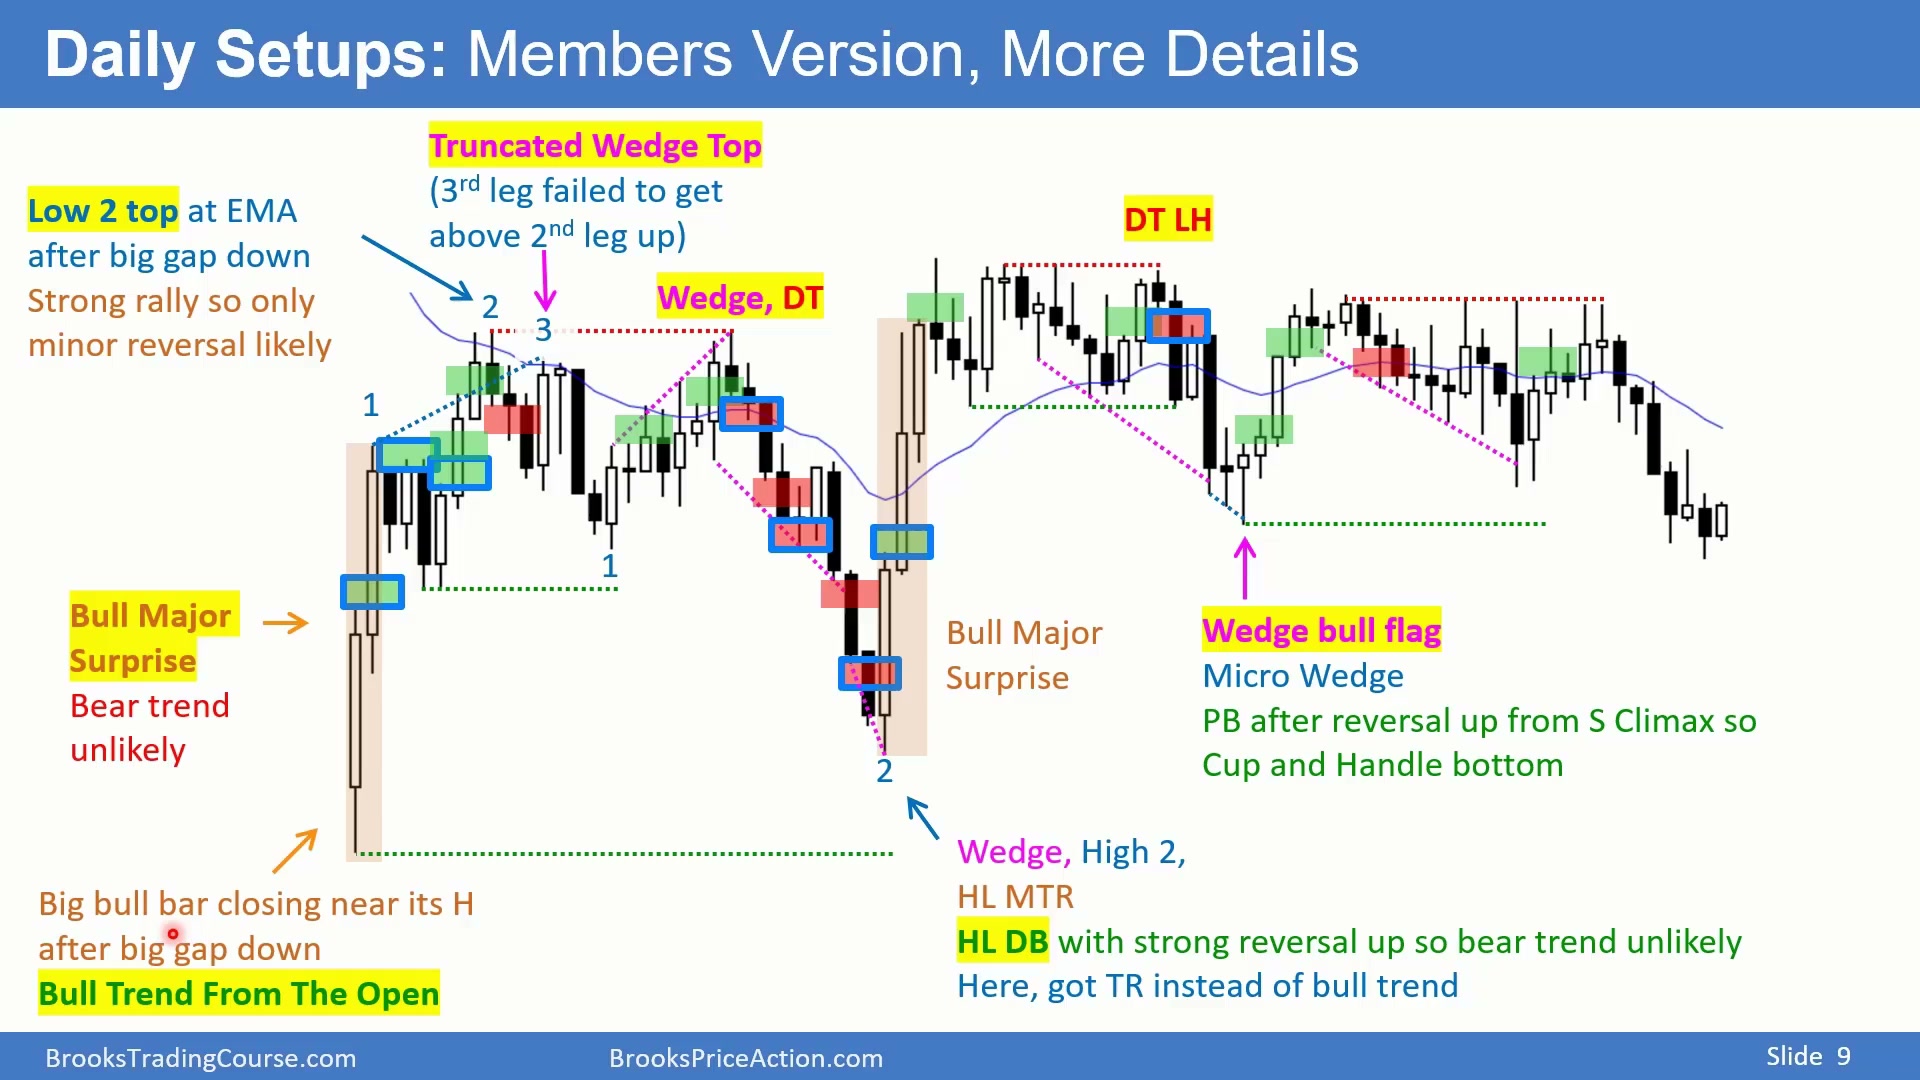
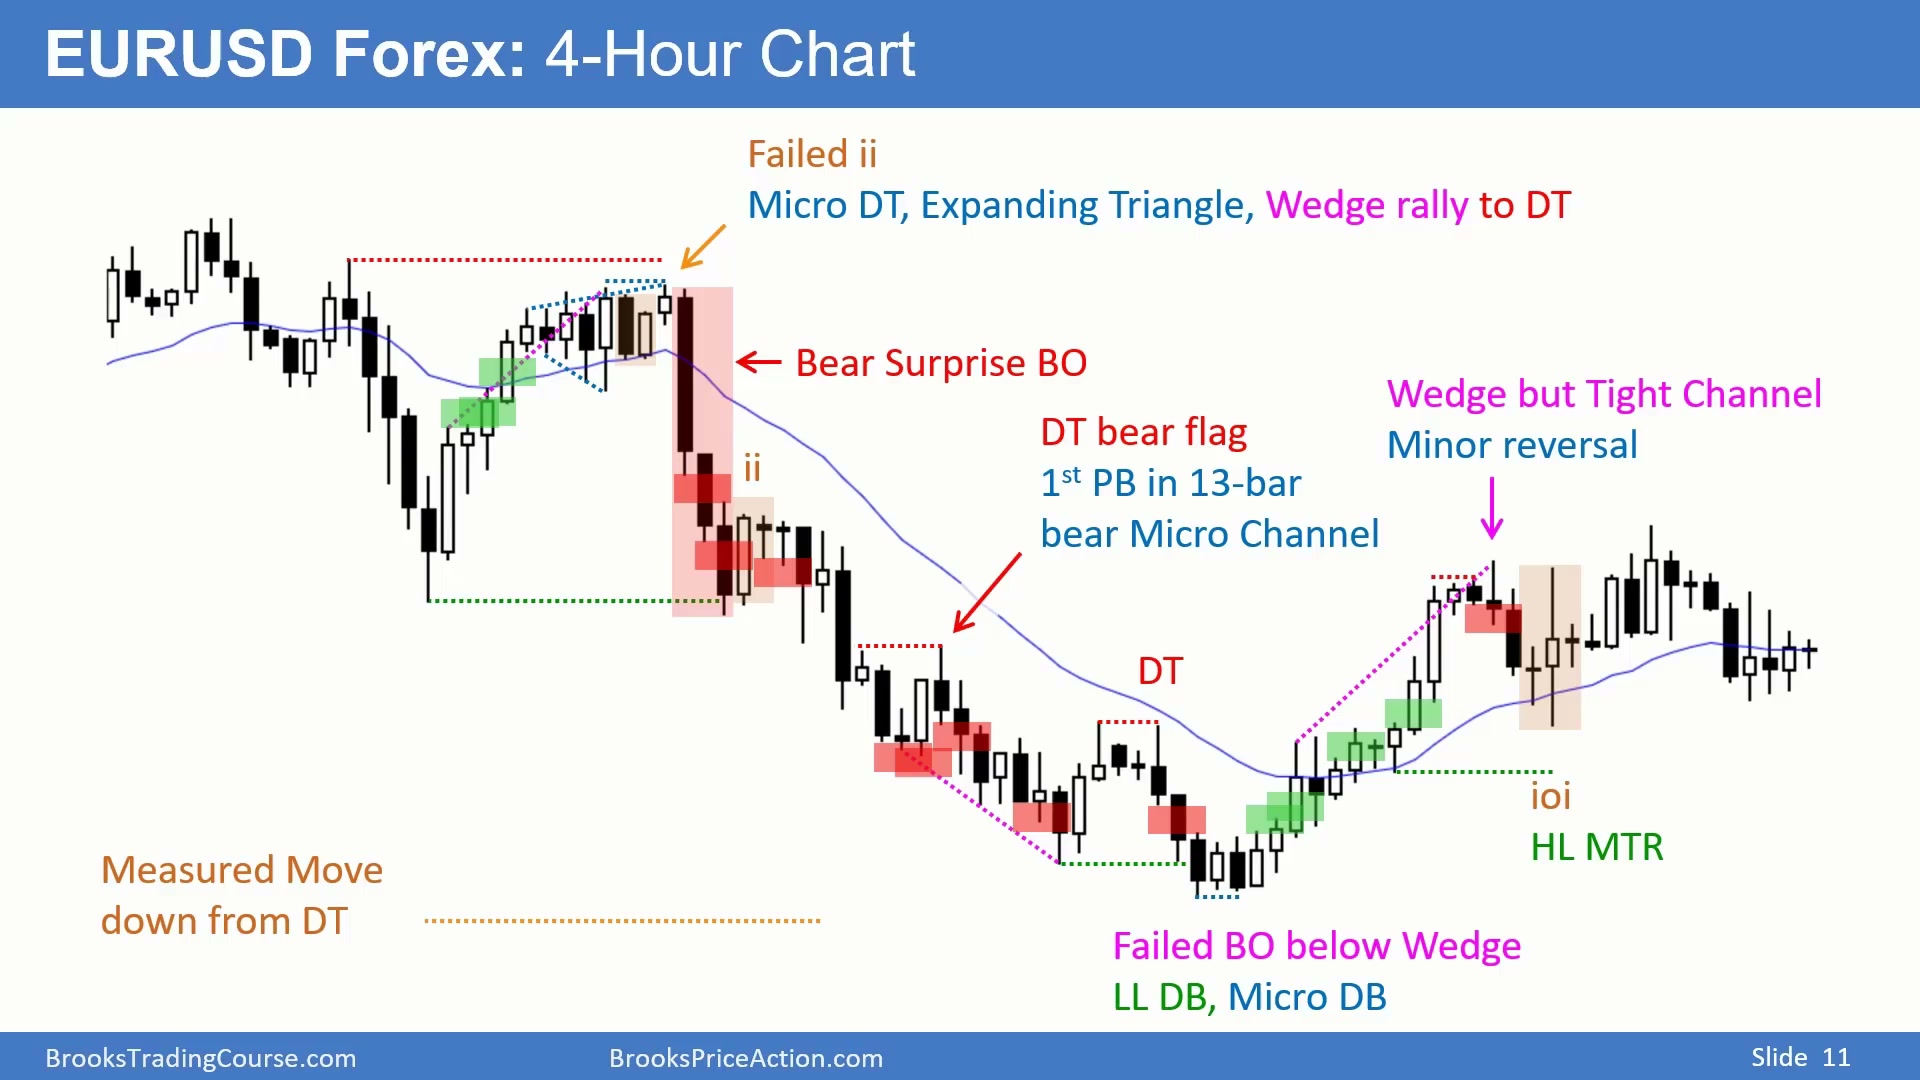
有些读者需要更多细节,因此同一套标注方法也可以做成更详细的订阅图表。图中是欧元兑美元 4 小时图。即使市场不同、周期不同,复盘仍从同样的问题开始:哪里有趋势线、通道、Wedge、Double Top、Double Bottom、Triangle,哪里有特殊 K 线,哪里有可执行进场。
价格和时间不是重点,行为结构才是重点
Time: 10:40
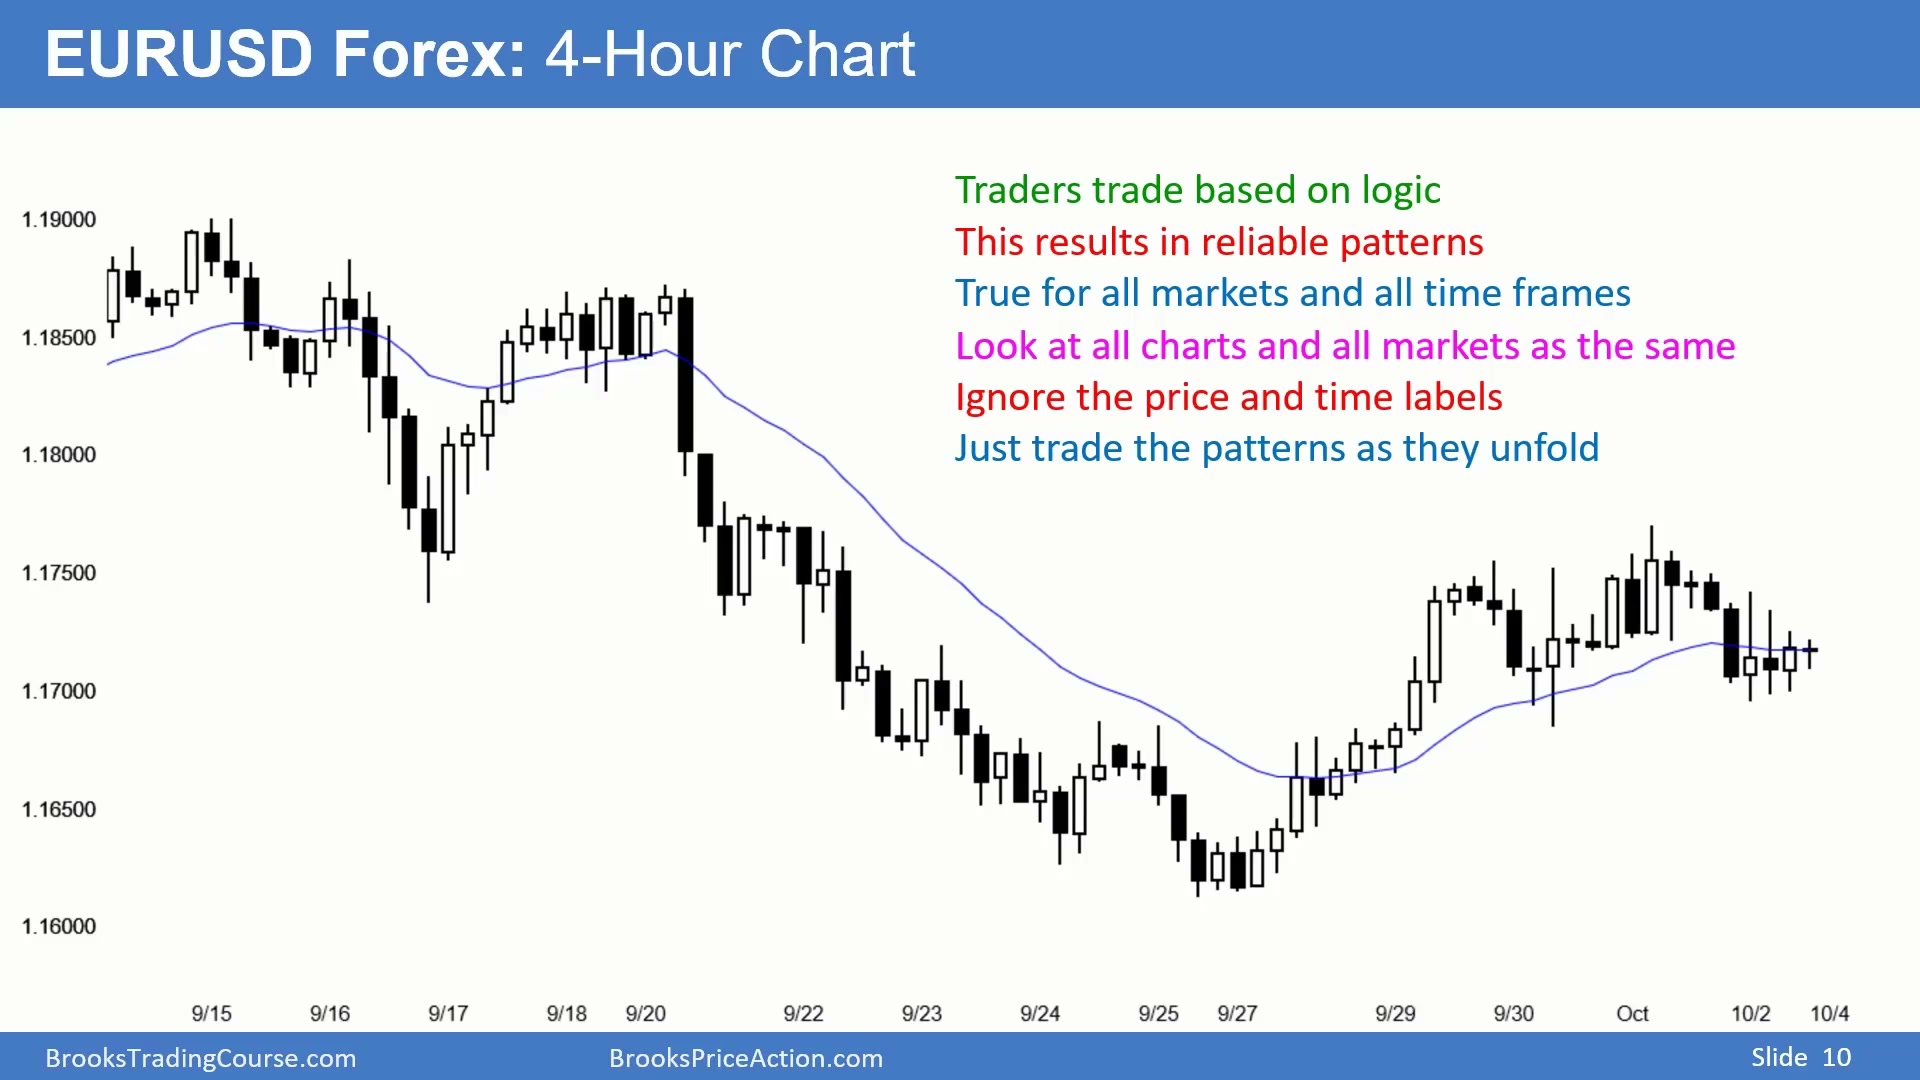
在图中的 4 小时外汇图上,每根 K 线代表 4 小时,但分析重点不是具体价格或具体时间。交易者基于逻辑行动,逻辑行为会产生可靠模式;人们在不同市场中使用类似逻辑,所以模式会出现在所有市场和所有周期上。
专业交易者讨论图表时,不会因为图表是 Apple、黄金、原油或股指期货就换一套基本交易逻辑。图表是理性人类行为的表现,价格行为结构比品种名称更重要。
去掉标签后,外汇图也像任何其他图表
Time: 11:55
如果去掉价格和时间标签,再把欧元兑美元 4 小时图标注出来,读者很难仅凭形态判断它是外汇图。它可能像 Emini,也可能像黄金或任何股票指数期货。原因很简单:所有图表都由相同的价格行为模式组成,复盘时也应从相同流程开始。
月线黄金图同样可以作为练习素材
Time: 12:20
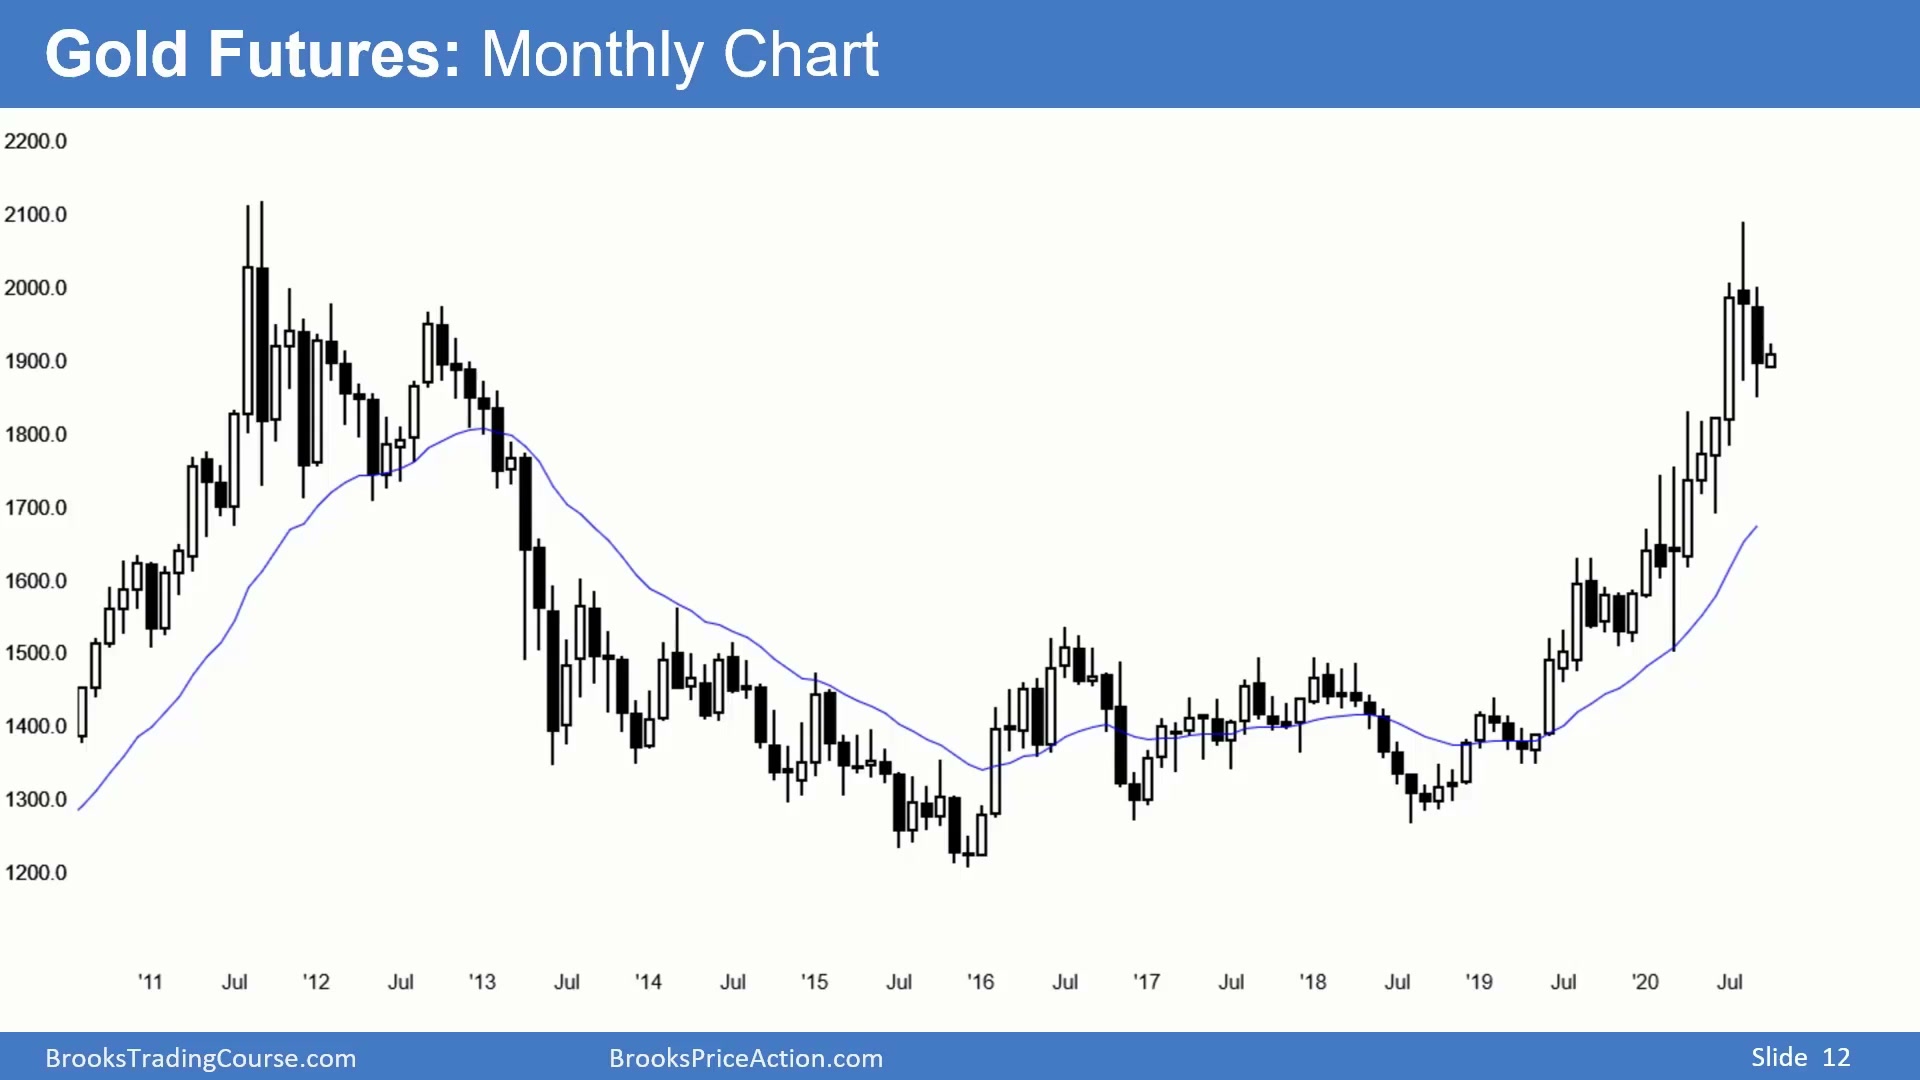
图中换成黄金期货月线。即使周期从 4 小时变成月线,复盘步骤仍不变:先看价格行为结构,再决定如何画线、标注模式和寻找可执行交易。周期越大,单根 K 线代表的时间越长,但人类交易行为仍会形成趋势、区间、突破、失败突破和反转。
去掉坐标后,月线也能按同一套方式标注
Time: 12:25
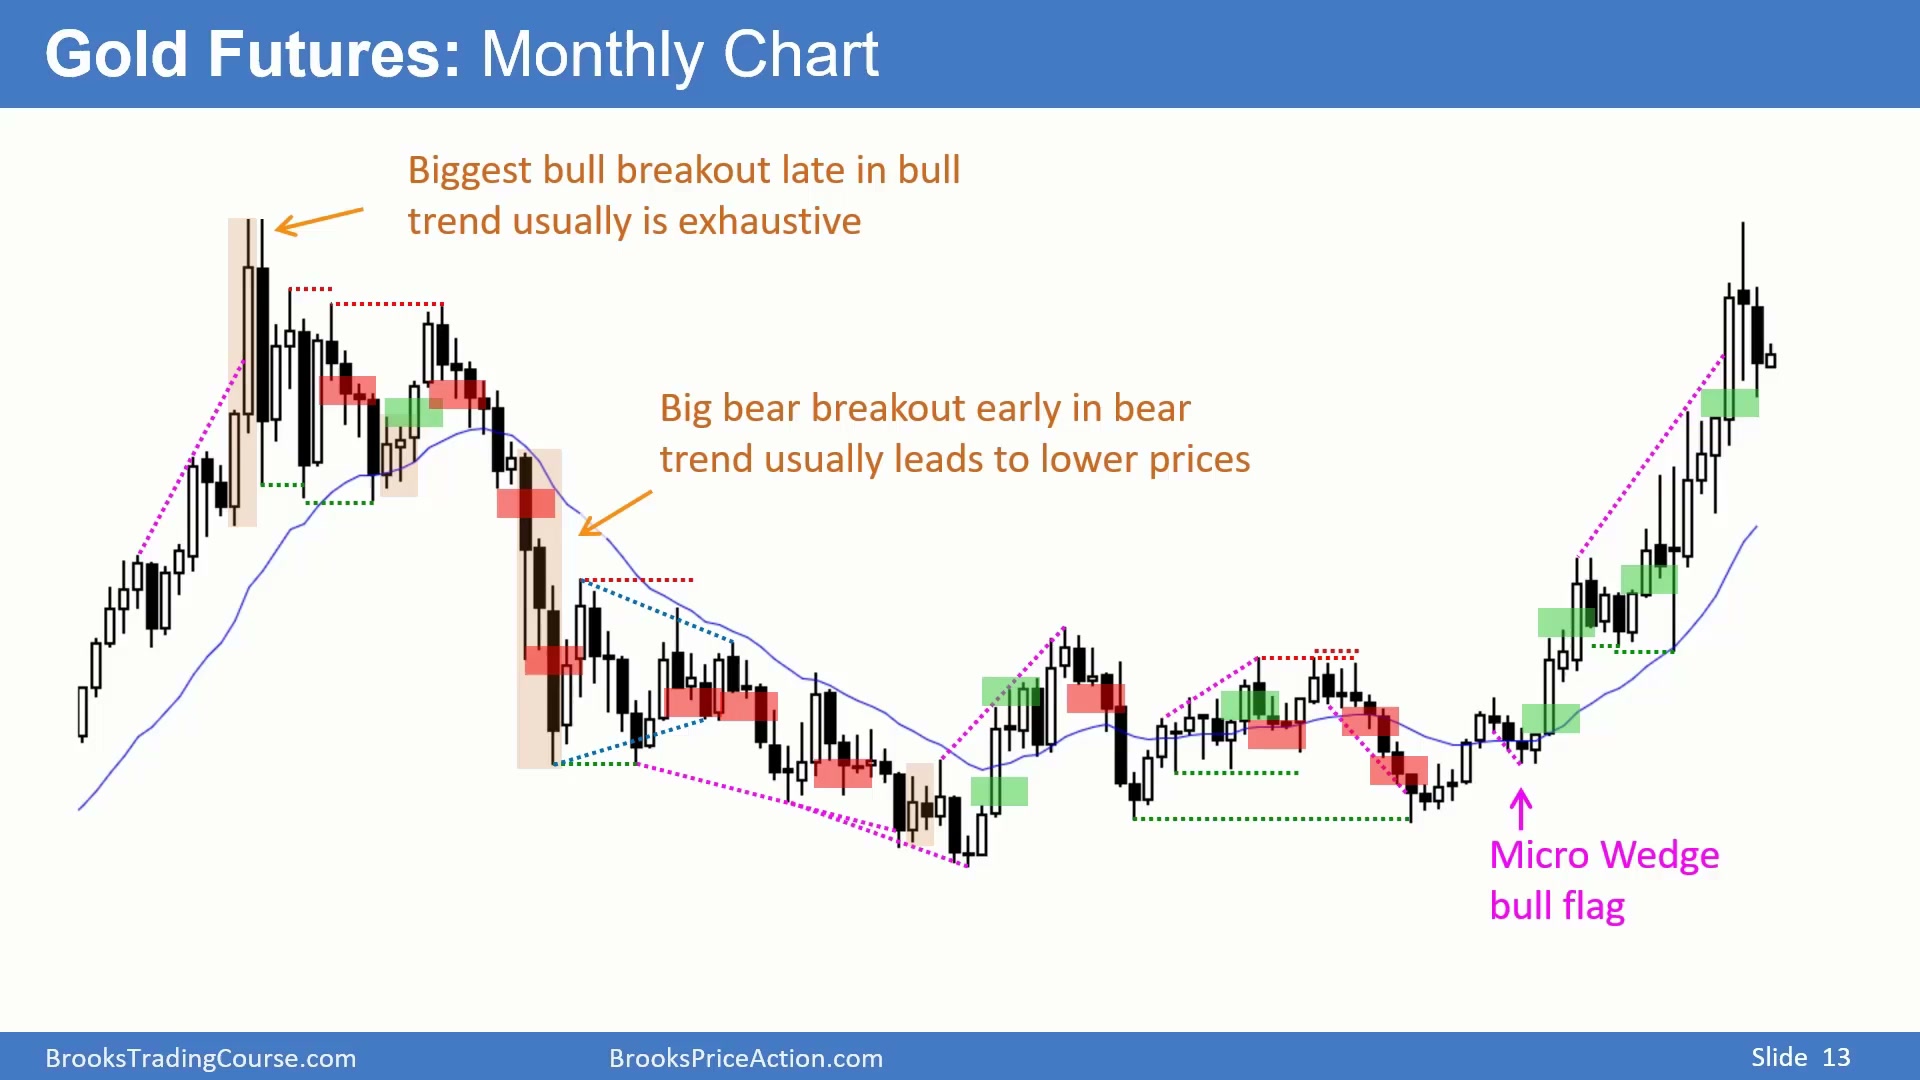
去掉价格和时间后,月线黄金图与其他市场、其他周期没有本质区别。复盘时始终先画线,因为线条能把趋势、通道、Wedge 和重要测试关系显现出来。后面的标注都建立在这一步之上。
从空白5分钟Emini图开始逐步标注
Time: 12:50
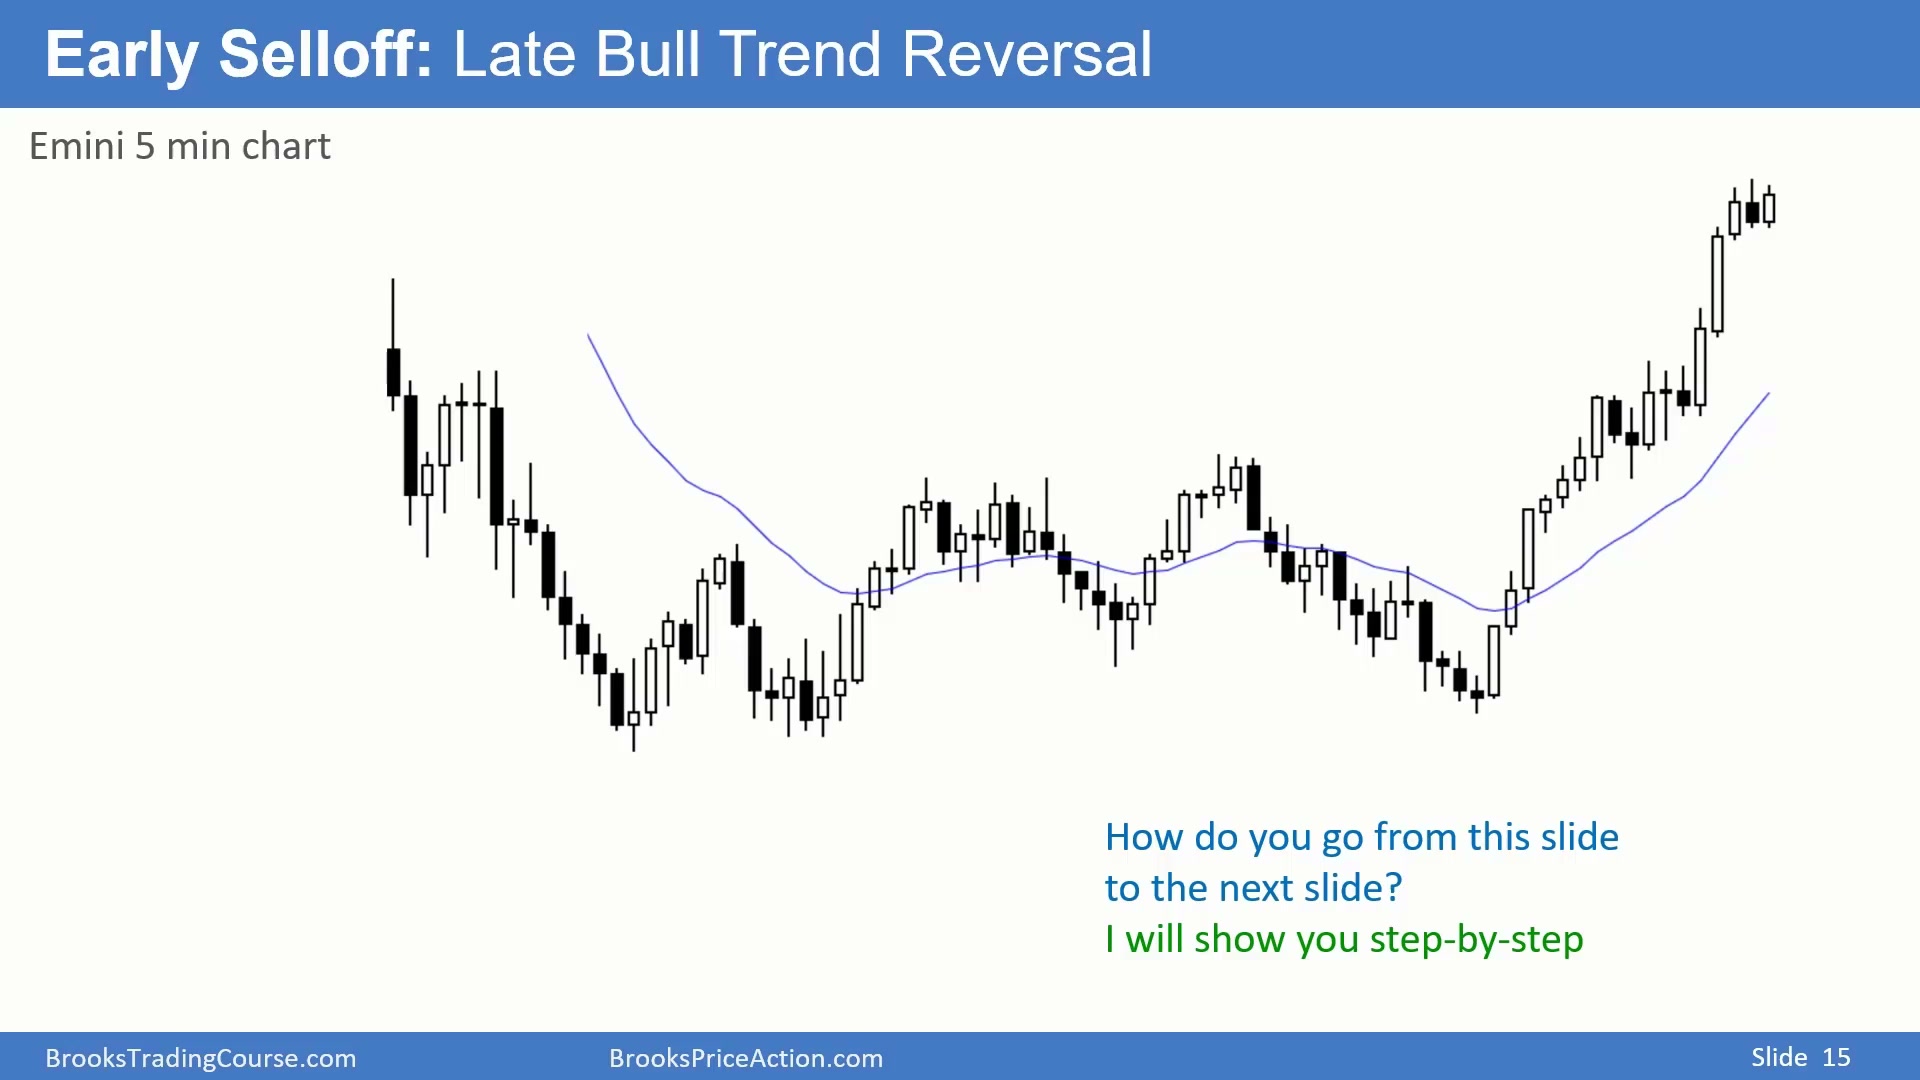
每天的复盘应从干净图表开始。图中只有 20-bar Exponential Moving Average,没有线条、盒子或文字。这是 Emini 5 分钟图,日盘共有 81 根 K 线。用空白图开始可以避免先入为主,迫使交易者按固定顺序逐步识别结构。
空白图也会暴露训练是否扎实。若没有现成标签,交易者必须自己判断哪里是趋势、哪里是区间、哪里可能是 Wedge 或 Triangle。这个过程比直接看完成图更慢,但能训练真正的识别能力。
完成图应包含线、进场盒和解释文字
Time: 13:20
完整复盘图包含所有画好的线、进场盒和大量文字框。文字框解释为什么某个位置可以买、为什么某个位置可以卖、为什么某些模式更重要。这样的图就是典型 Daily Setup 图:它既是当天行情的学习记录,也是未来遇到类似结构时的参考模板。
第一步先找通道和Wedge
Time: 13:45
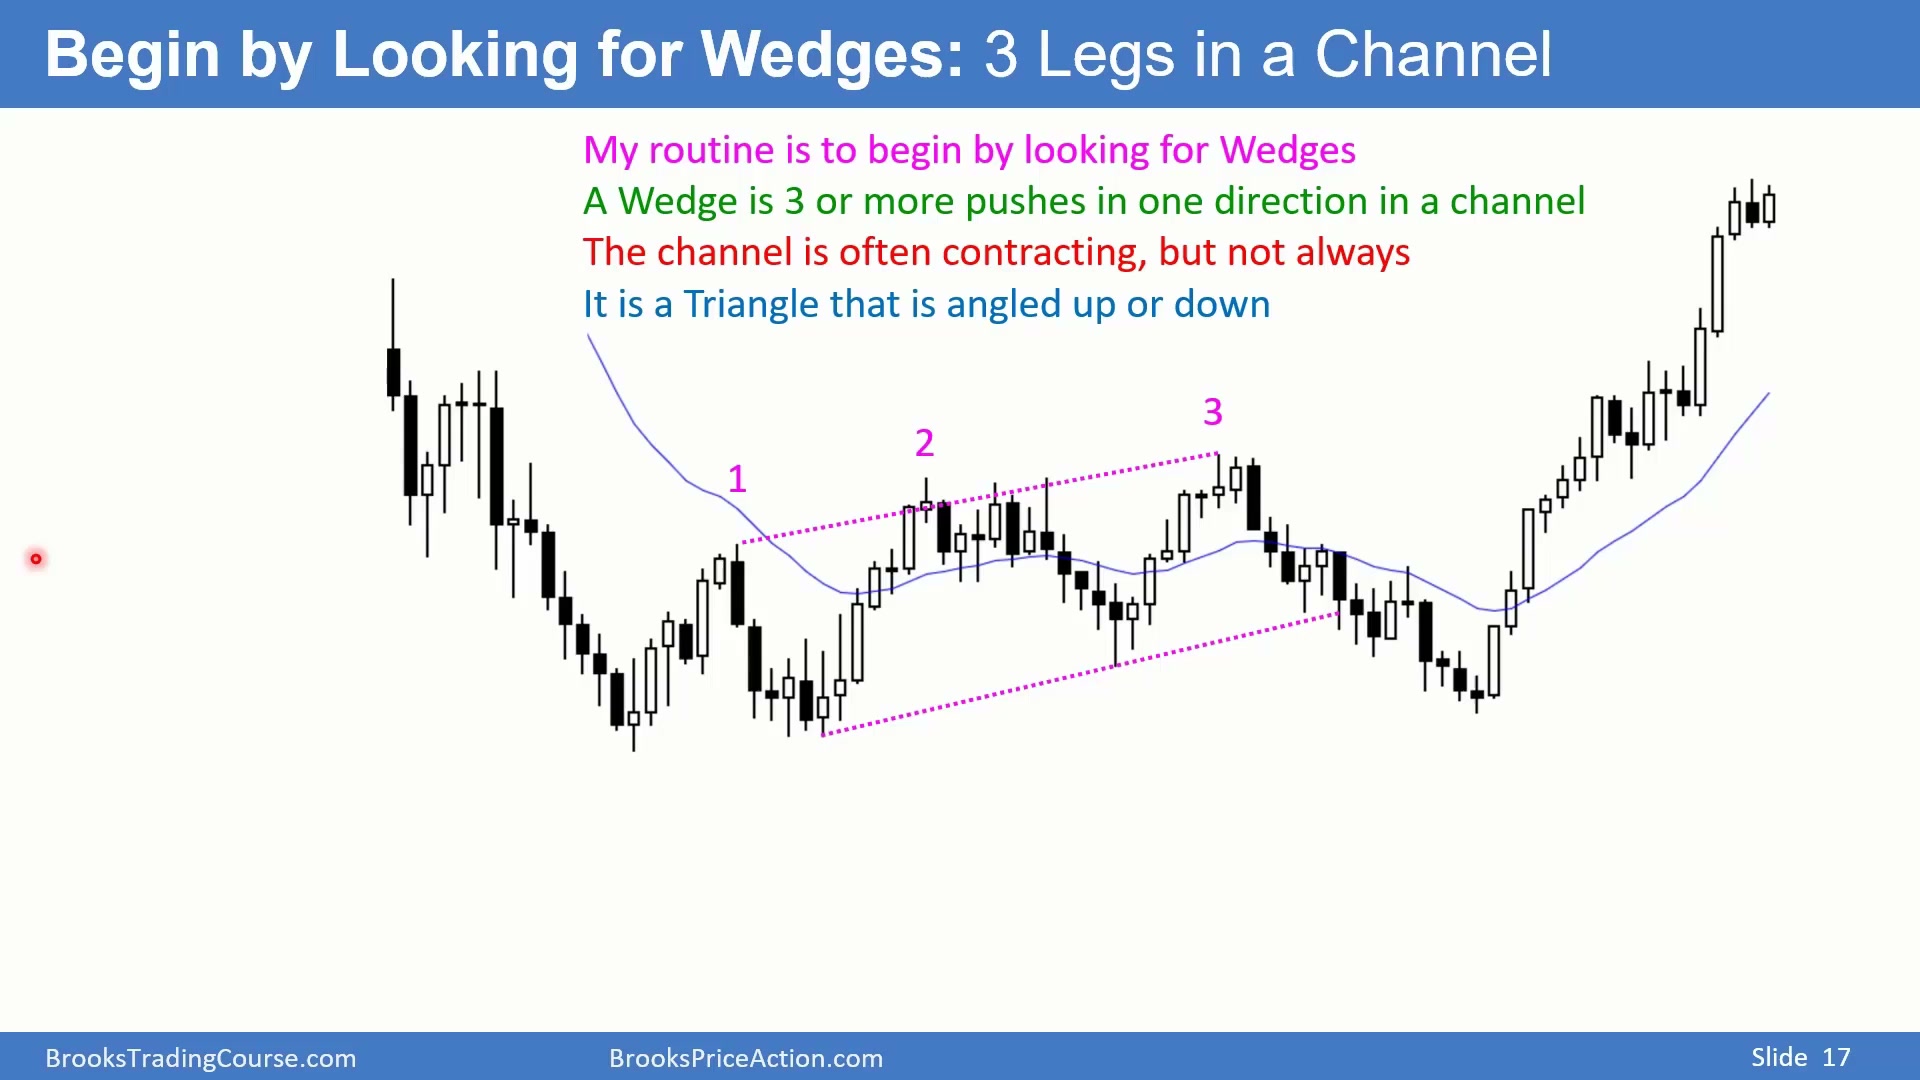
从空白图开始,先找 channel 和 Wedge。Wedge 本质上也是一种通道,但至少有三个推动点。图中的上涨可以用 Point 1、Point 2、Point 3 标出一个上升通道。Wedge 有时收敛,有时并不明显收敛;这里的线条大体平行,也可能略微收敛。
第一步只处理线条,不急着决定买卖。线条的作用是把市场正在推动的方向和可能衰竭的位置显出来。若上涨通道已经有三推,且第三推接近通道上轨,后面再出现熊 K 线或突破失败,就比随机位置的卖出更有背景。
上升Wedge只保留用于做空的上轨
Time: 14:20
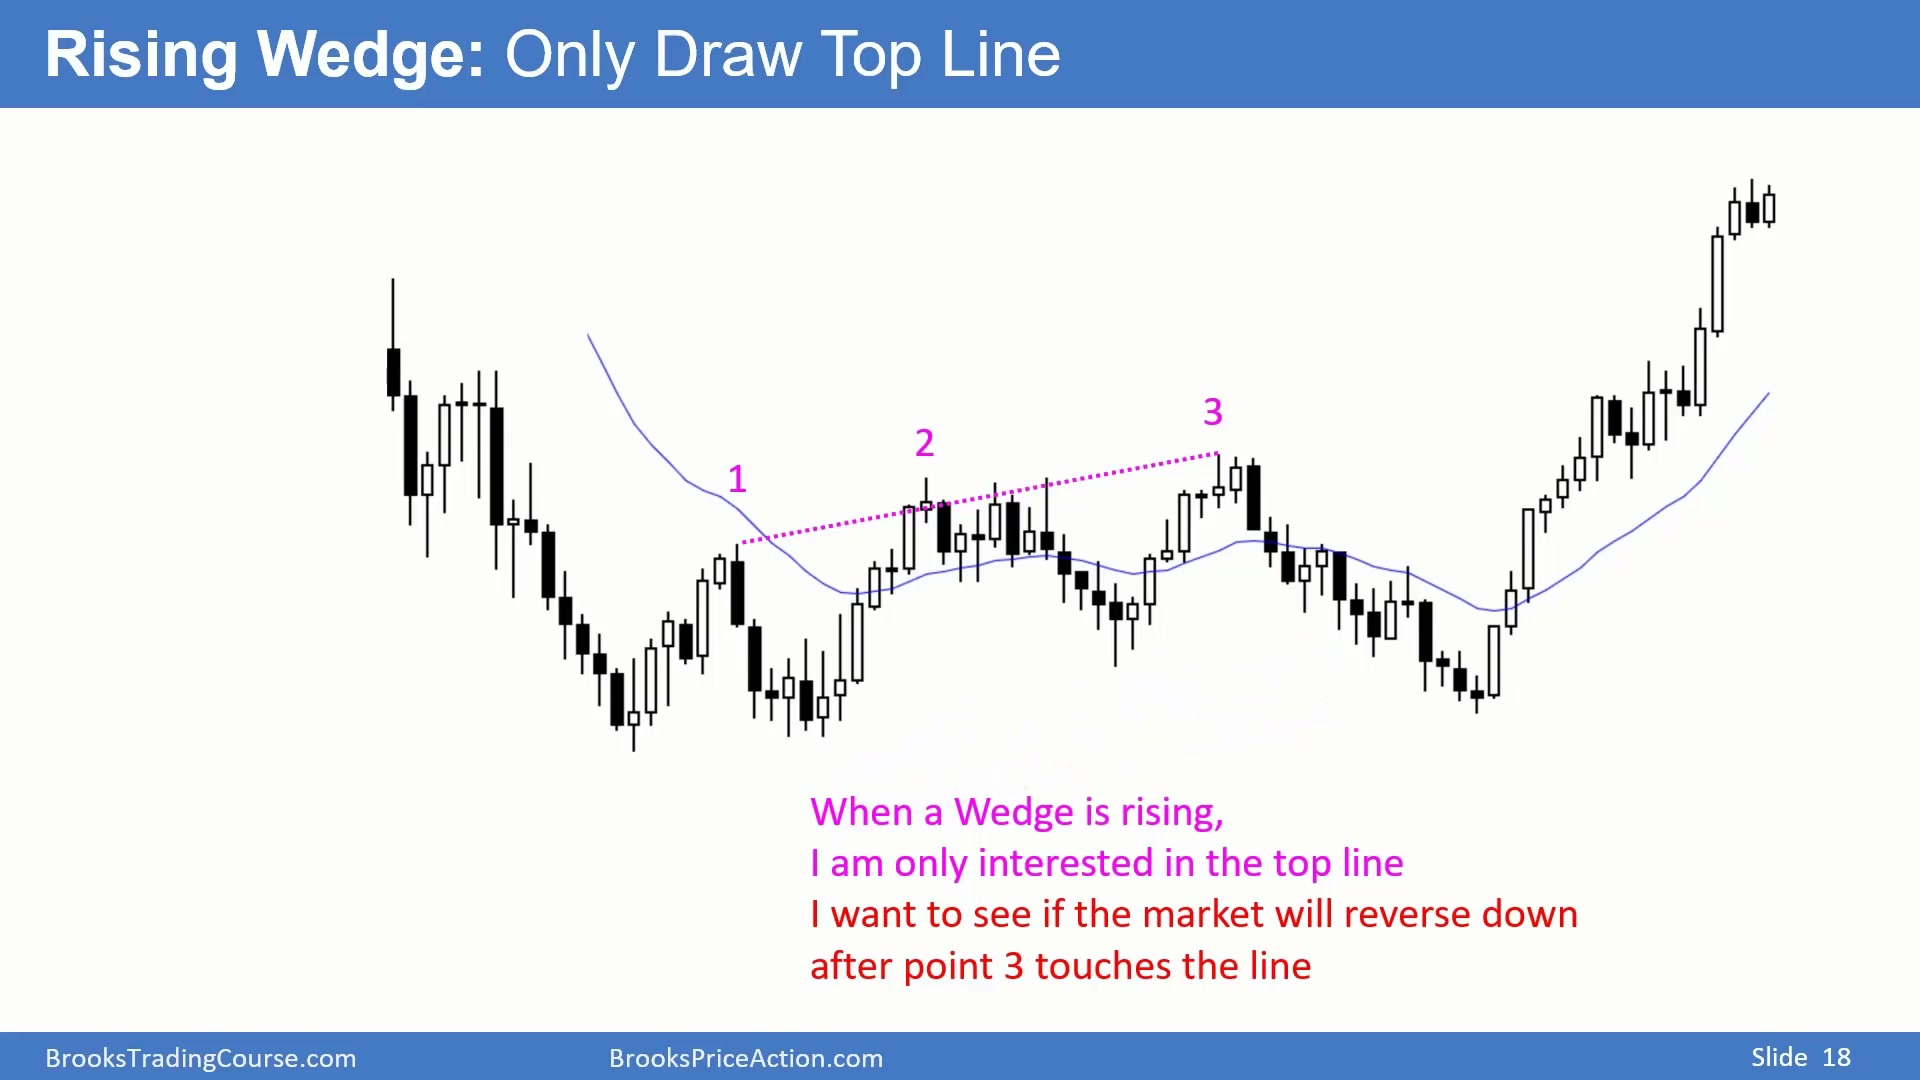
当 Wedge 向上运行时,交易目标通常是寻找向下反转,因此真正重要的是上方通道线。图表上不要放太多不必要的线;如果下轨对当前交易判断帮助不大,可以不画,只保留用于观察反转的上轨。
画Wedge线时优先选择有overshoot的版本
Time: 14:40
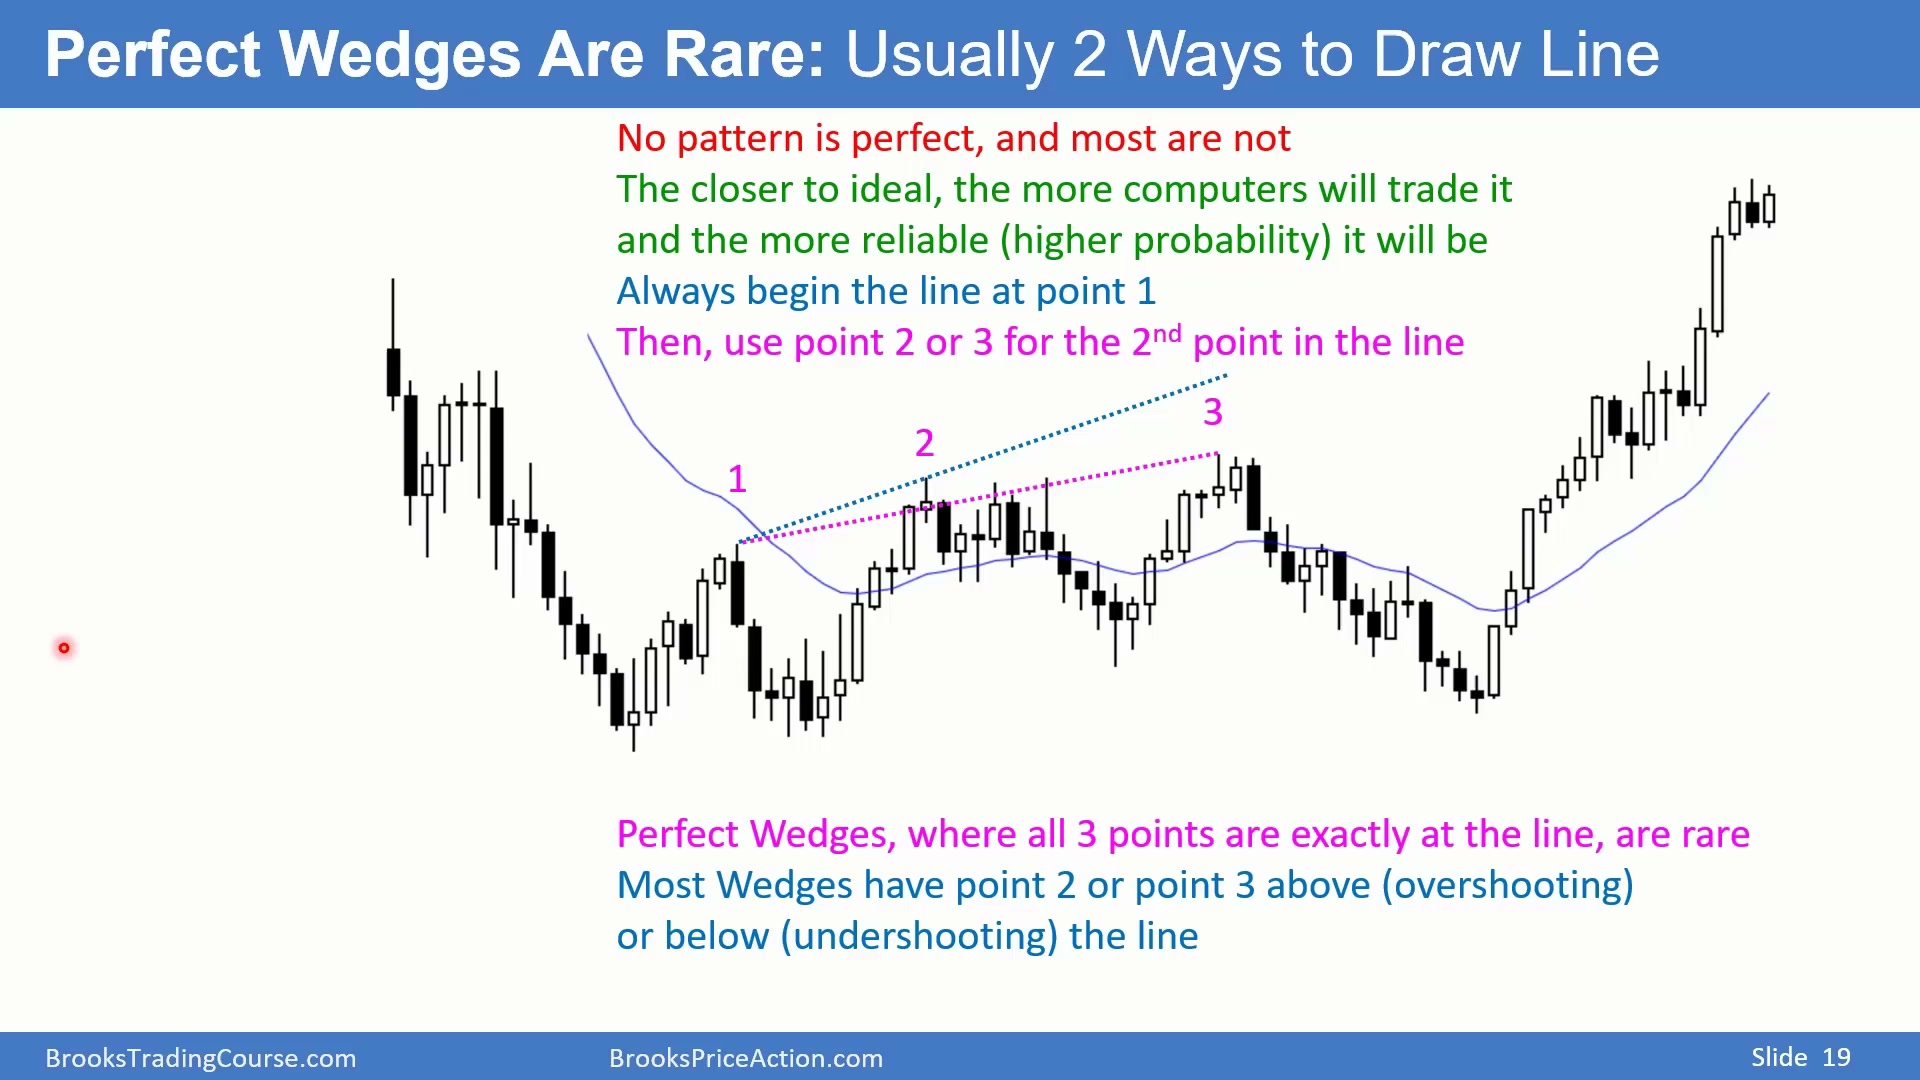
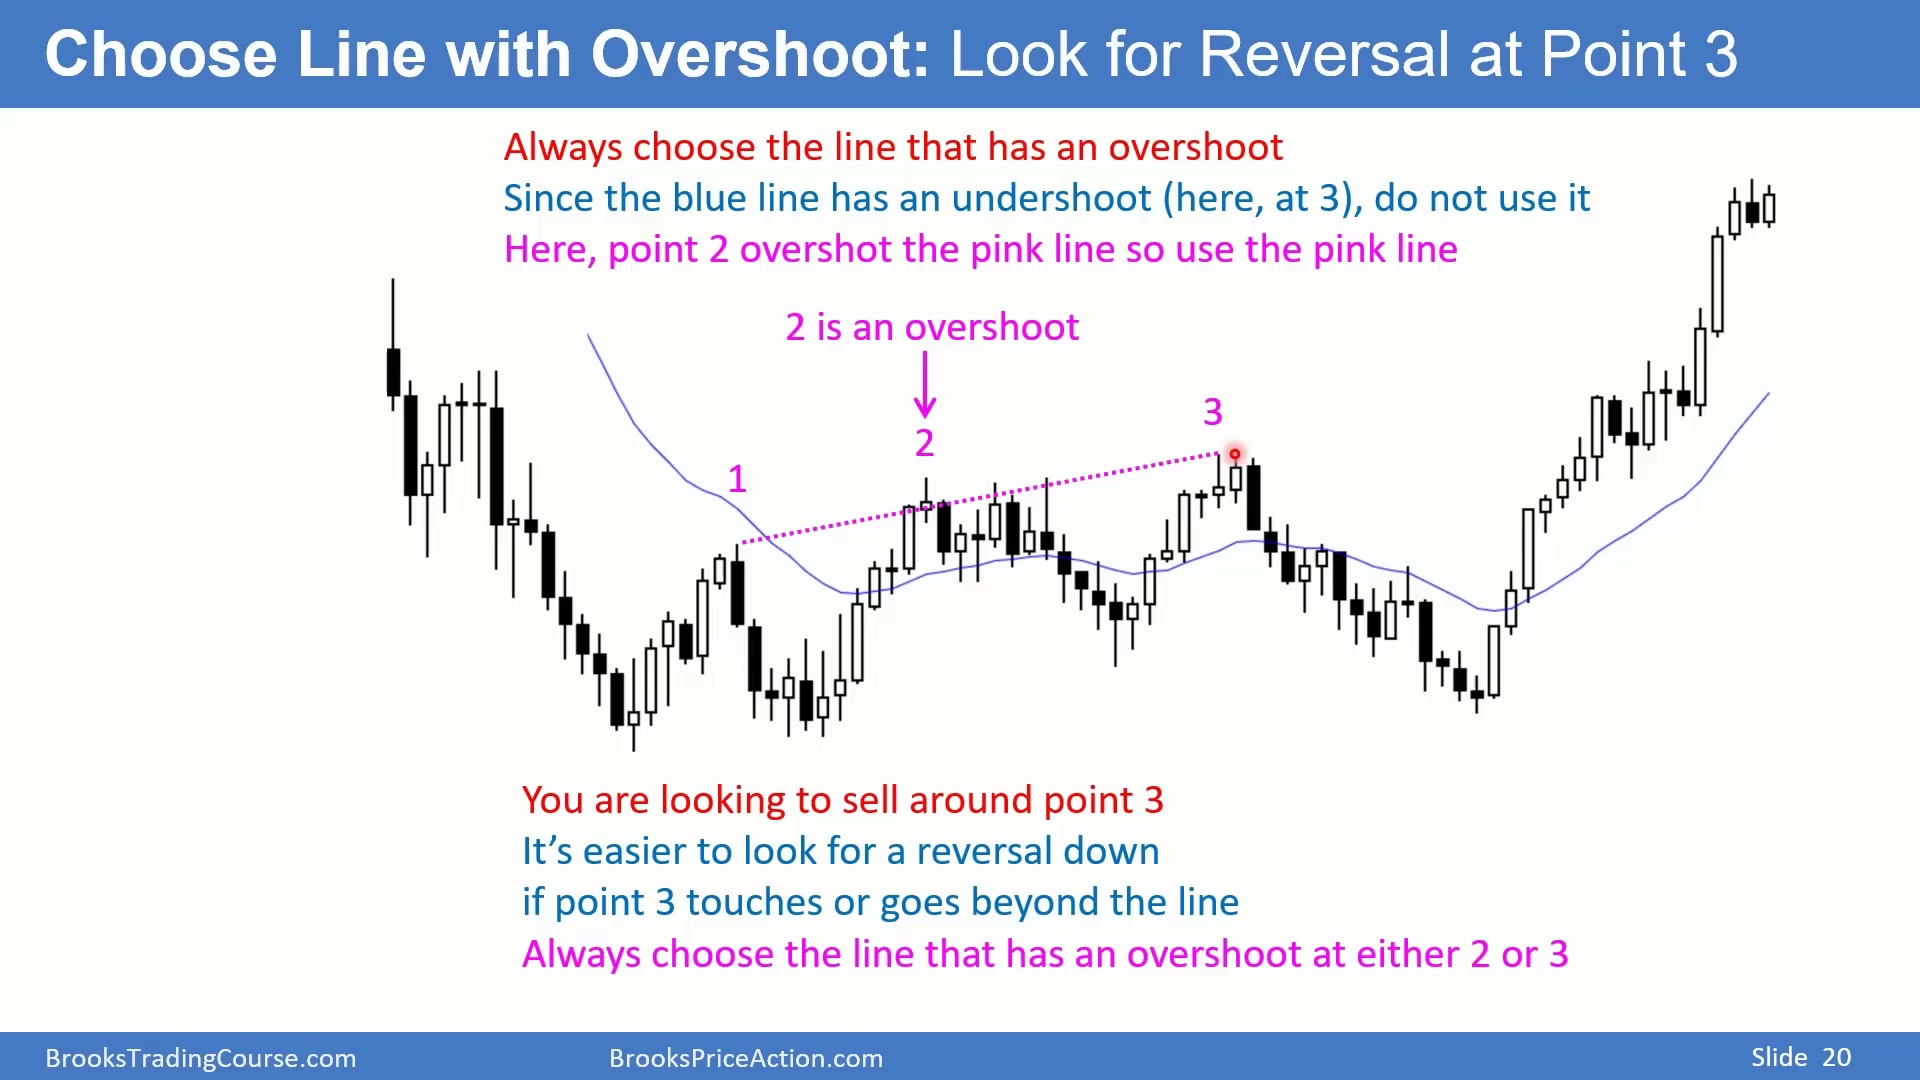
大多数模式并不完美,三点很少刚好都落在线上。模式越完美,越容易被电脑和交易者发现,可靠性也越高;但真实图表通常会有一个点超出或未触及线条。画 Wedge 时可以从 Point 1 开始,用 Point 2 或 Point 3 画线,因此同一组三点常有两条候选线。
图中蓝线由 Point 1 和 Point 3 画出,Point 2 形成 undershoot;粉线由 Point 1 和 Point 2 画出,Point 3 或 Point 2 的关系形成 overshoot。复盘时要比较这些候选线,选择更能解释价格行为的那一条。
选择 overshoot 版本,是因为它显示市场曾尝试超出通道却没有继续加速。交易者真正关心的不是几何线条是否漂亮,而是价格在通道边界附近是否出现过度推进、失败和反向压力。带有这种失败信息的线,更适合后续寻找反转。
有overshoot的通道线更适合寻找反转
Time: 16:10
优先选择带 overshoot 的线。Overshoot 说明价格曾经冲过通道边界,随后如果开始反转,往往更适合作为通道末端的交易背景。蓝线对应的是 undershoot,因此不用;粉线在 Point 2 附近提供 overshoot,更适合保留。
在图中的上涨通道里,若价格在 Point 1 和 Point 2 所形成的可能上轨附近开始向下反转,就可以寻找做空机会,尤其是出现收在低点附近的熊 K 线时。此时预期是从通道顶部向下回落,而不是继续追高。
第二组通道也按overshoot原则筛选
Time: 17:05
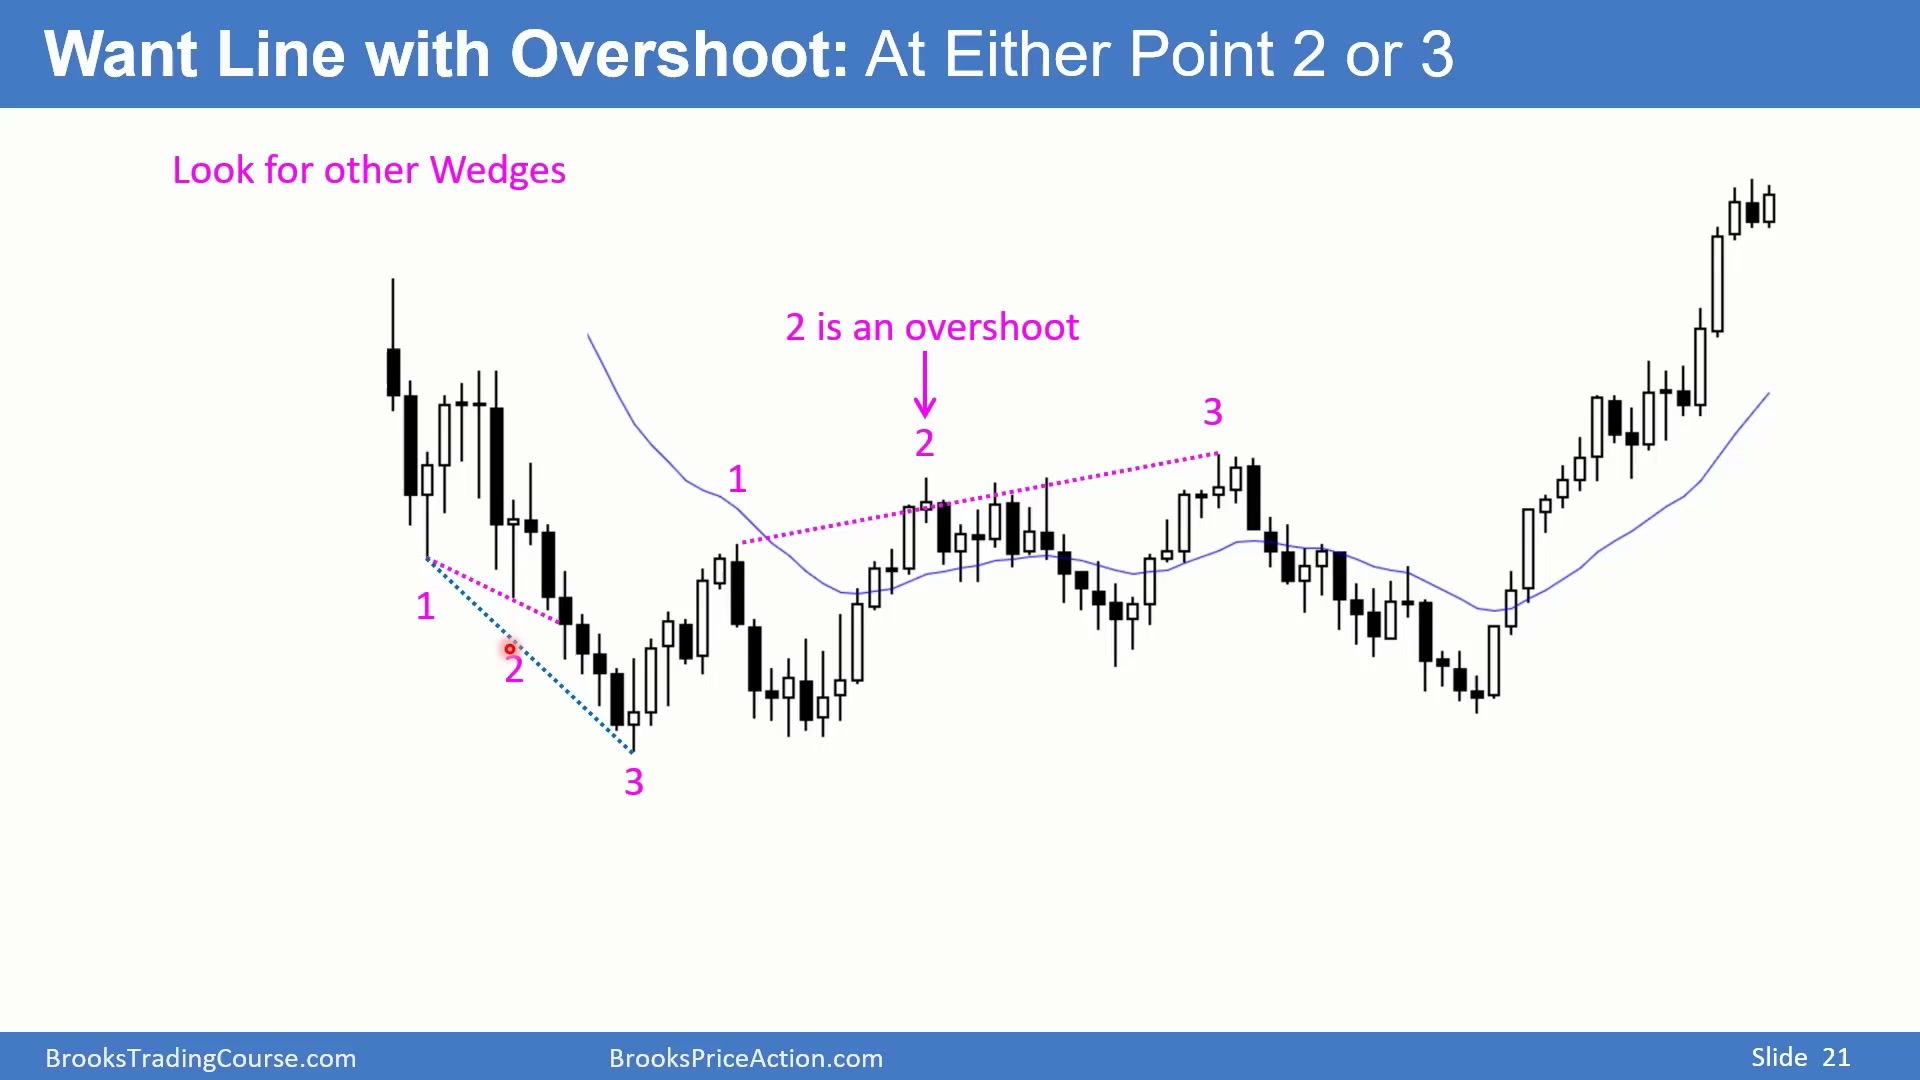
第一条线画完后,继续寻找其他 channel 和 Wedge。图中还有一个 bear channel,也有至少三个推动点。可以用 Point 1 和 Point 3 画线,也可以用 Point 1 和 Point 2 画线。若用 Point 1 和 Point 2,Point 3 对这条线形成 overshoot;若另一条线只产生 undershoot,就不如 overshoot 版本有用。
同一张图表上往往有许多 Wedge 变体。复盘的目的不是只找一个“标准答案”,而是把可能影响交易判断的结构都看出来,再保留最能解释后续反转或延续的线。
不同Wedge要根据实际超越点选择不同连线
Time: 18:00
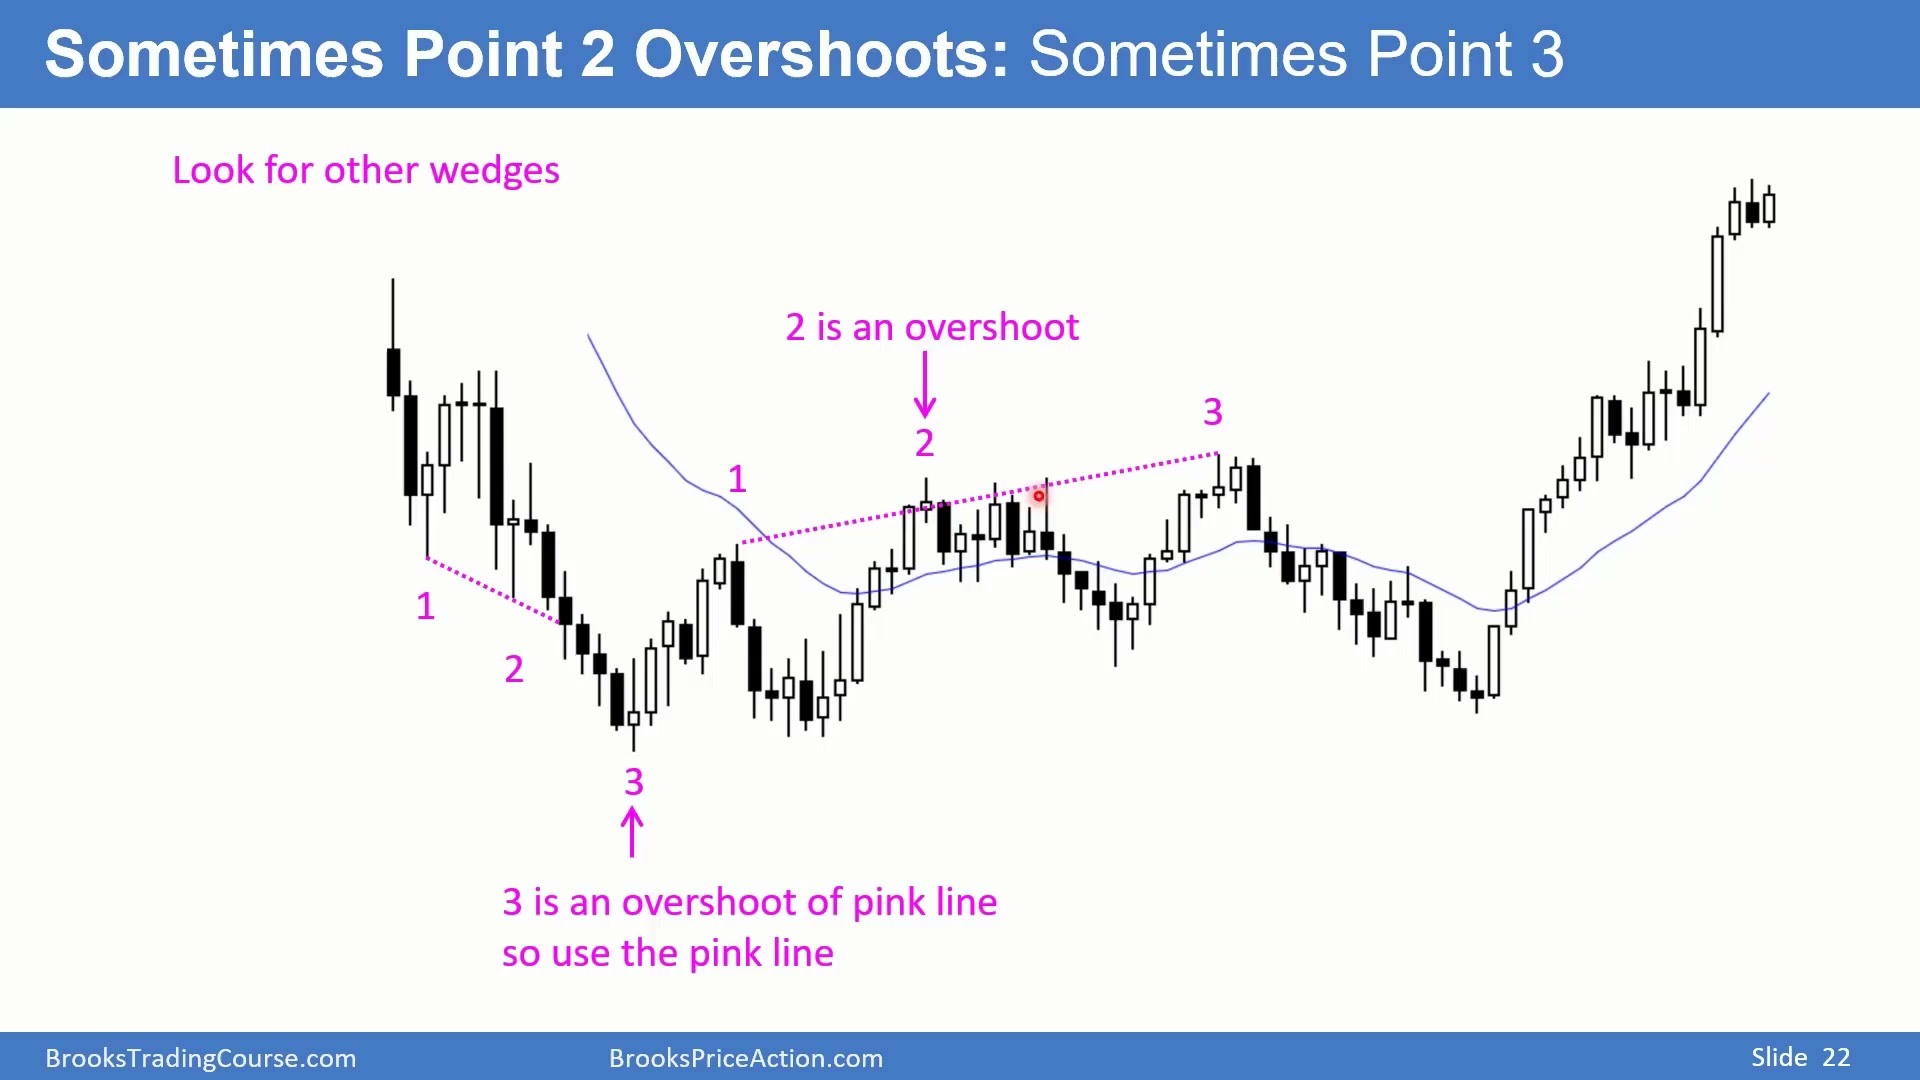
有的 Wedge 用 Point 1 到 Point 2 可以让 Point 3 成为 overshoot;有的则要用 Point 1 到 Point 3,才能让 Point 2 成为 overshoot。图中两个例子正好相反,因此不能机械固定连哪两个点。每次都要问:哪条线更能显示市场在通道边界处的过度推进和随后的失败?
微型Wedge和失败Wedge也要标出来
Time: 18:30
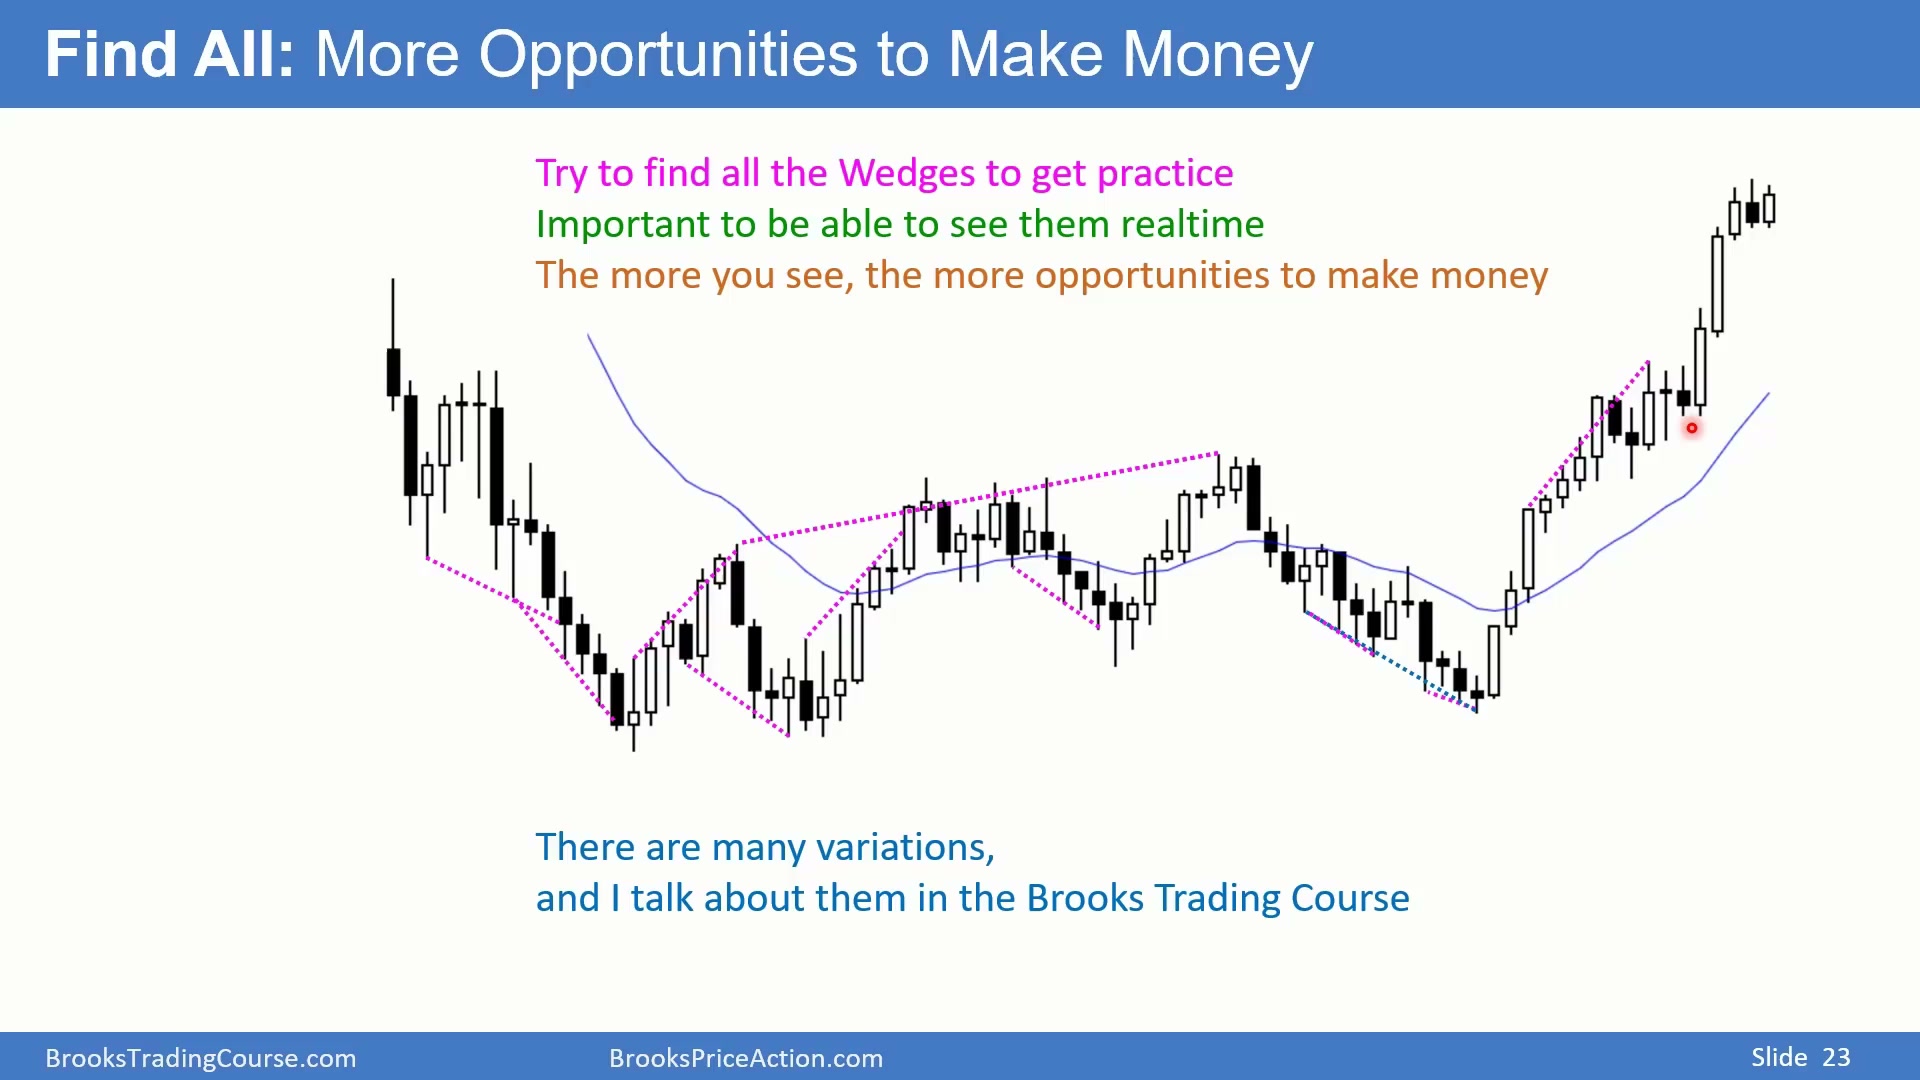
继续把所有可见 Wedge 都加到图上,有些很小,甚至需要用很短的线标出。图中有三推下跌的小型结构,这就是 Micro Wedge;另一个区域可以用一、二、三甚至四个点画出通道,只要至少有三个点,就可以作为 Wedge 观察。
Wedge 不一定成功反转。图中有一组三推上涨,且上涨越来越紧,形成类似 Parabolic Wedge 的 Tight Channel;如果未能在熊 K 线下方反转,反而向上突破,就要把它当作 Wedge Top 失败,寻找向上买入机会。模式失败本身也是交易信息。
微型结构尤其容易被忽略,因为它们可能只跨越几根 5 分钟 K 线。但在更小周期上,它们可能已经是完整的 Wedge、Double Top 或 Double Bottom。复盘时把这些小结构也标出来,可以训练交易者在实时行情中更早看见“市场正在尝试但失败”的过程。
Double Top和Double Bottom需要灵活识别
Time: 19:40
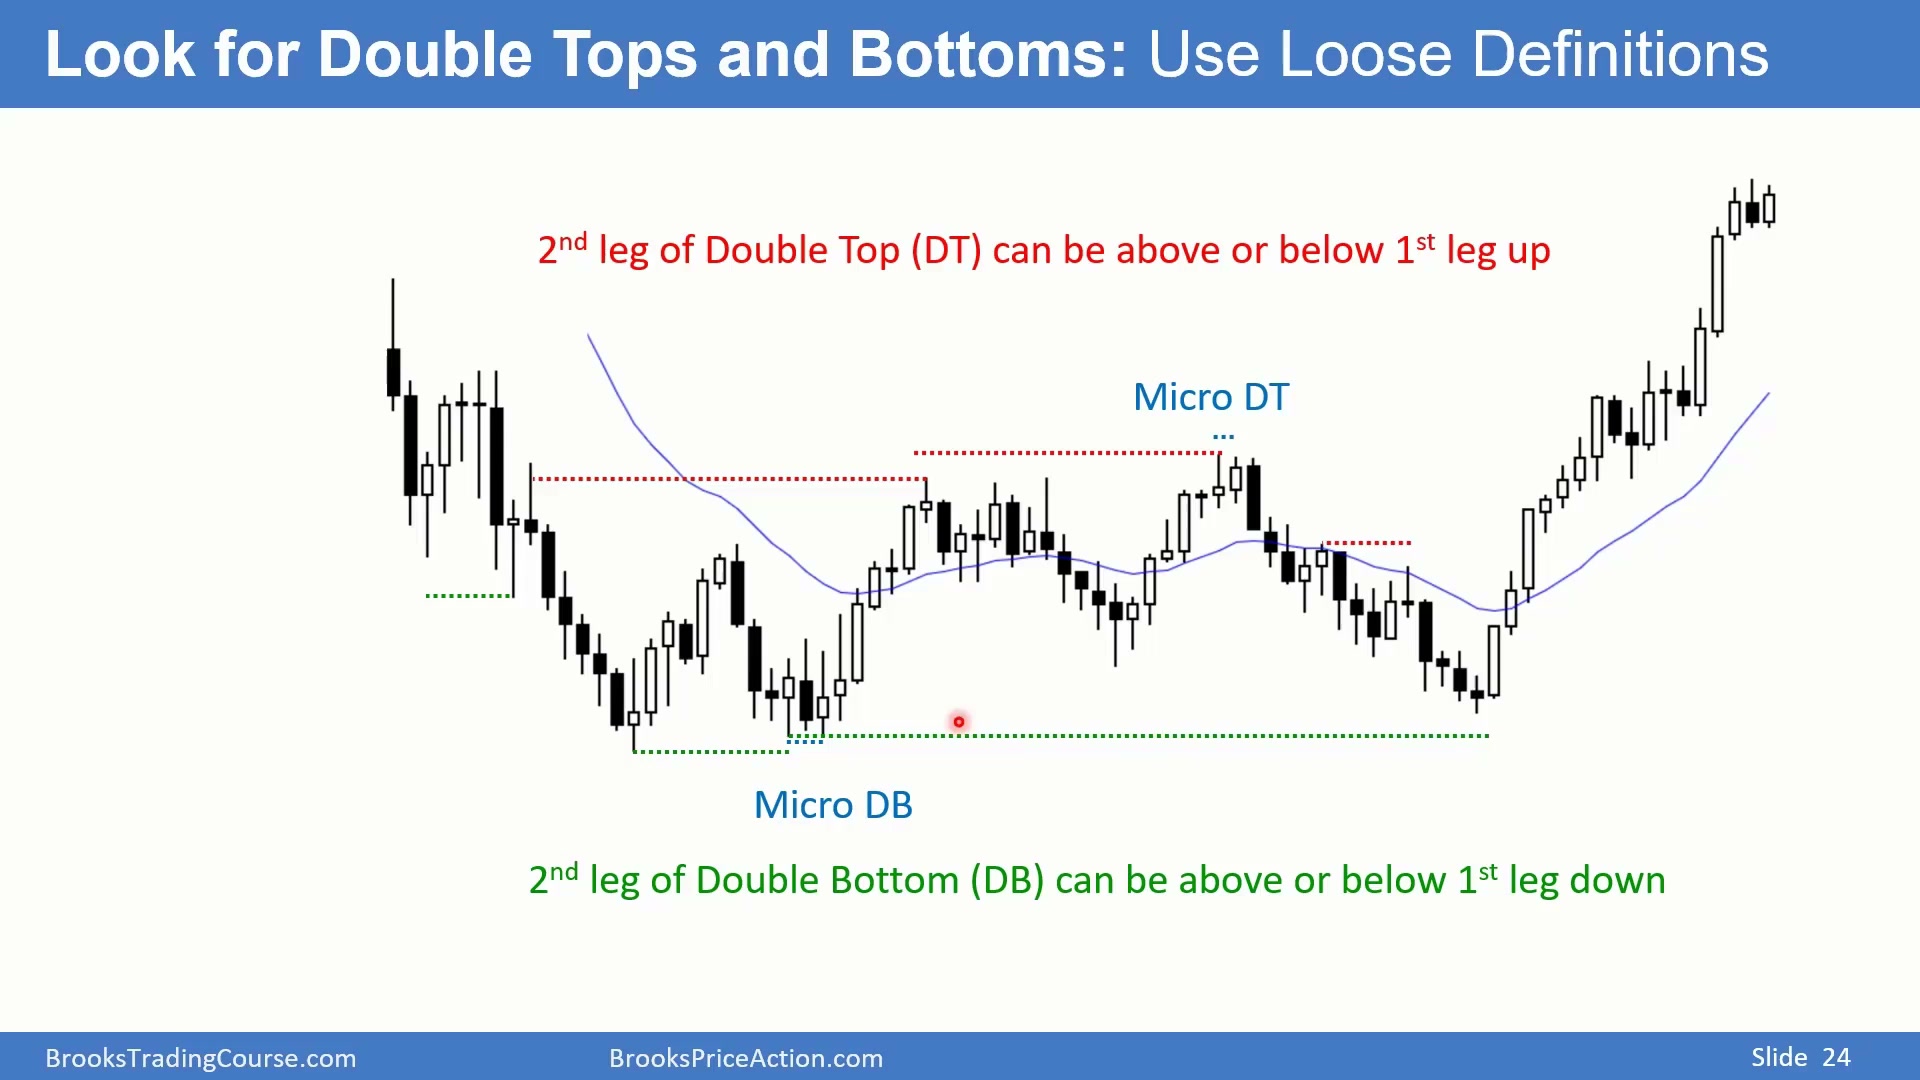
Double Top 和 Double Bottom 很少完美。如果只寻找完全相等的高低点,交易机会会少很多。越完美的模式越可靠,但实际复盘必须保持灵活。
图中一段上涨突破左侧高点后开始转弱,需要向左寻找是否存在 Double Top。这个高点可能只是测试左侧一组高点,也可能是 Lower High Double Top;同时该区域已有 Wedge,一、二、三推到高位。Wedge 加 Double Top 会增加做空理由,如果出现收在低点附近的熊 K 线,就更值得考虑在其下方卖出。近端还有 Micro Double Top:一根 K 线上冲回落,随后又上冲并转下,这也加强了空头背景。
图中还出现 Double Top Bear Flag:市场尝试反转向上,但在前高附近失败。下方则要找 Double Bottom。第二个低点可以低于第一个低点,也可以高于第一个低点;因此既有 Lower Low Double Bottom,也有 Higher Low Double Bottom。若一个大型 Double Bottom 的第二个低点位于熊趋势低点之上,它可能发展成 Double Bottom Higher Low,并进一步成为 Major Trend Reversal 的基础。
识别 Double Top 和 Double Bottom 时,最重要的是“测试”关系,而不是高低点必须完全相等。一个略高的第二高点可能是 Higher High Major Trend Reversal,一个略低的第二高点可能是 Lower High Double Top;一个略高的第二低点则可能是 Higher Low Major Trend Reversal。复盘时要把这些变体都当成同一类心理测试:市场再次到达重要区域,看看原方向是否还能继续。
图中多个 Double Top 和 Double Bottom 彼此嵌套,也说明同一位置可以同时有几种标签。Wedge 到达高位后再测试左侧高点,Micro Double Top 又出现在局部 K 线上;下方的 Lower Low 或 Higher Low Double Bottom 则帮助判断空头是否仍能继续。复盘时把这些测试关系都标出,能让后续买卖盒更有依据。
Triangle既可以收敛也可以扩张
Time: 22:09
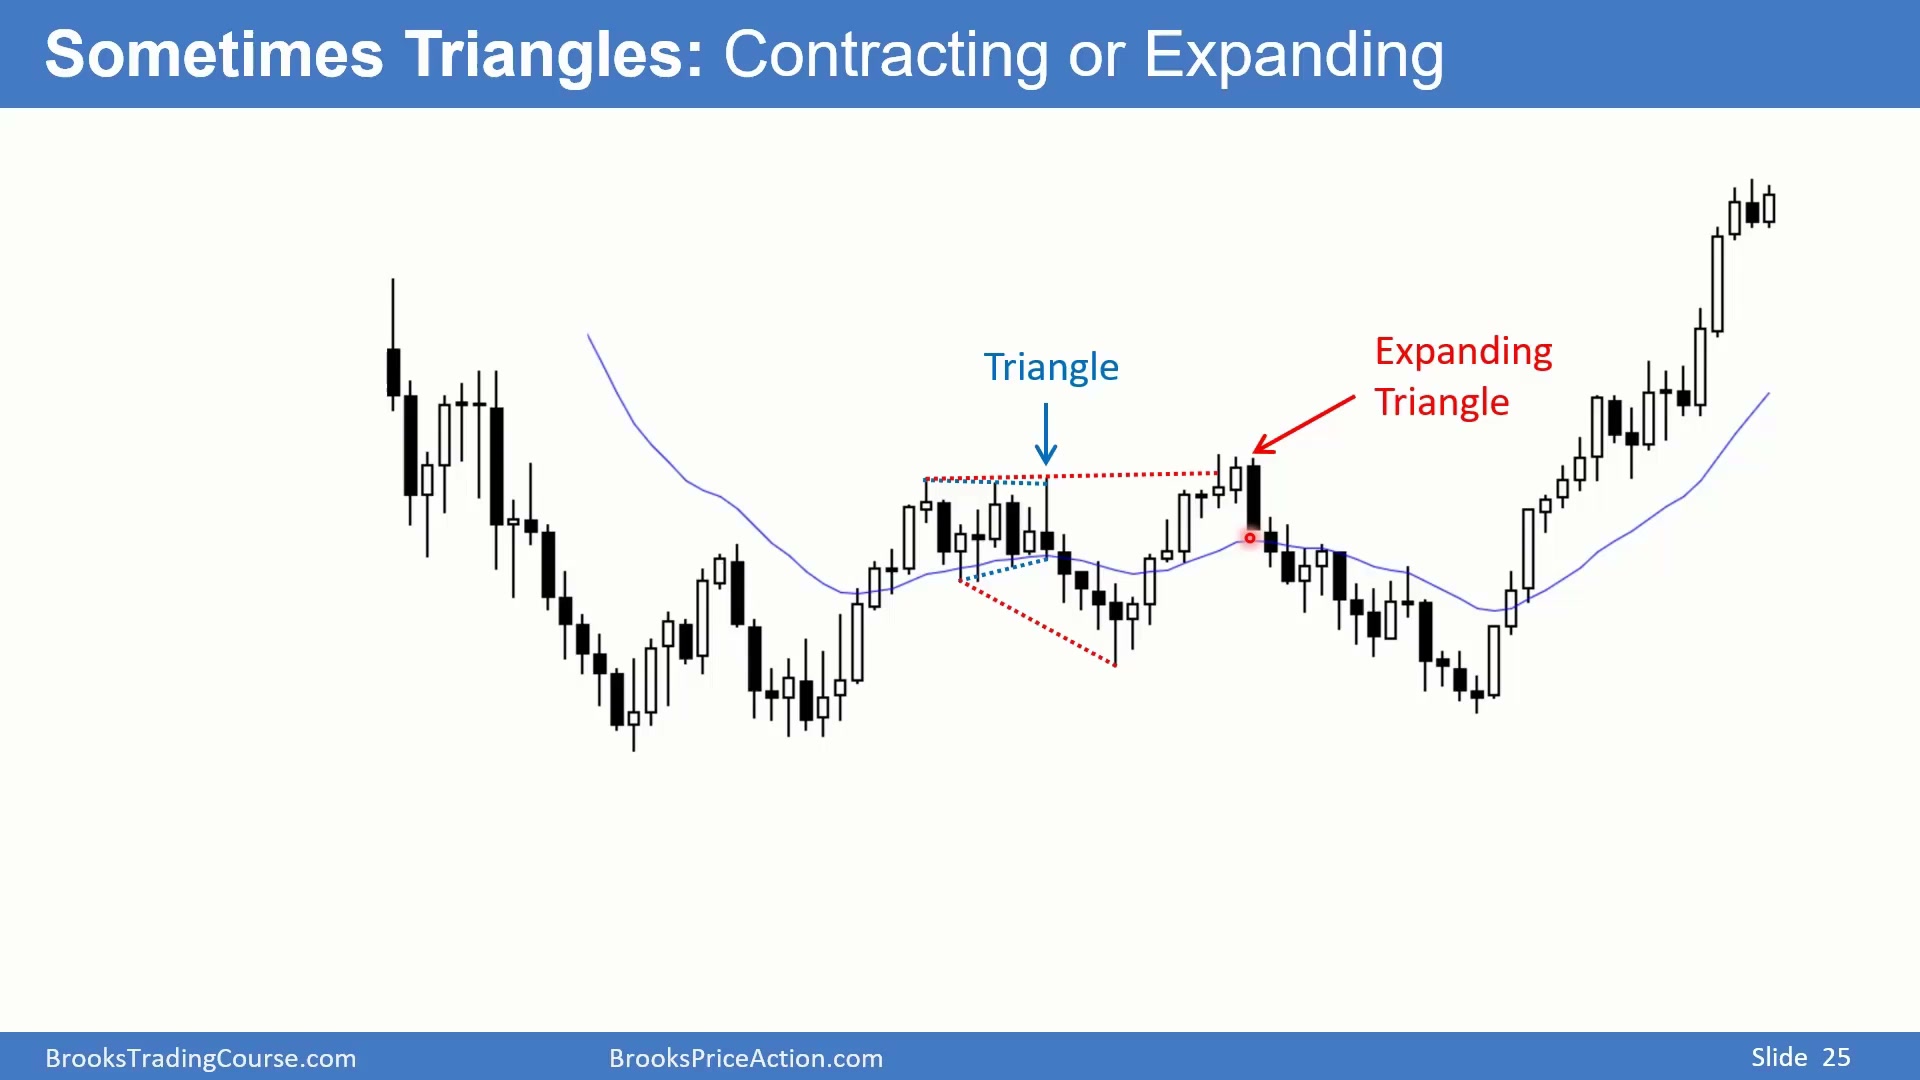
图表上经常出现 Triangle,而且也很少完美。收敛 Triangle 可以由不断抬高的低点和大致横向的高点构成;价格尝试向上突破后反转向下,就说明突破失败。扩张 Triangle 则相反,高点不断创新高、低点也不断创新低,常见结构是五点:一、二、三、四、五,并伴随反复的假突破。
Triangle 是反转和 BreakOut Mode 结构。新低、新高、新低、新高之后,交易者会等待其中一个方向的突破;若出现合适的熊 K 线,可以在其下方卖出。完成线条结构后,还要继续寻找特殊 K 线,例如大 K 线、小 K 线、Inside Bar 和 Outside Bar。
连续强牛K线是Bull Surprise
Time: 23:03
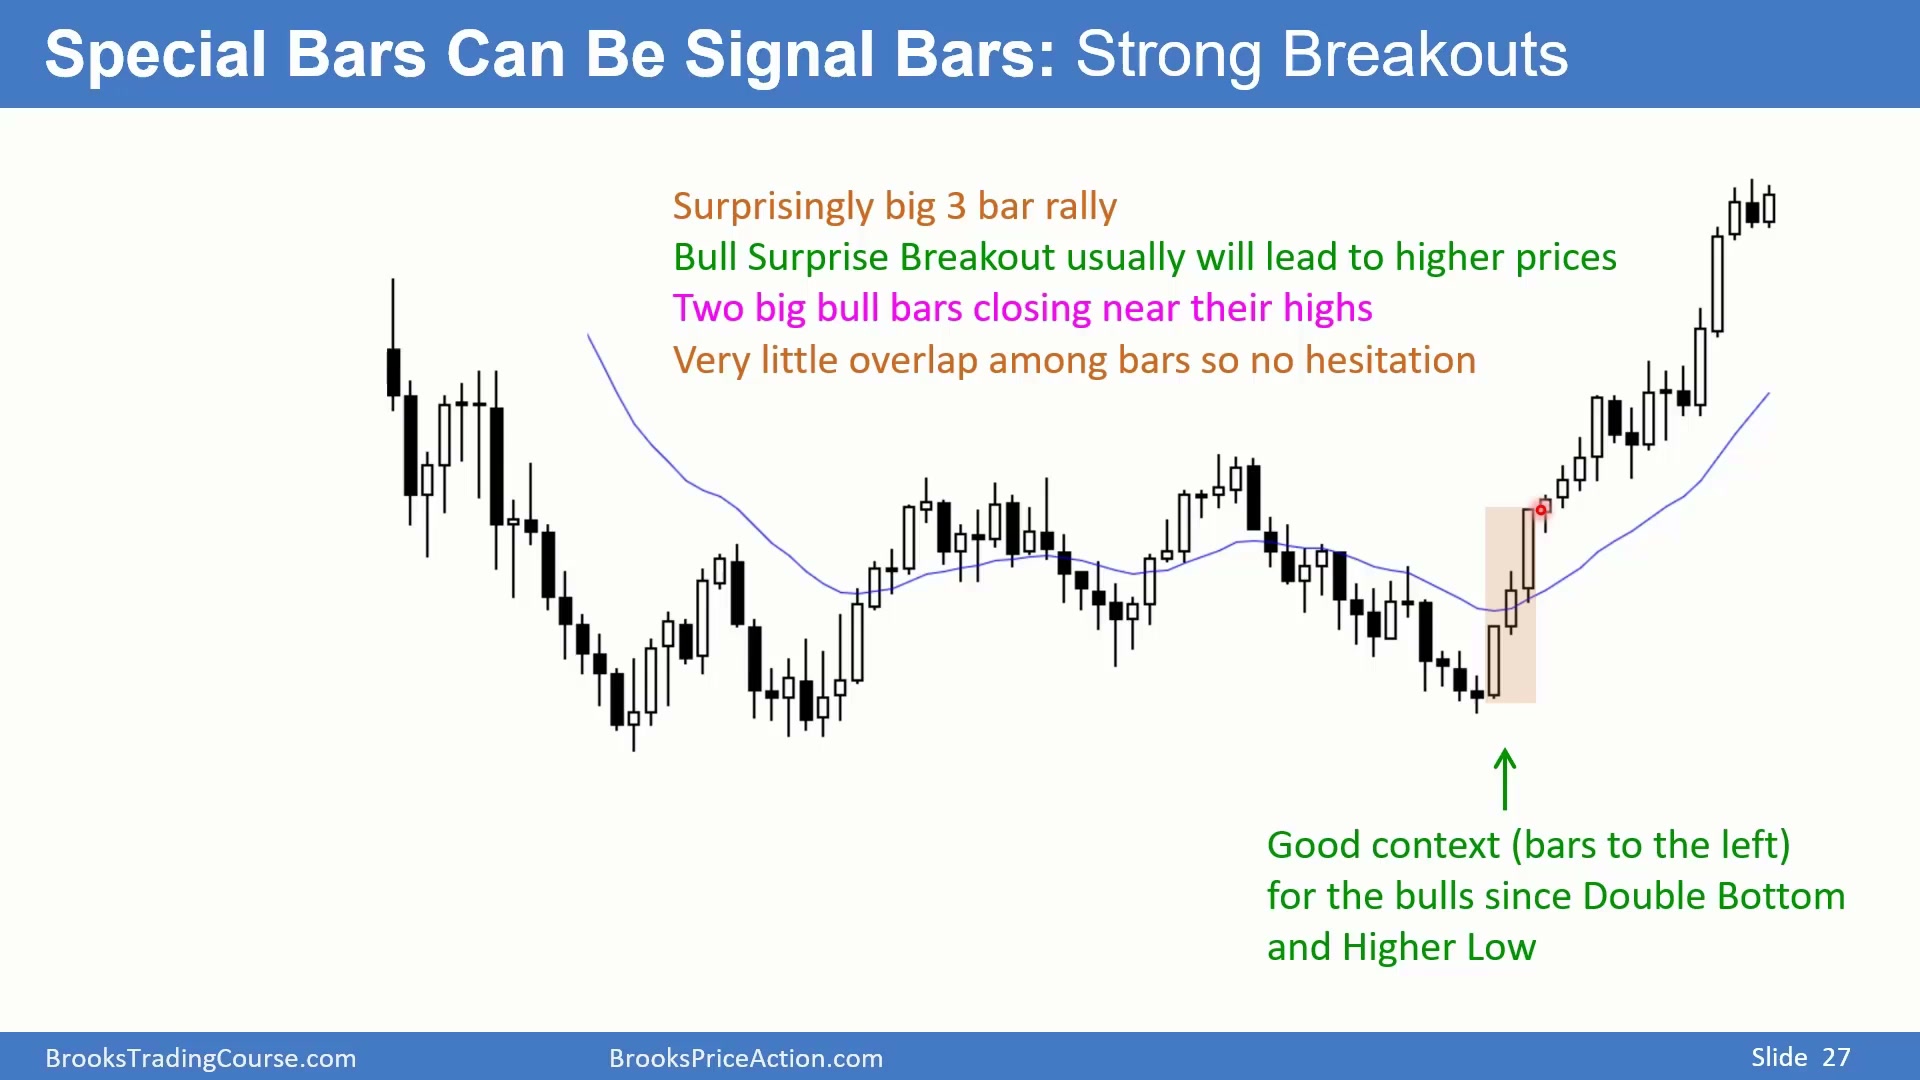
图中出现三根连续牛 K 线,重叠很少,其中几根收在高点附近。这代表持续、强劲的买盘。背景也配合:下方可能是与左侧低点形成的 Double Bottom,且第二个低点高于更早的低点,所以也可能是 Double Bottom Higher Low Major Trend Reversal。
这类出乎意料的强上涨属于 bull surprise。Bull surprise 往往会带来更高价格,因为很多交易者会在强牛 K 线之后追买,空头也会被迫回补。
Consecutive Outside Bars形成BreakOut Mode
Time: 23:40
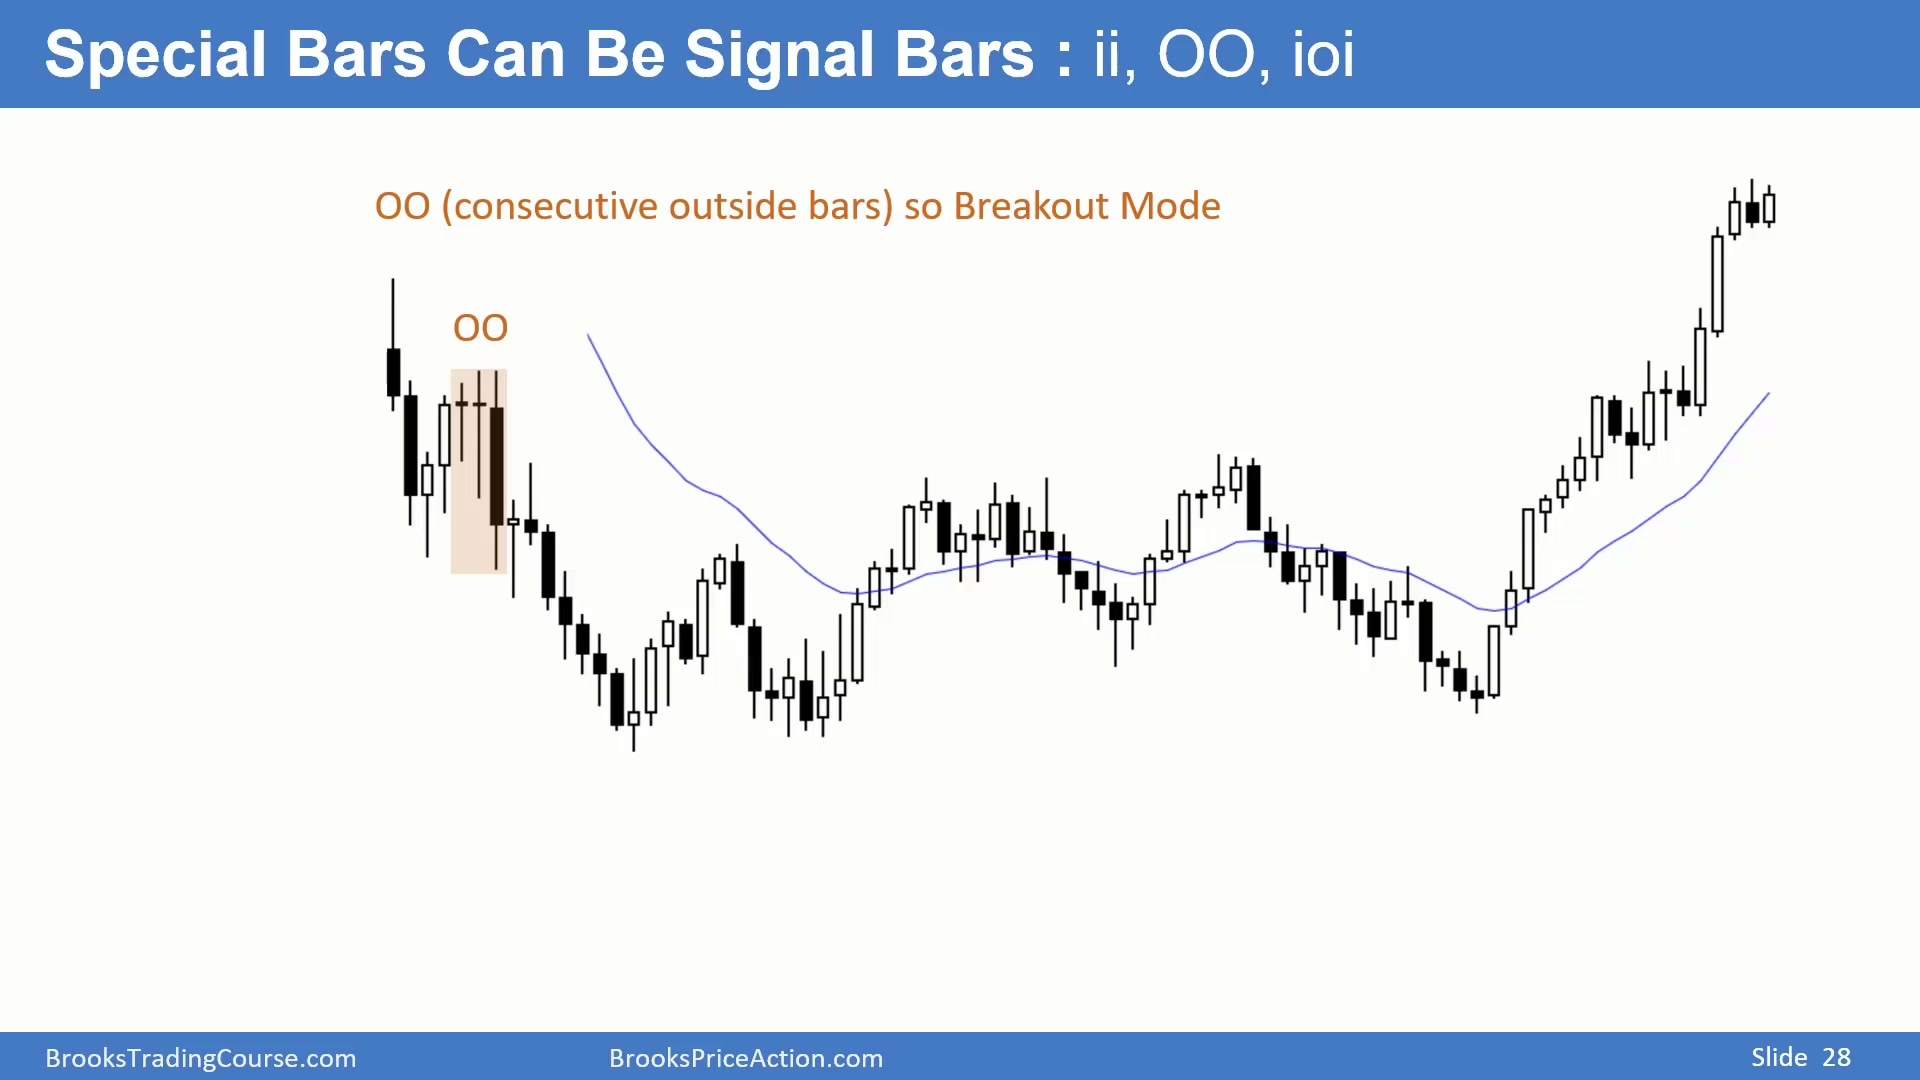
图中一根 K 线的高点等于前一根高点,低点低于前一根低点,可以视为 Outside Bar 的变体;再往前看,另一根 K 线高点高于前一根、低点低于前一根,是更标准的 Outside Bar。连续 Outside Bar,也就是 OO,是 BreakOut Mode。交易者会在上方买入、下方卖出,等待市场选择方向。
在这个案例中,若出现收在低点附近的熊 K 线,可以在其低点下方卖出。OO 结构本身表示市场正在扩张波动,突破后的方向更重要。
先画买入盒,再用失败信号管理风险
Time: 24:24
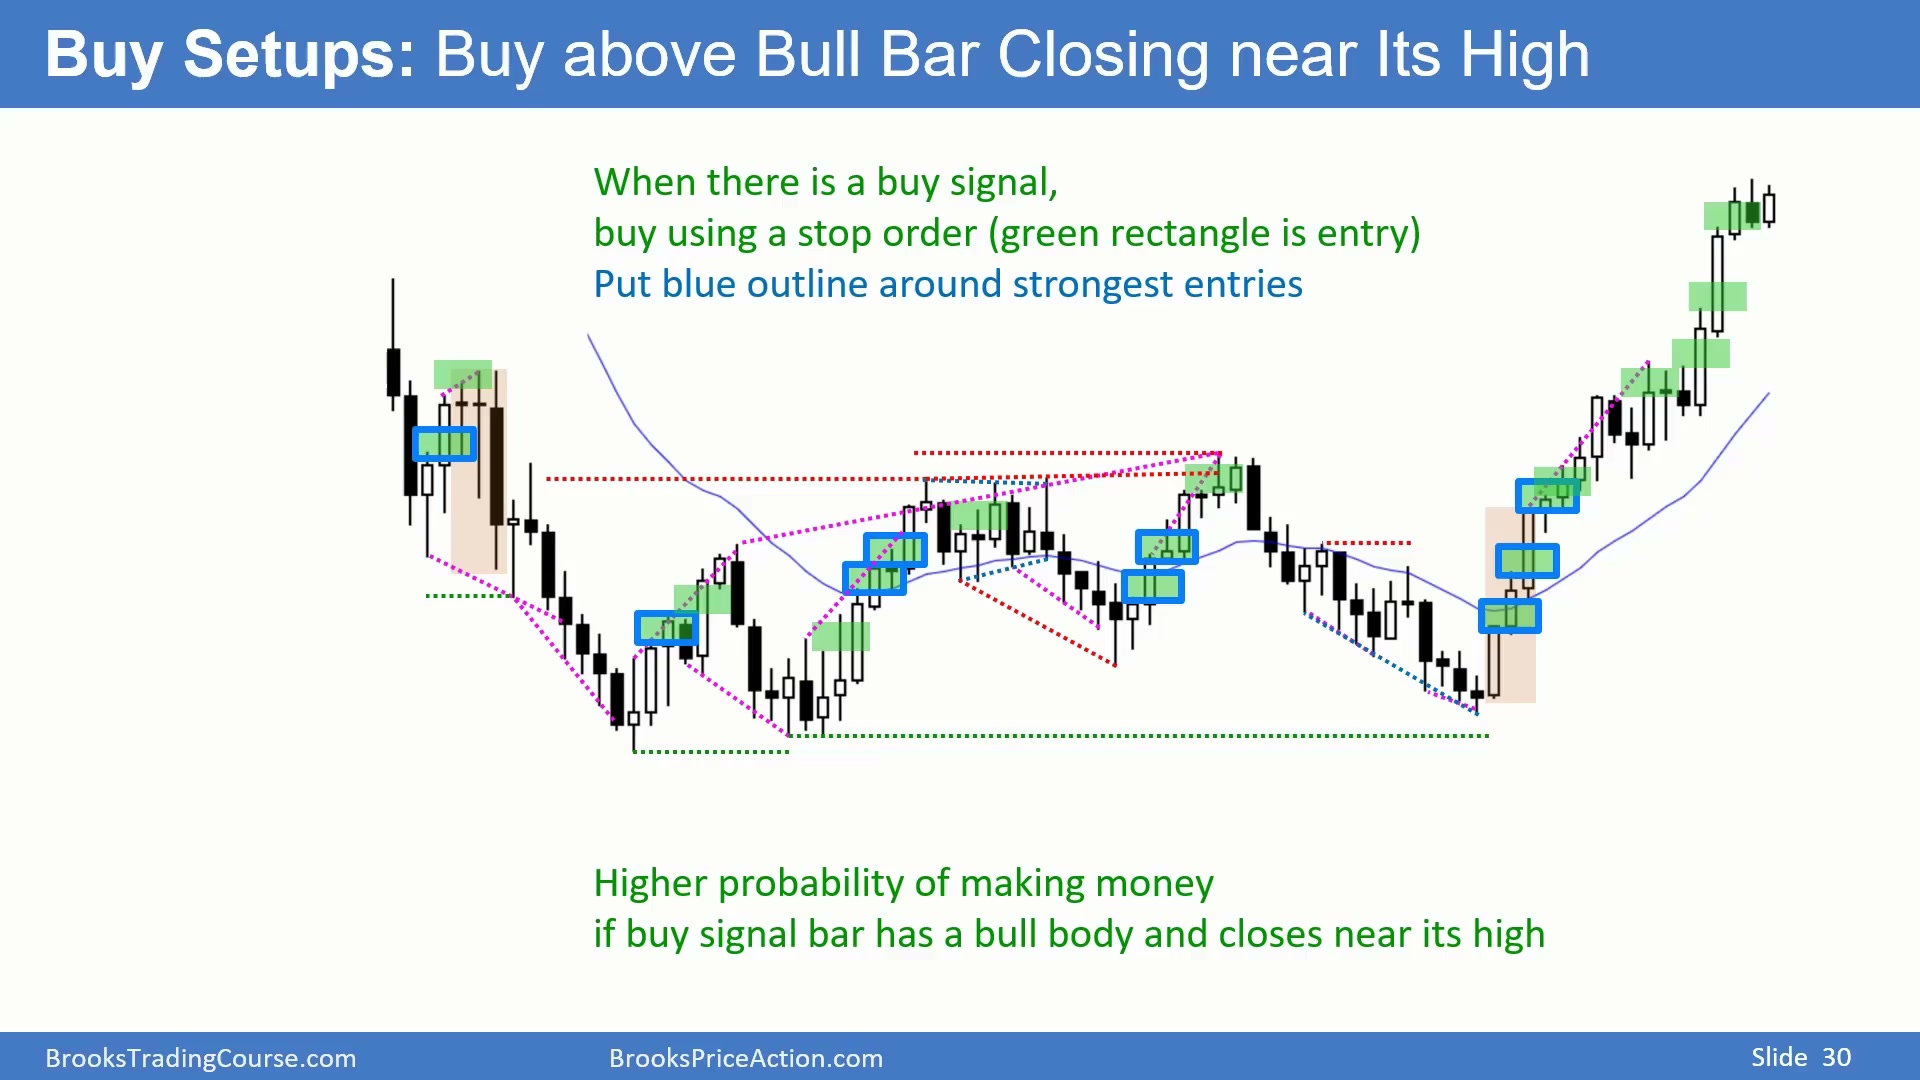
线条和特殊 K 线标出后,开始寻找进场。如果要买,理想位置通常是在牛 K 线高点上方,最好这根 K 线收在高点附近;如果要卖,则在熊 K 线低点下方,最好收在低点附近。
图中理论上有连续牛 K 线,可以买入,但后来失败。失败后应在 Outside Bar 下方出场,或者至少在后续卖出信号出现时退出,因为市场已经给出空头机会。有些绿色或红色进场盒会加外框,表示特别好的 setup,适合新手优先学习和尝试。没有人能抓住每一个 setup;盘中会吃饭、接电话、离开屏幕,也很难看住每一个 tick。5 分钟日内图很容易错过机会,而日线图则可以收盘后从容下单。
买入盒不是事后证明“这里一定要买”,而是训练交易者把可能交易的位置具体化。每个盒子都应该能回答三个问题:为什么这里有买方优势,止损放在哪里,失败后怎么处理。若后面出现更强的卖出信号,原来的买入盒就变成复盘材料,说明当时的买方前提如何失效。
红色盒子标出更高质量的卖出机会
Time: 25:55
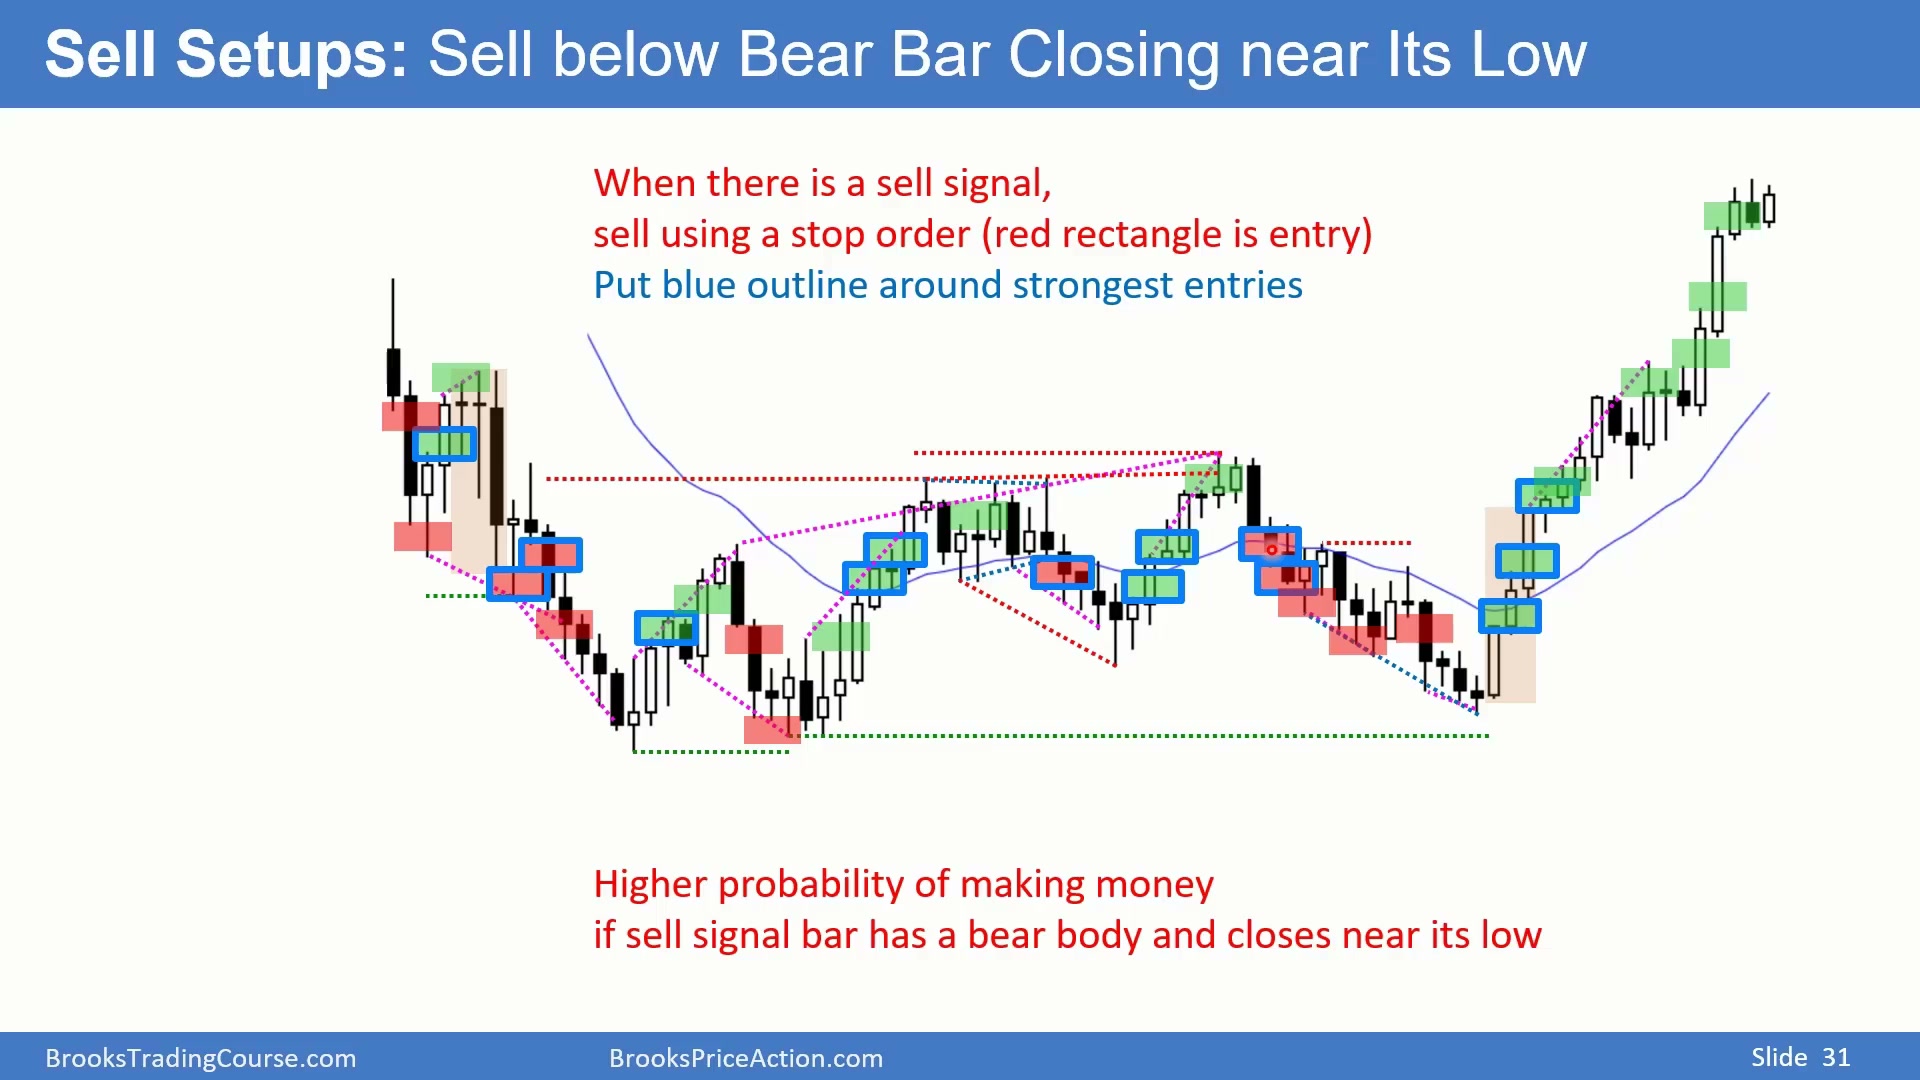
买入盒之后,再画红色卖出盒。图中某些 K 线适合在低点下方卖出;其中一个 OO pattern 位于均线下方,是特别好的卖出信号,可以直接在其下方卖,或卖第一波回调。
另一个卖出区域叠加了更多理由:Expanding Triangle、Micro Double Top、可能的 Double Top、Wedge rally 到 Double Top,而且是嵌套结构,小 Wedge 套在大 Wedge 内。随后第二根连续熊 K 线收在低点,也是更高概率卖出。这样的 setup 用蓝色外框强调,表示它比普通卖出盒更值得关注。
文字框把复盘变成可复用训练材料
Time: 26:45
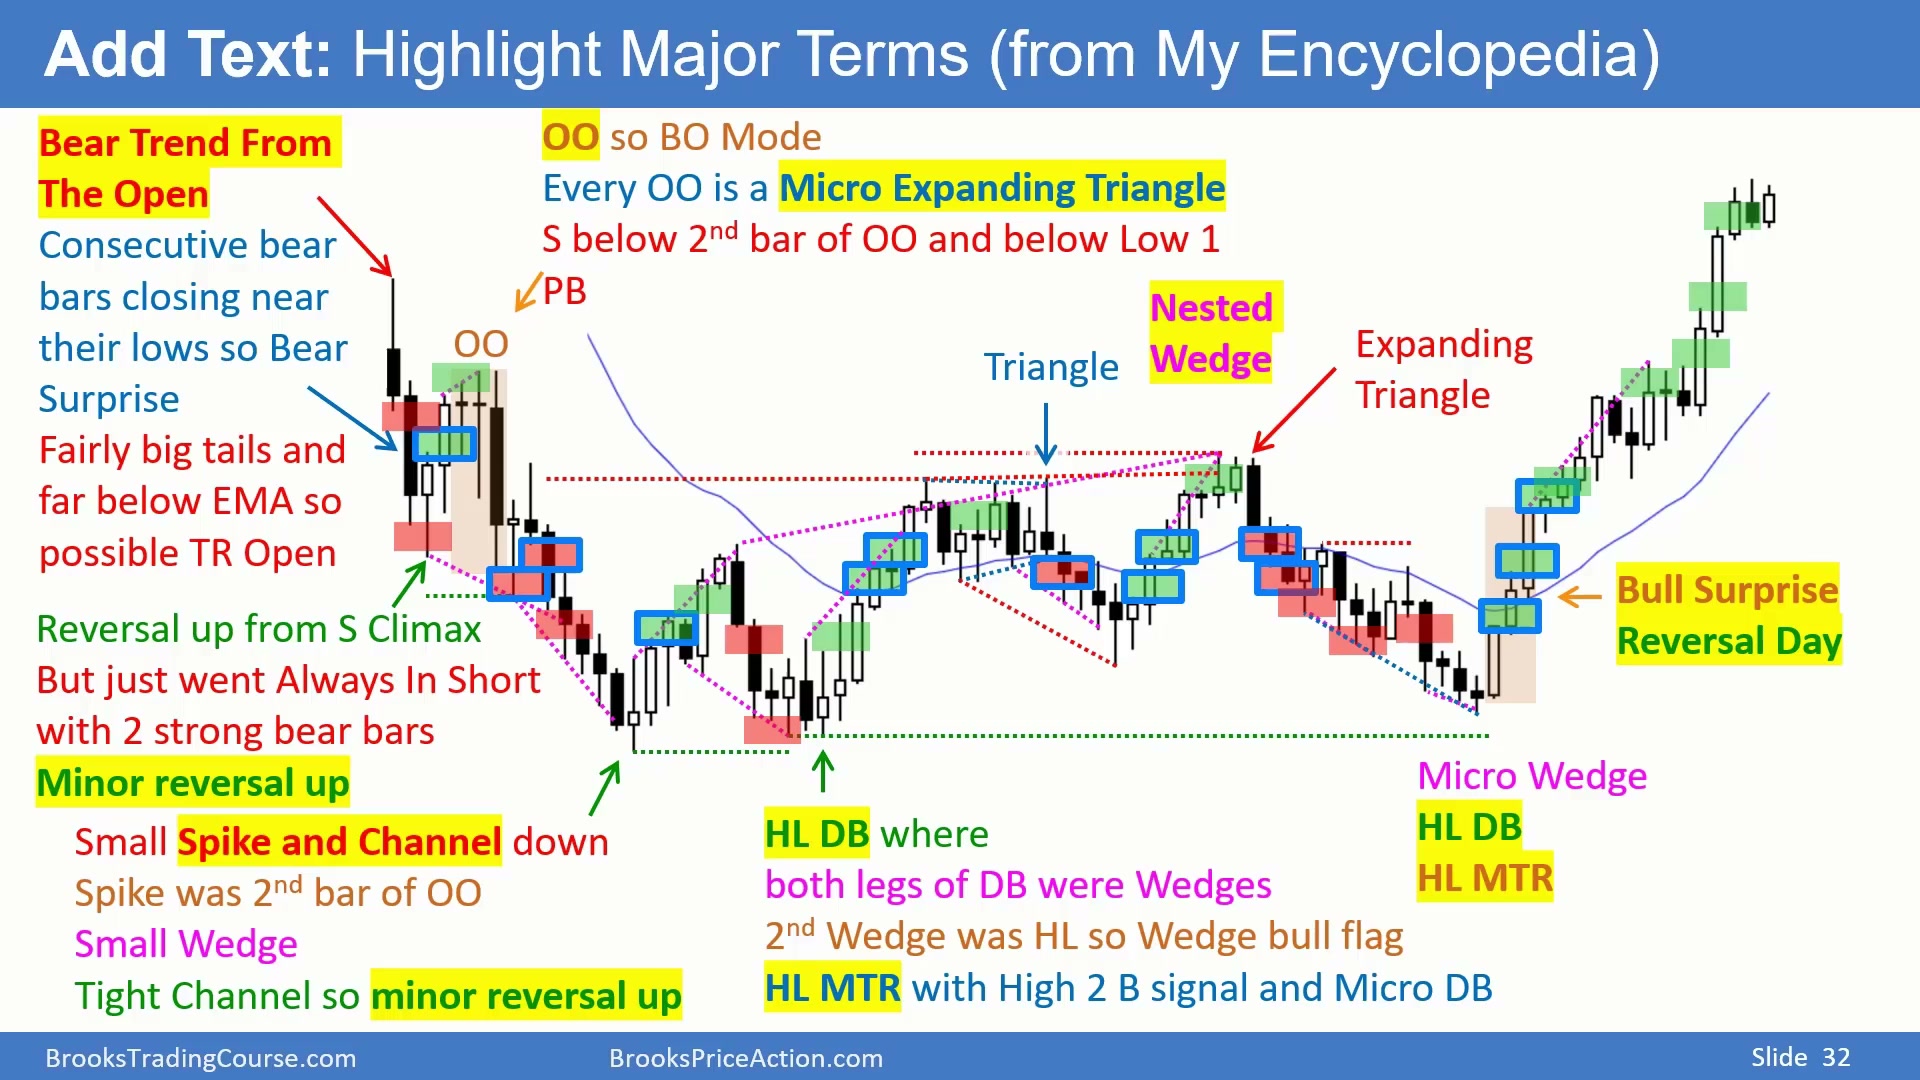
最后加入文字框,解释为什么某处可以买、为什么某处可以卖。日常练习时不一定每次都写很多文字,但至少应画线并突出特殊 K 线。坚持几个月后,盘中会更容易在模式展开过程中认出来,而不是等图形完全结束才知道发生了什么。
这就是交易练习的意义:通过收盘后重复标注,让实时行情中出现的结构变得熟悉;当交易触发时,能更快执行,也能更好管理。
五步流程的复盘顺序
Time: 27:32
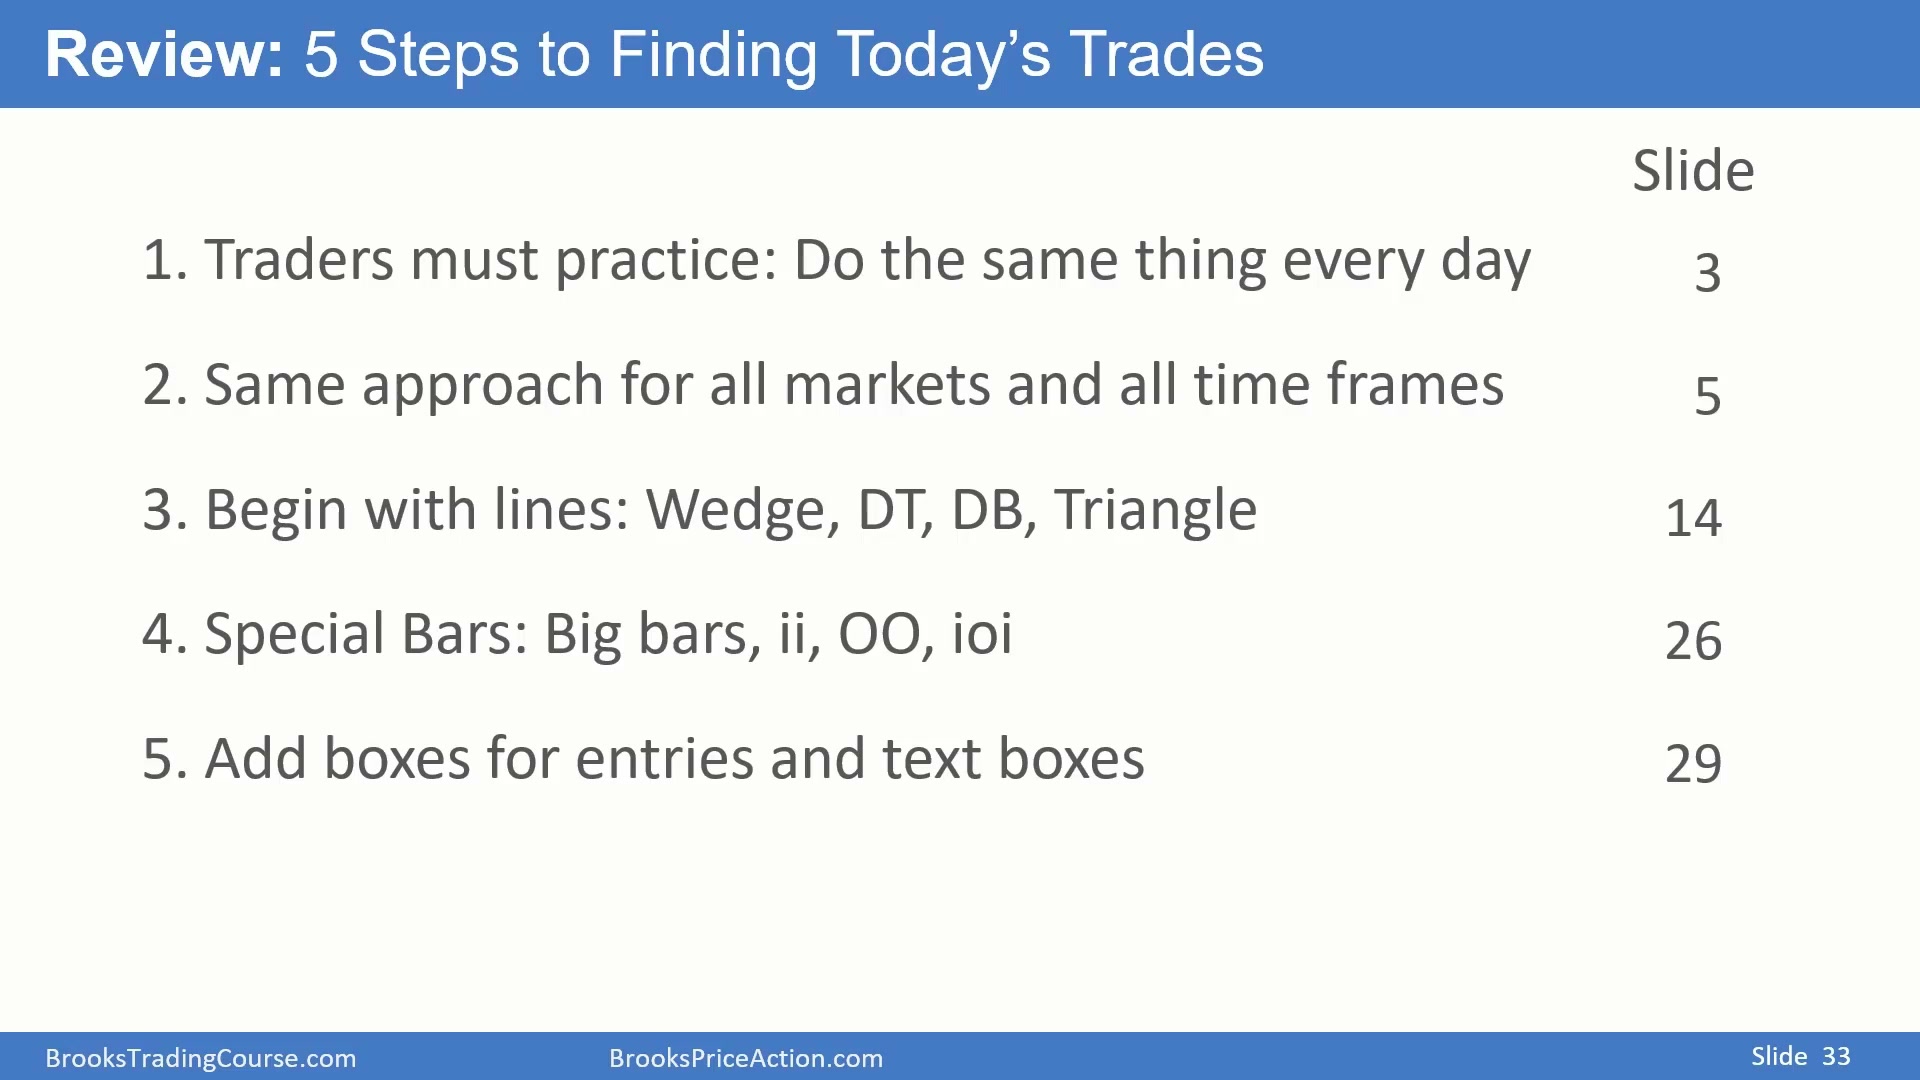
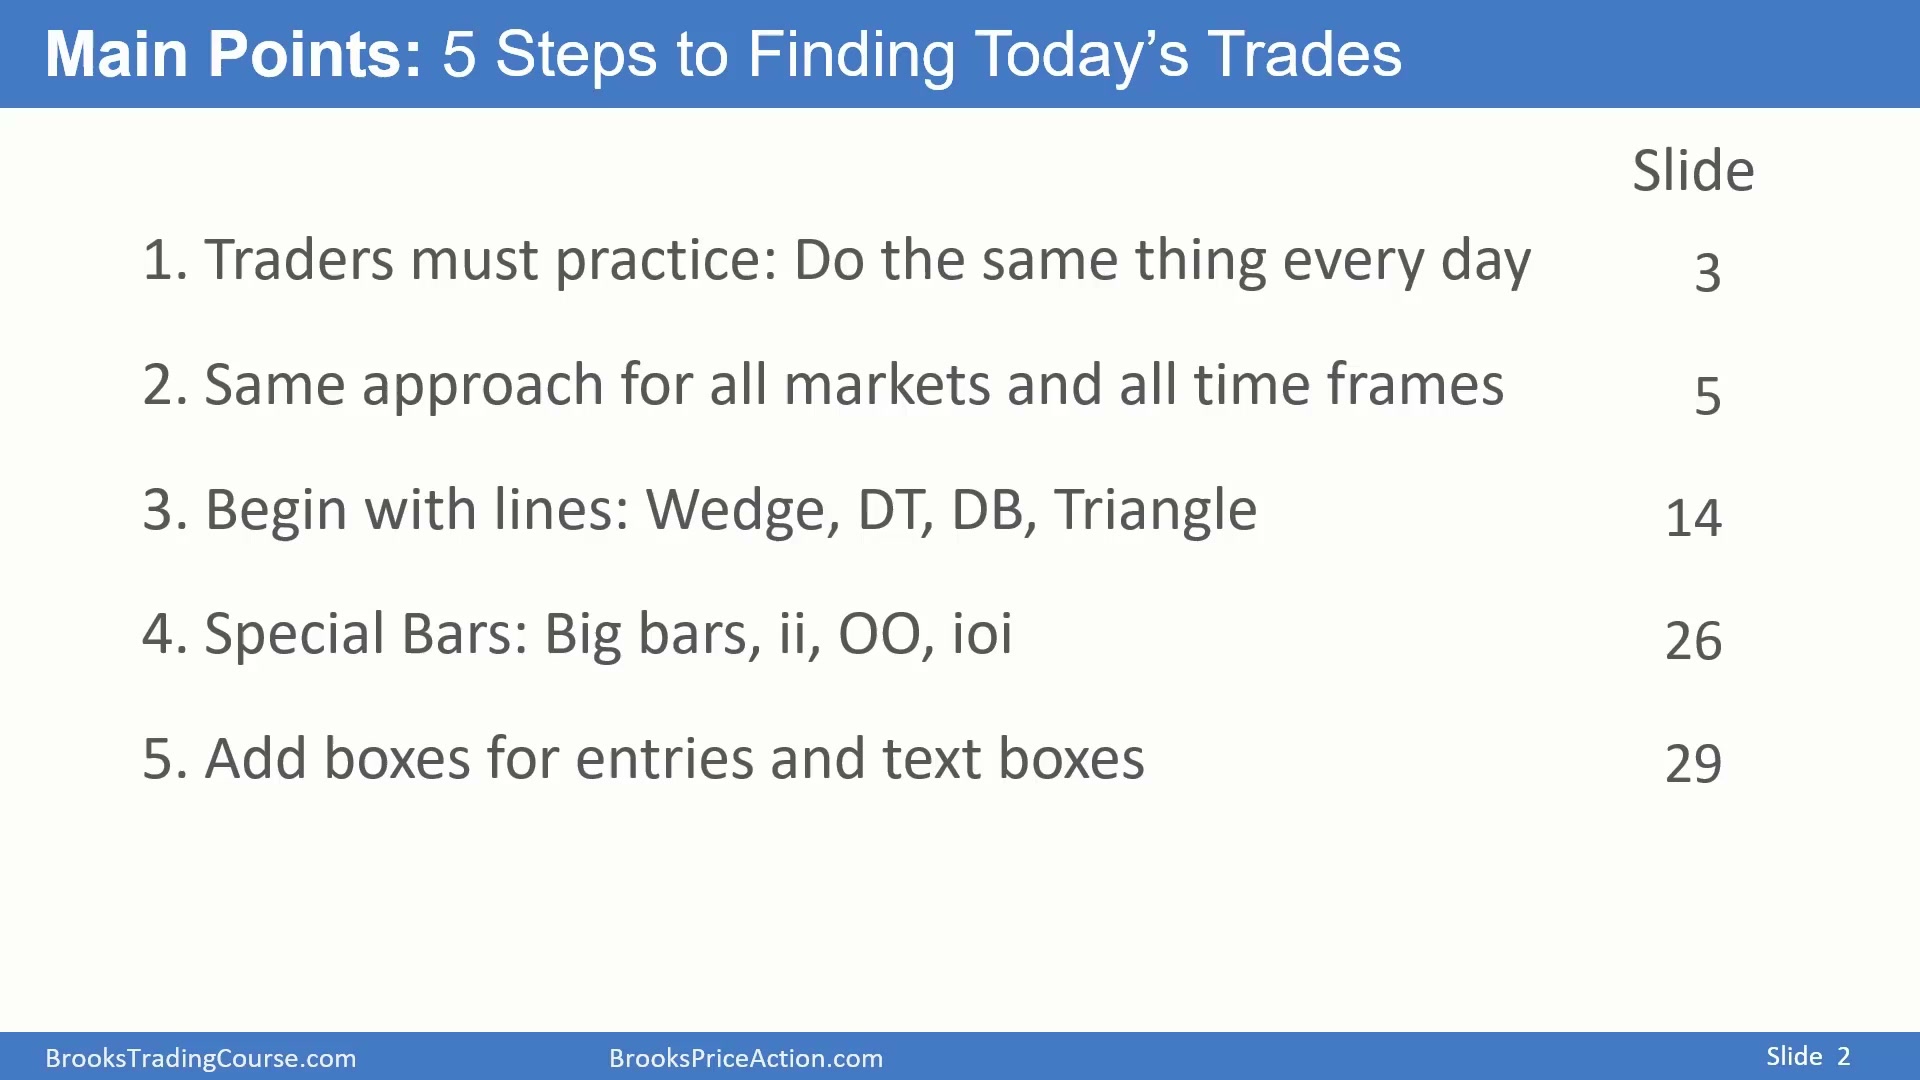
每天做同样的事,建立固定 routine。第一,每天收盘后标注图表,练习识别模式。第二,用同一套方法看所有市场和所有周期。第三,先画线,通常从 channel、Wedge、Double Top、Double Bottom 和 Triangle 开始。第四,寻找异常 K 线,例如大 K 线、一组大 K 线、Surprise Bar、小型组合、连续 Inside Bar、连续 Outside Bar,以及 Outside Bar 后接 Inside Bar 的 ioi。第五,画出买入和卖出盒,并添加说明文字,解释为什么某处是好买点或好卖点。
这套流程的价值在于把复盘标准化。标准化后,交易者不会每天随机寻找不同东西,而是持续训练同一组能力。
模式库越熟,实时组织交易越快
Time: 28:46
每天收盘后的 routine 应服务于一个目标:练习识别会反复出现的模式,并提前思考实时遇到它们时如何管理。市场会不断重复相似结构。知道的模式越多,识别速度越快,越能在交易触发前组织好进场、止损、目标和失效条件,越有机会把模式转化为可管理的盈利交易。