al-brooks-course
02 - Trading Patterns on the Open
Readable self-study lecture notes for 02 - Trading Patterns on the Open.
Source Media
开盘趋势少见,开盘反转常见
Time: 00:13
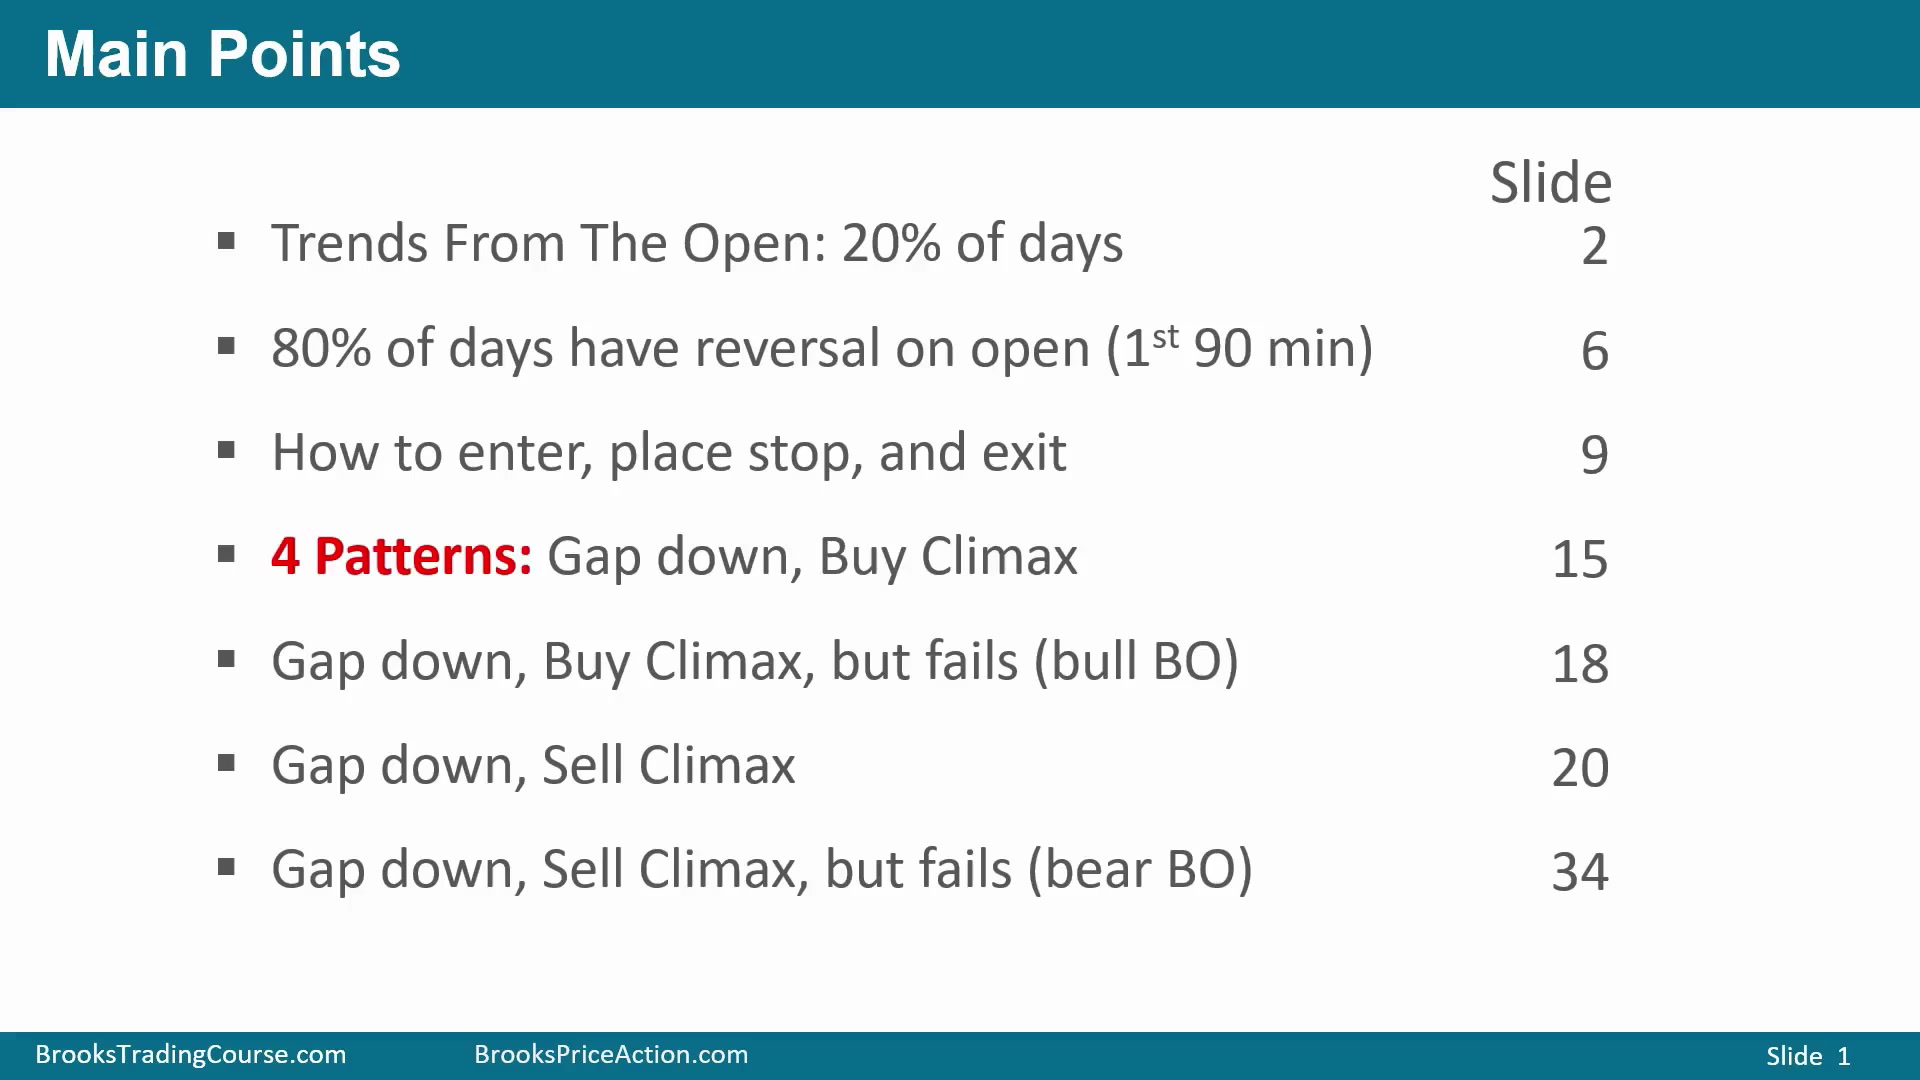
从开盘开始并持续全天的 trend from the open 大约一周只有一次,也就是约 20% 的交易日。约 80% 的交易日会在开盘后 60 到 90 分钟内出现某种反转。开盘交易先解决三件事:如何进场、保护性止损放在哪里、如何离场。
形态上要同时准备成功和失败版本。这里重点是 gap down open 的四种变化:低开后 Buy Climax 反转向下;低开后 Buy Climax 到均线等阻力但反转失败,形成 bull flag 并恢复上涨;低开后 Sell Climax 反转向上;低开后 Sell Climax 反转尝试失败,变成 bear flag 并恢复空头趋势。
每个形态都要同时准备买卖两个方向,以及成功和失败两个版本。开盘交易不能只记图形名称;真正执行取决于信号 K 线、保护性止损、退出信号和形态失败后的反向机会。
低开后的多头开盘趋势
Time: 01:48
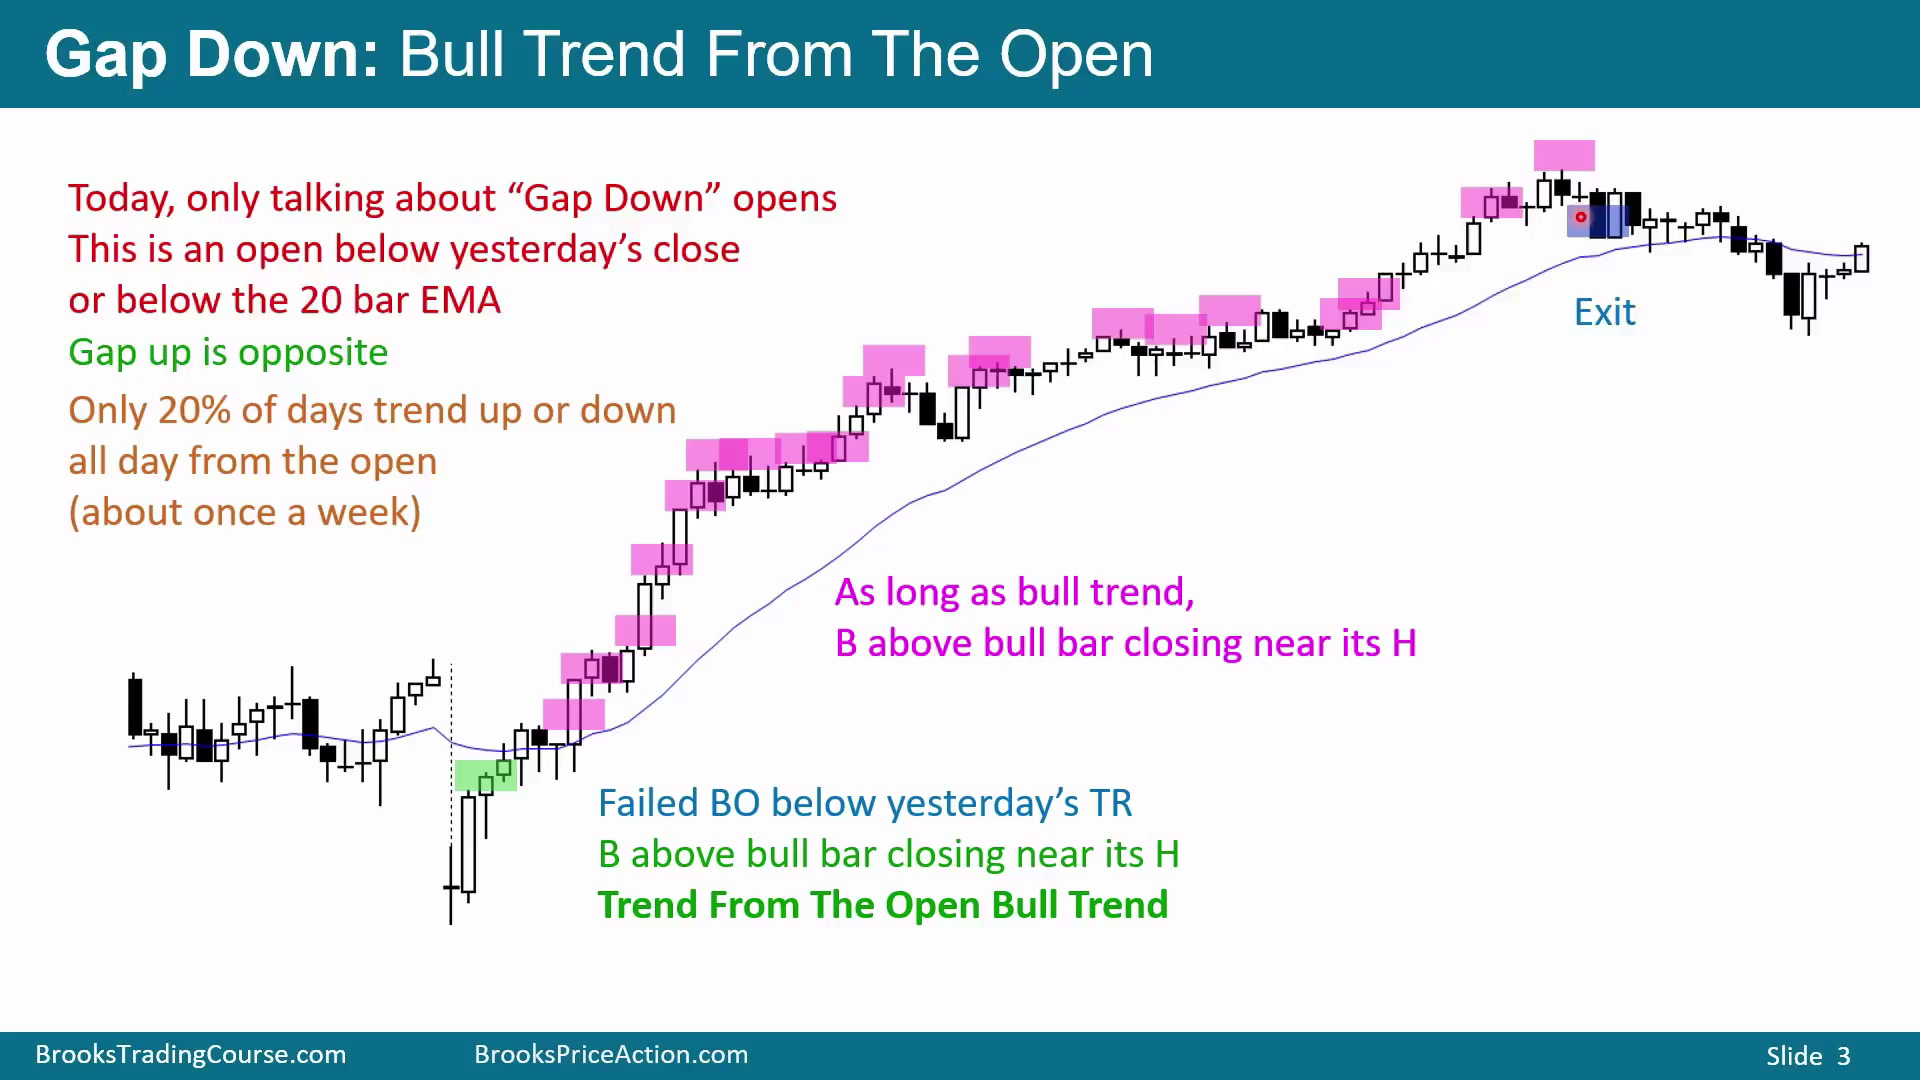
gap down 指今天开盘价低于昨天收盘价,或低于均线。图中低开后直接形成多头 trend from the open,这种低开后一路向上或一路向下的开盘趋势约占 20%。
若开盘后出现几根 K 线,其中至少一根是收在高点的大阳线,交易者会在其高点上方 1 tick 用 stop 买入。只要市场持续形成收近高点的阳线,全天都有再买机会。可以第一信号就买;获利退出后可再进;错过最早入场,也可以在后续强阳线上方买。直到出现趋势可能结束的理由,例如尾盘 Parabolic Wedge Top、Micro Double Top、Buy Climax 后阴线,才考虑退出。
图中趋势结束不是凭感觉判断,而是由尾盘高潮和阴线给出。没有这些信号前,强趋势中继续买高点上方仍是合理策略。
低开后的空头开盘趋势
Time: 03:20
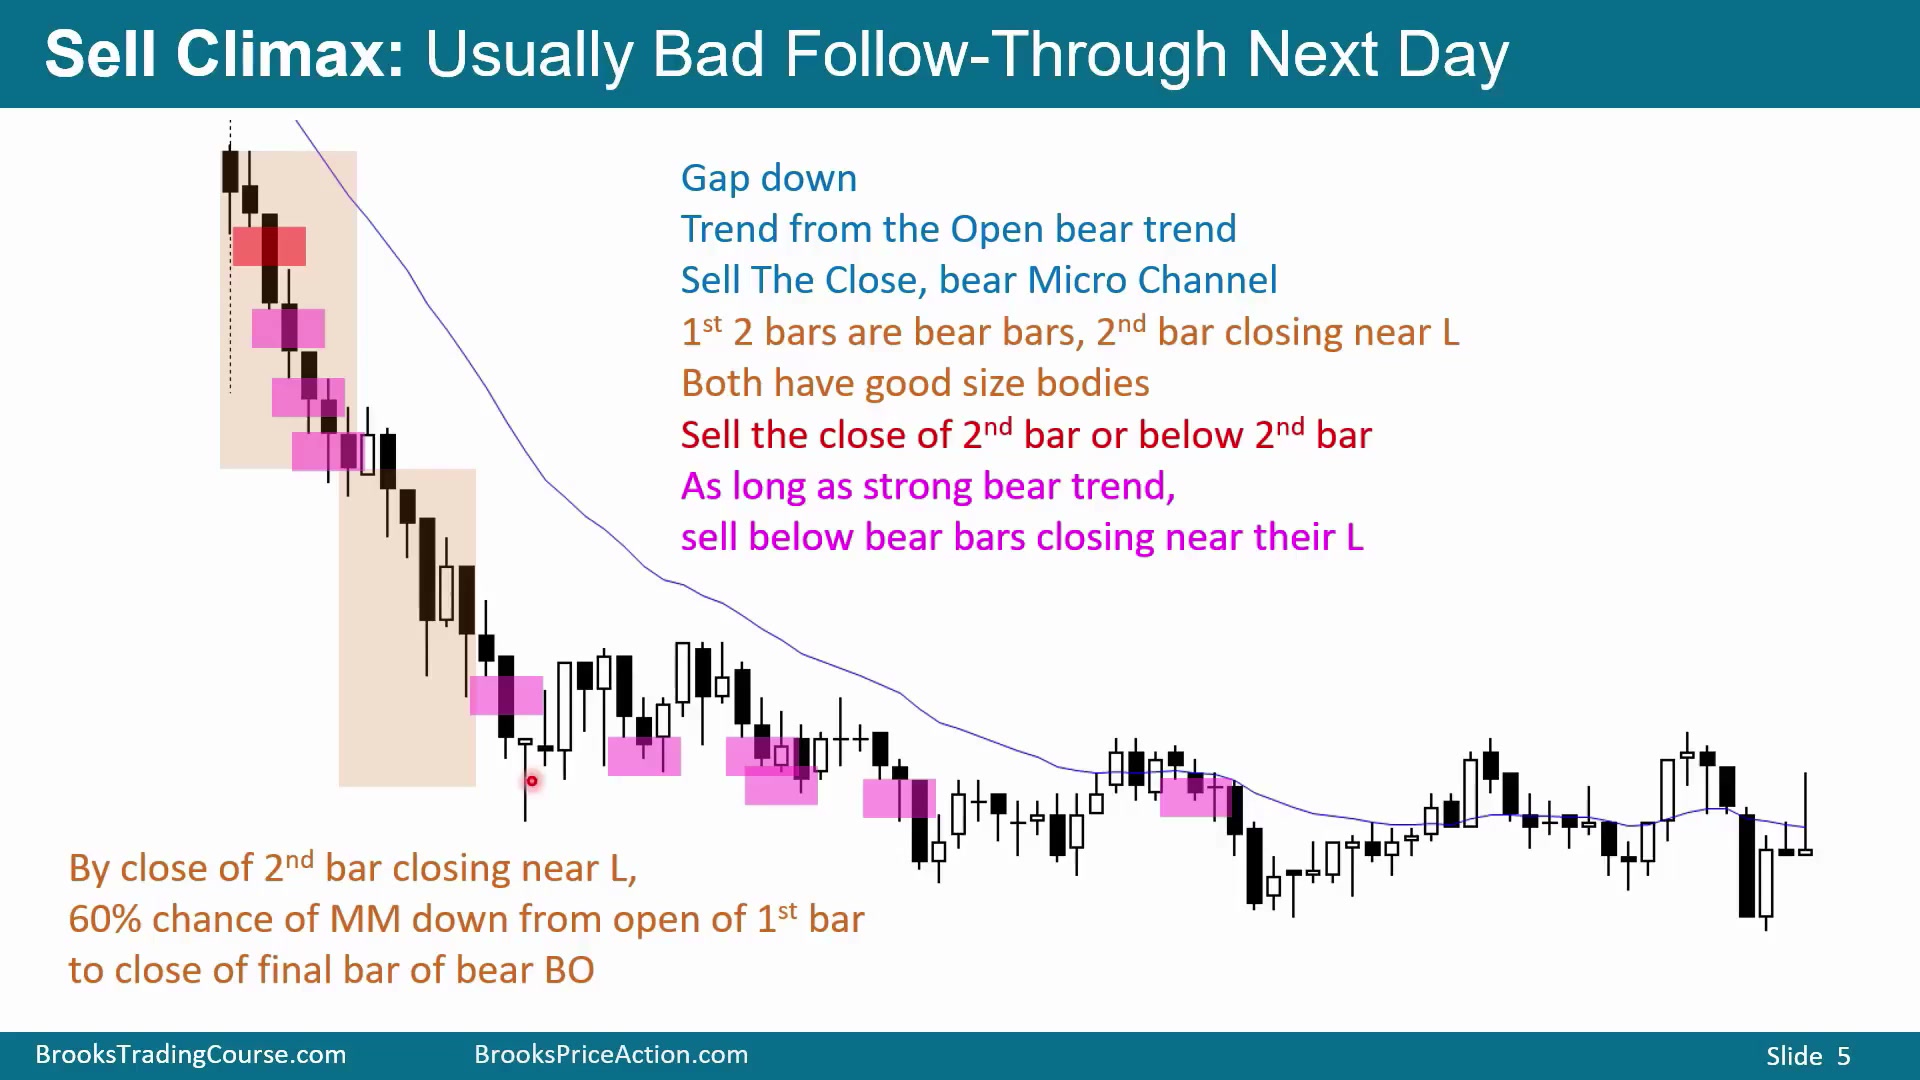
向下的 trend from the open 同样少见。图中开盘连续阴线,前两根中至少一根实体不错并收近低点,交易者会开始卖收盘价,或在前一根低点下方用 stop 卖。只要强空头趋势还在,收在中点以下、尤其收近低点的阴线,都可以成为继续做空的信号。
强开盘空头序列通常会产生 measured move。常用测量是从连续阴线第一根的开盘价,到该序列最后一根的收盘或低点,再向下投射。图中价格到达该目标附近后出现获利了结,因此 measured move 可以作为合理利润目标。
暂停 K 线或第一根阳线常成为测量序列的结束点。目标附近看到获利了结,不代表趋势必然结束,但足以提醒空头不要在目标处盲目追卖。
强开盘仍有一半概率反转
Time: 05:02
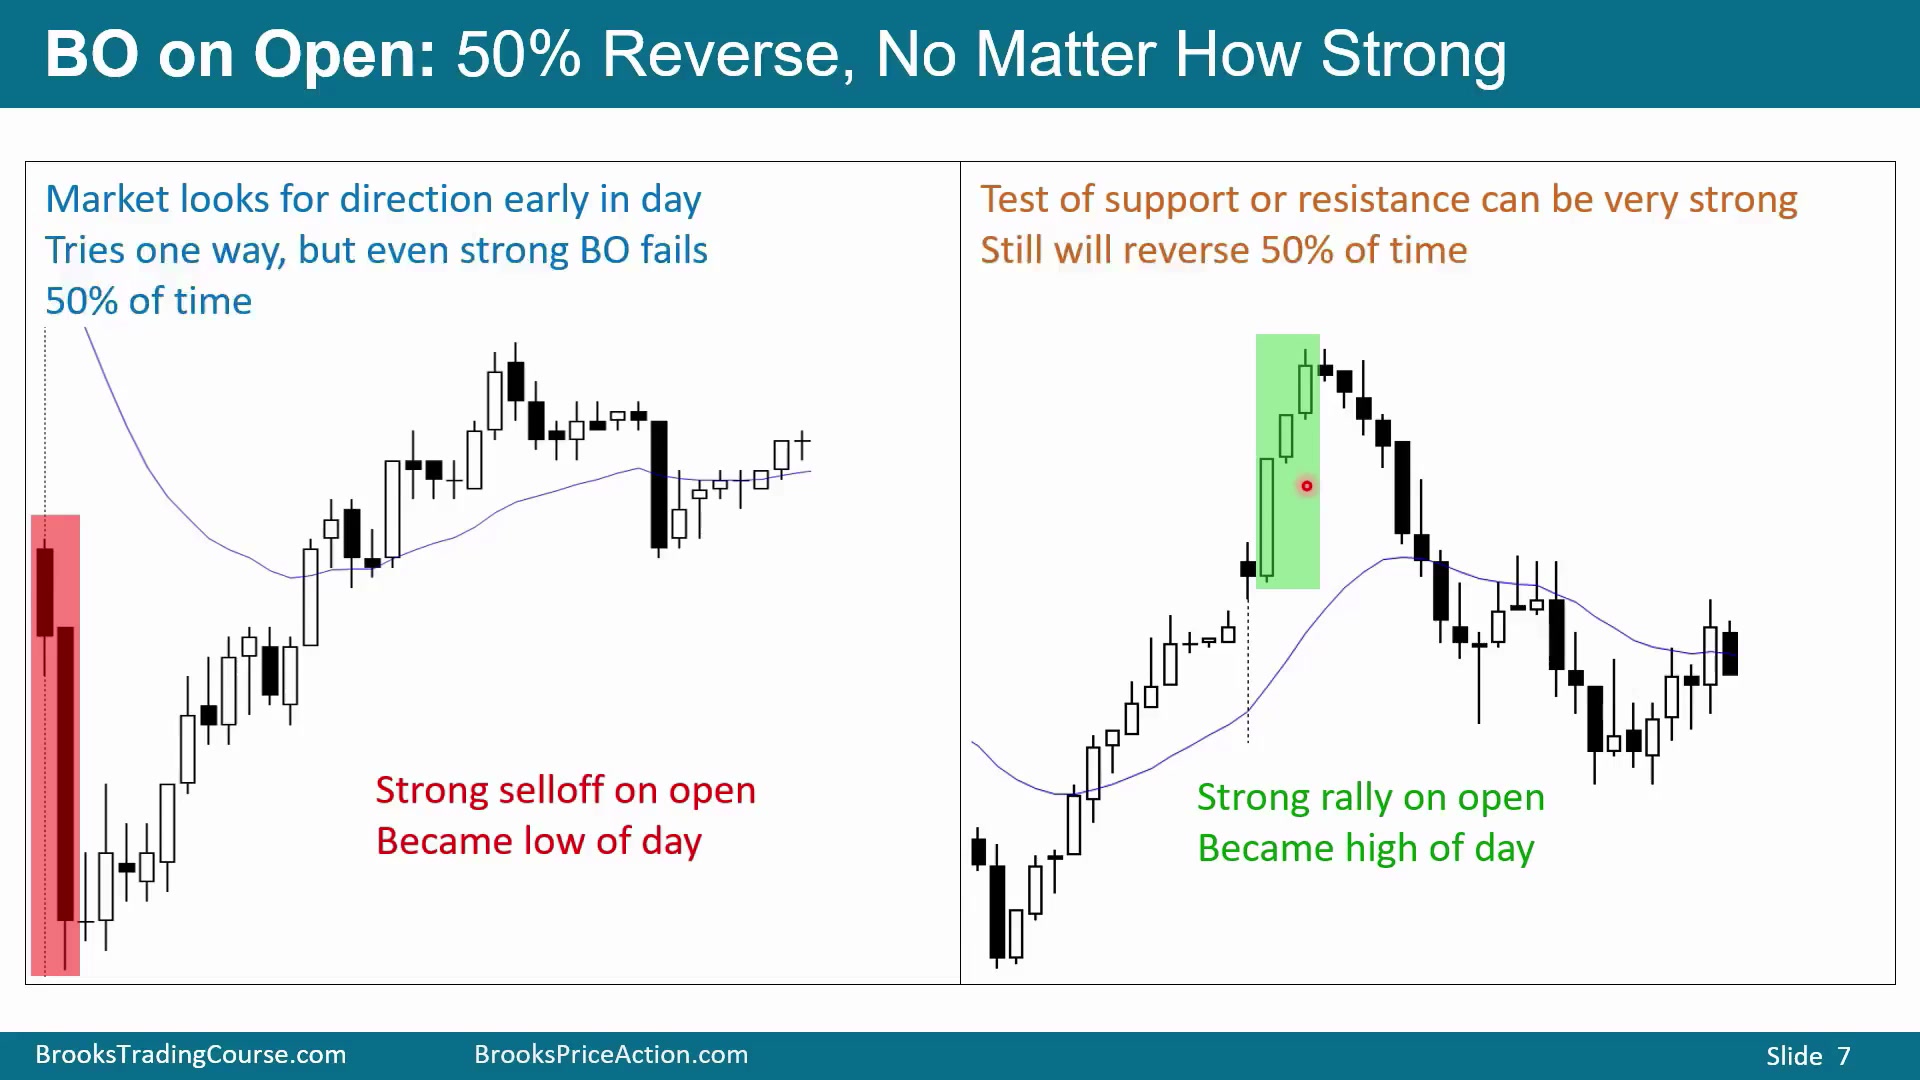
任何强开盘都不能保证趋势延续。即使开盘很强,也约有 50% 概率反转,且反转通常发生在支撑或阻力附近。图中两根大阴线收在低点附近,却向上反转,成为 Sell Climax 和当天低点;另一个案例中,跳空高开到昨天收盘和均线上方,前三根阳线不错,但仍然反转向下。
因此看到强开盘时,不要立刻确信趋势已经开始。要同时准备趋势延续和 opening reversal,并等待后续信号证明哪一种正在发生。
开盘反转来自双顶、双底和楔形
Time: 06:10
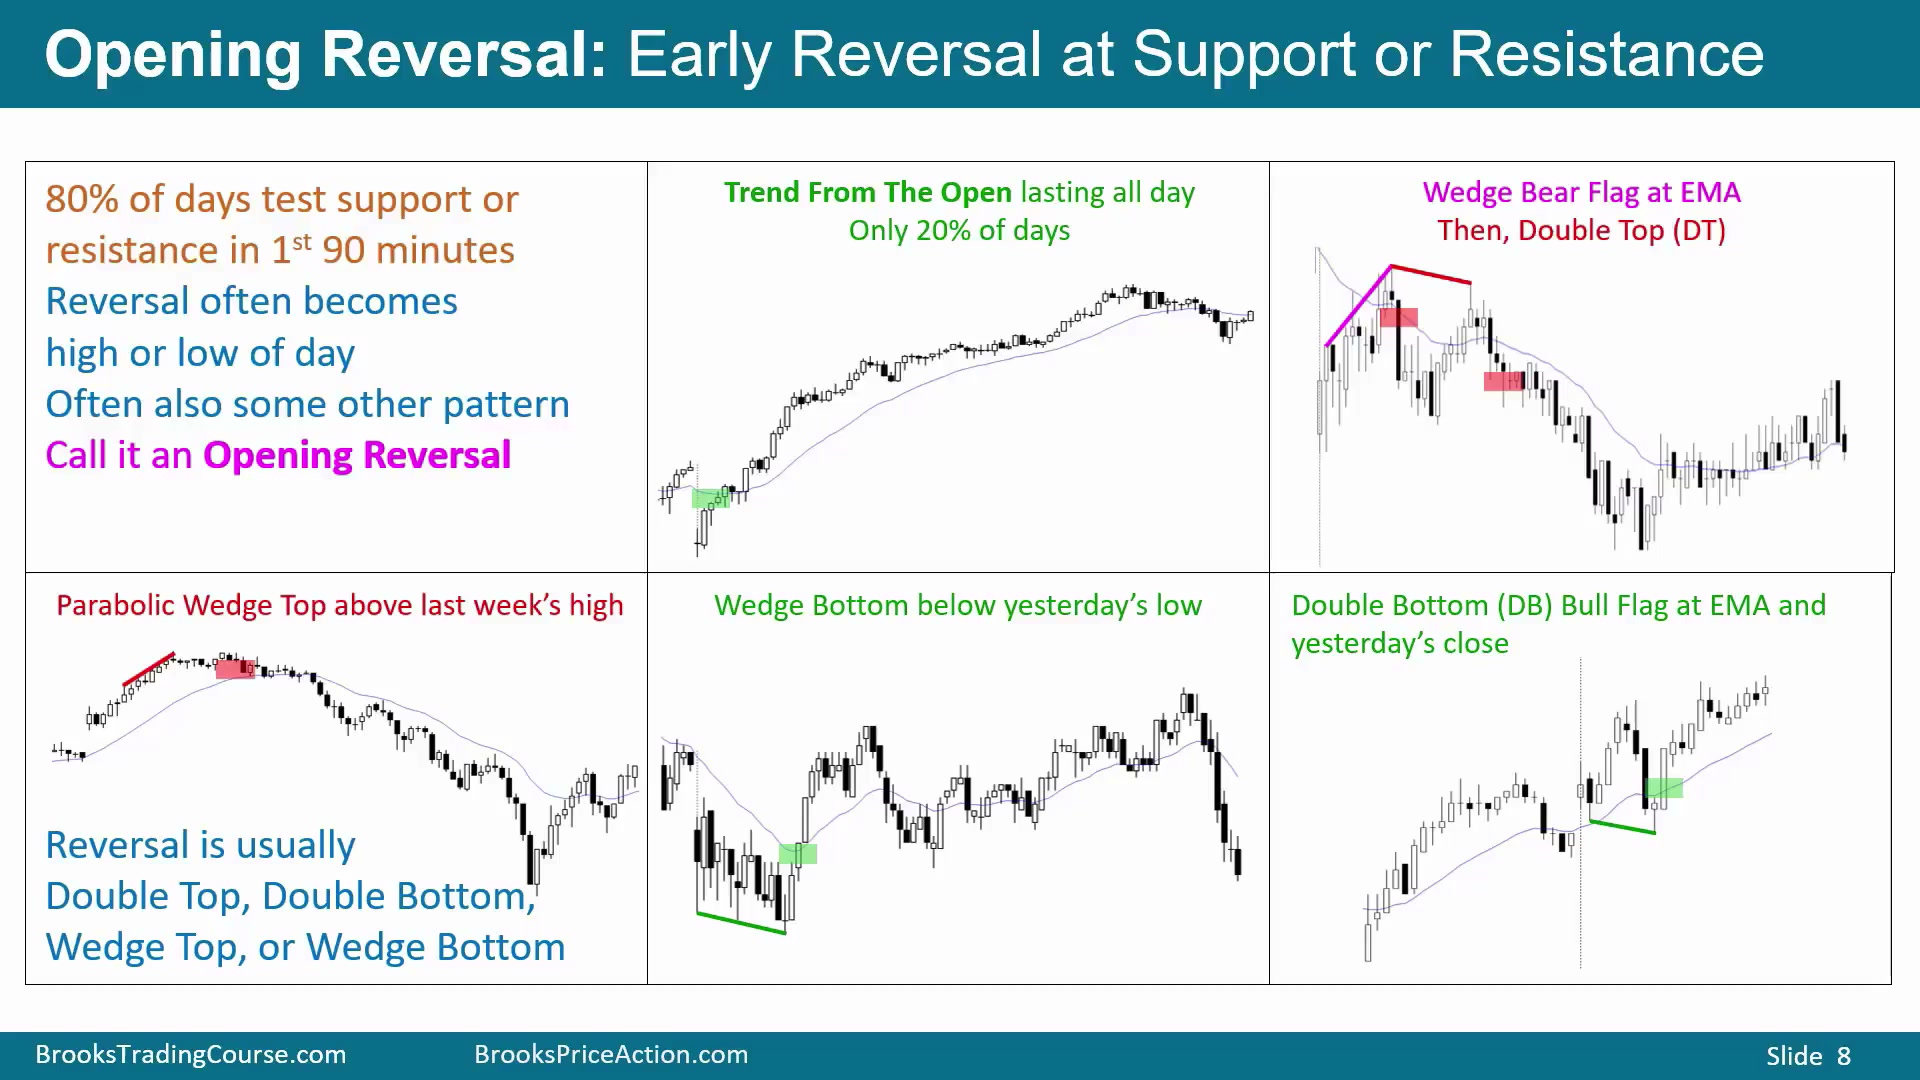
约 80% 的交易日会在前 90 分钟测试支撑或阻力并反转,这种 opening reversal 经常成为当天高点或低点。向下反转通常来自 Wedge Top 或 Double Top;开盘下跌后的向上反转通常来自 Wedge Bottom 或 Double Bottom。有时第一反转失败,会出现反方向反转。
图中有 Parabolic Wedge rally 后 Double Top 反转向下,也有 Wedge Bottom 后向上反转。多头在收近高点的阳线上方买;空头在低开反弹到 20 EMA、形成 Wedge Top 和好阴线后卖。若多头从 higher low 试图恢复上涨却形成 Double Top,空头等待收近低点的阴线或连续阴线再卖。
开盘反转的支撑阻力可以来自均线、昨天高低点、前一天收盘、前一段高潮高低点,也可以来自当天最初几根 K 线形成的区间。第一次反转失败时,后面可能出现相反方向的 opening reversal,所以不要把第一个图形当成唯一结论。图中既有向下反转,也有试图向上反转失败后再次向下的案例;交易者要等信号 K 线质量和后续 K 线确认。
用强信号K线做 stop entry
Time: 08:26
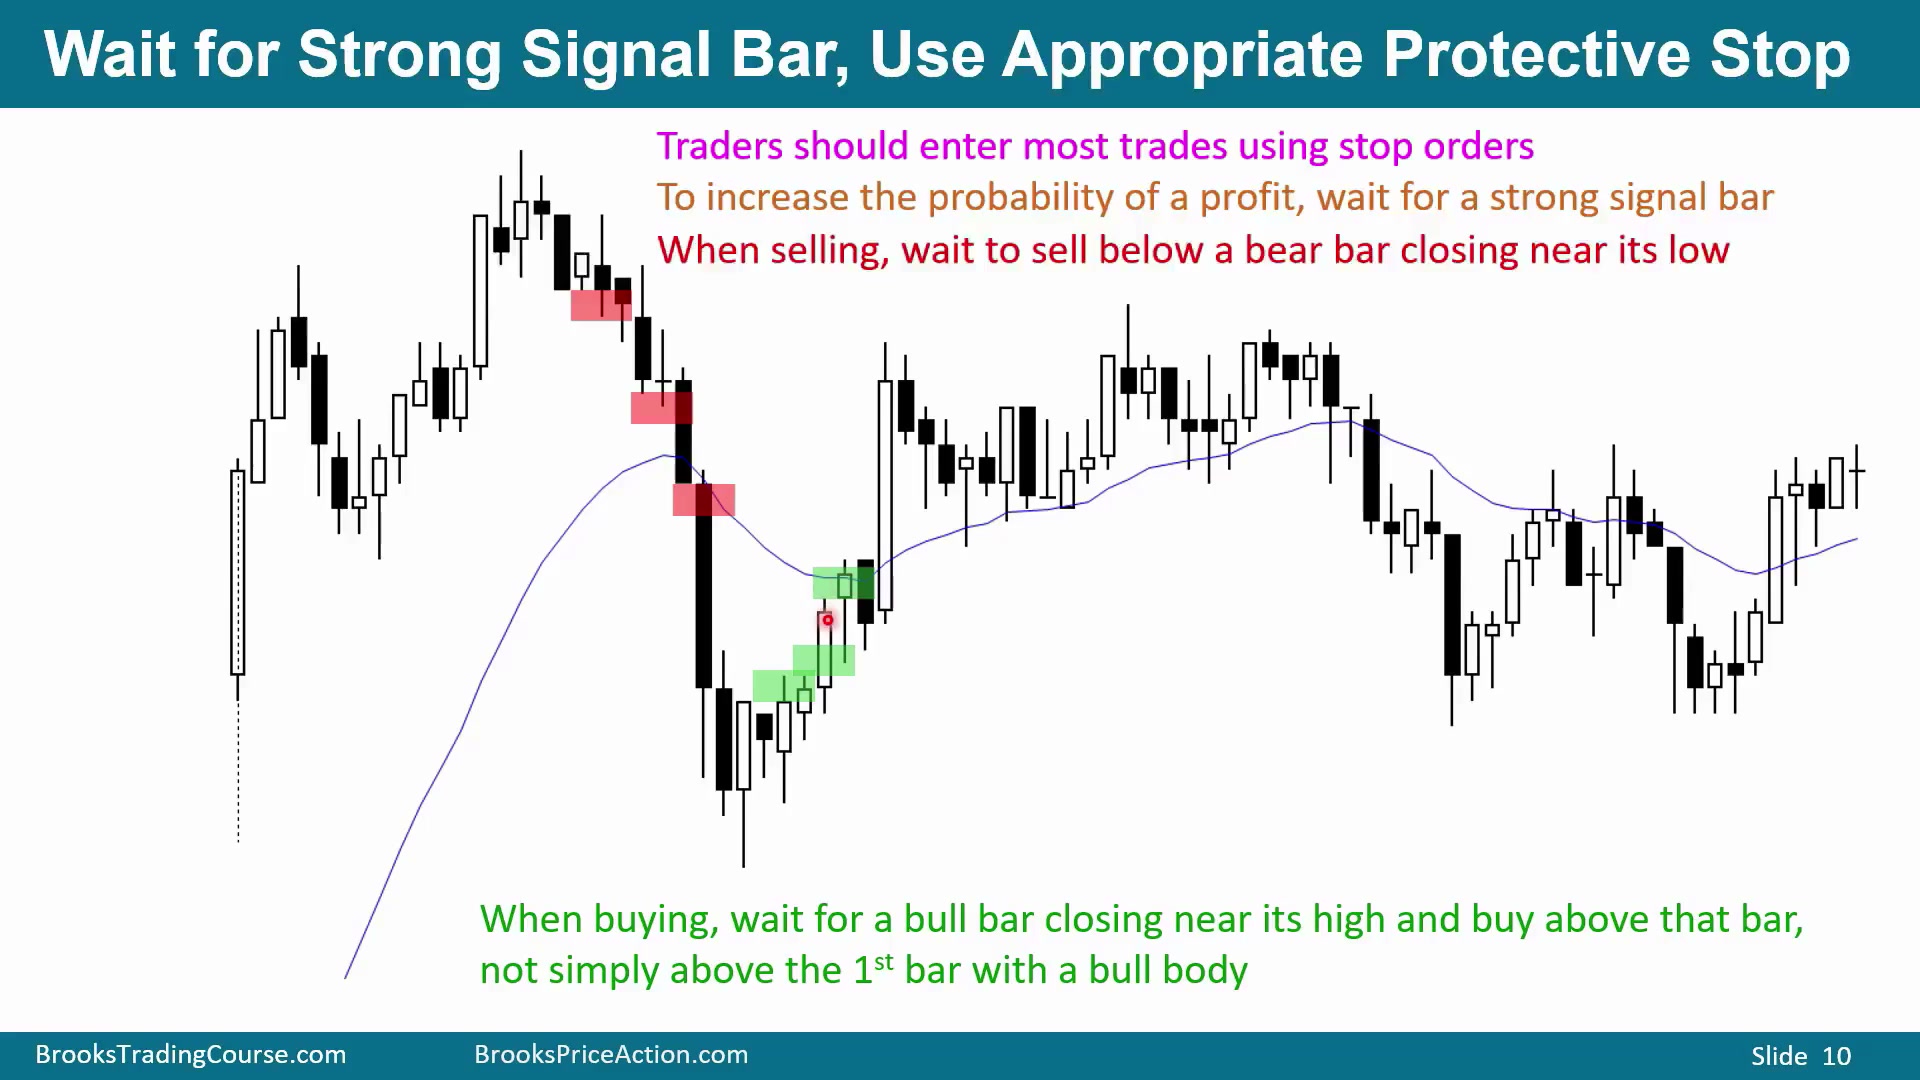
多数交易应使用 stop entry。为了提高盈利概率,要等强信号 K 线。图中某根阴线下影线很长,更像 doji,在它下方卖概率不够好;后面收在低点的阴线更适合用 stop 卖。早期空头趋势和紧空头通道中的收低阴线,也适合在低点下方卖。
做多时相反。反转向上后,最好在收近高点的阳线上方买。有时买入信号两根 K 线后才触发,有时是收高的 bull inside bar,有时连续阳线后在强阳线上方买。强趋势中也可以直接买收盘,或买前一根高点上方。
无论买卖,重点都是让 stop entry 跟随强信号,而不是在长尾 doji 或区间中部的弱信号上追价。
做多止损放在反转底部
Time: 09:45
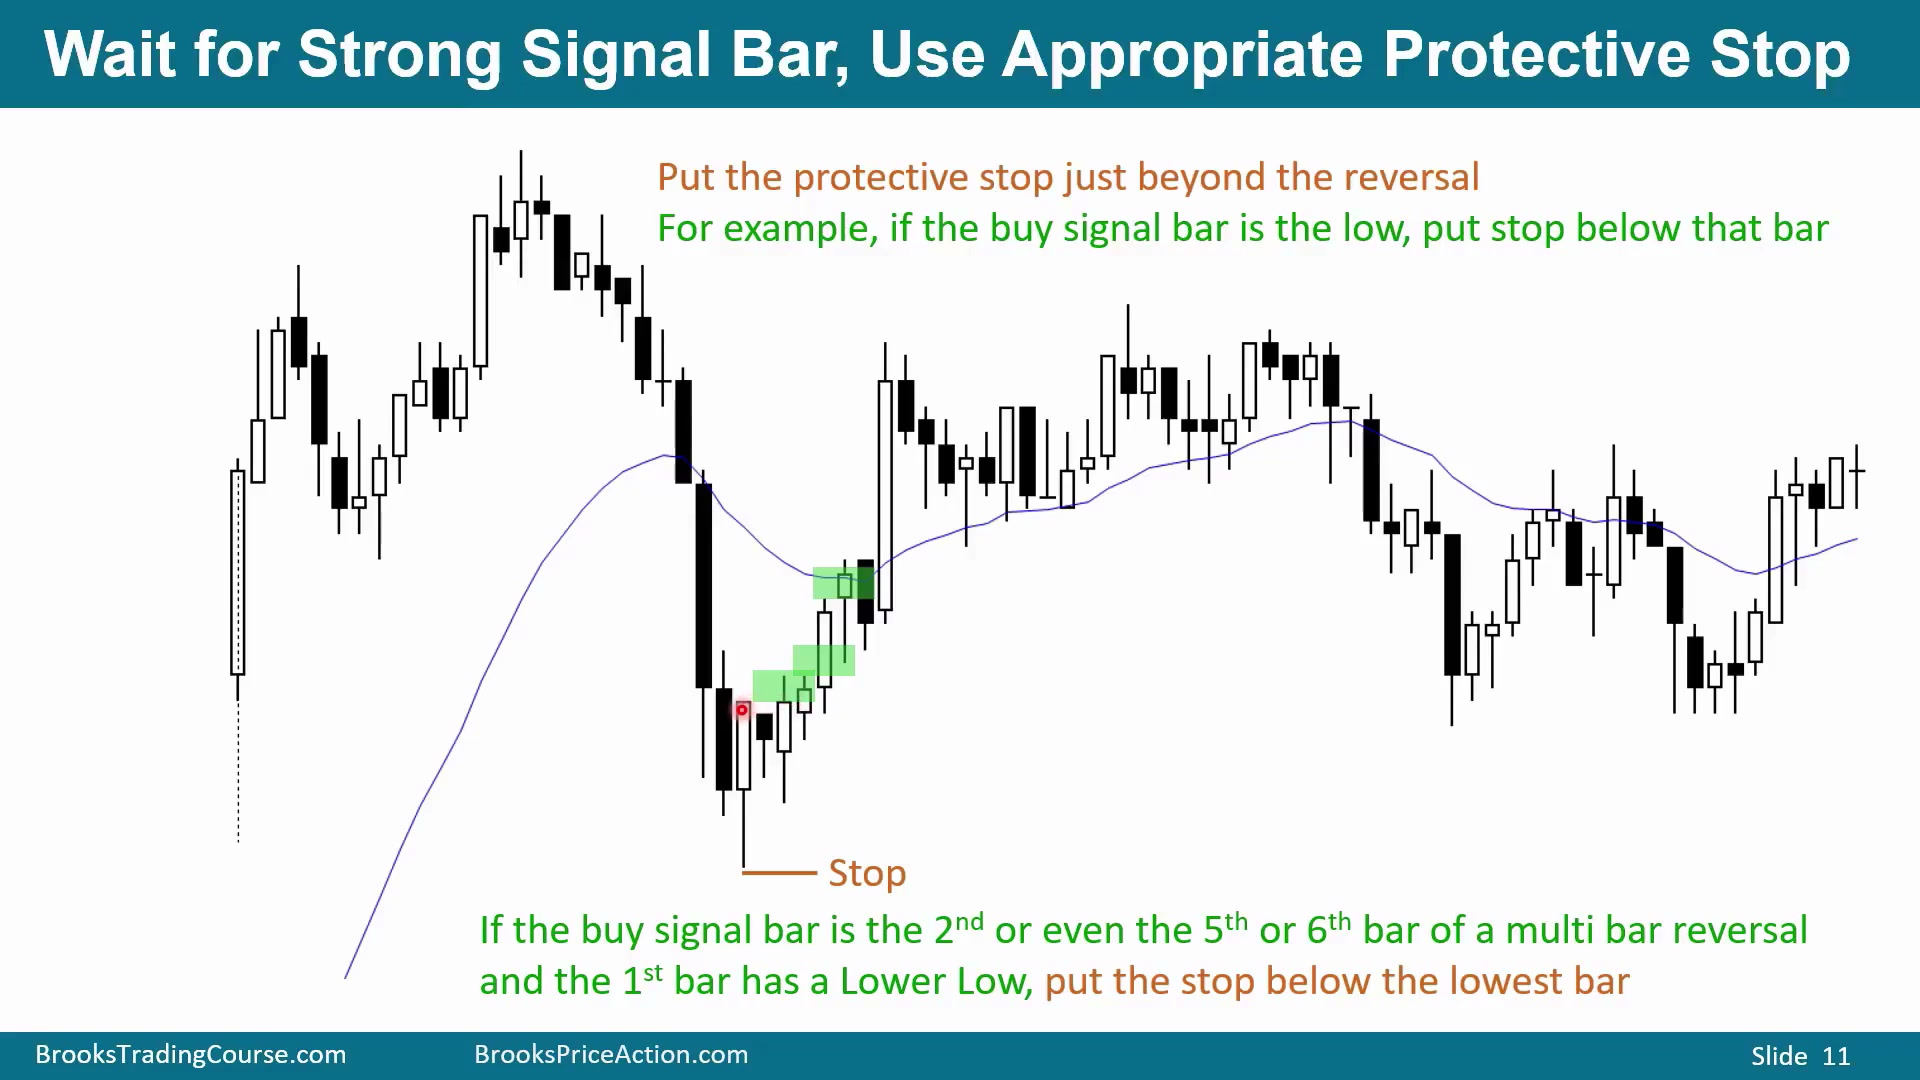
买入开盘反转时,保护性止损放在整个反转底部下方,而不是只放在入场 K 线下方。无论买的是第一、第二、第三还是第四个入场,只要属于同一段向上反转,止损都参考多头趋势底部。晚几根 K 线进场,不会改变整段反转失败的位置。
做空止损、swing优先和频率
Time: 10:20
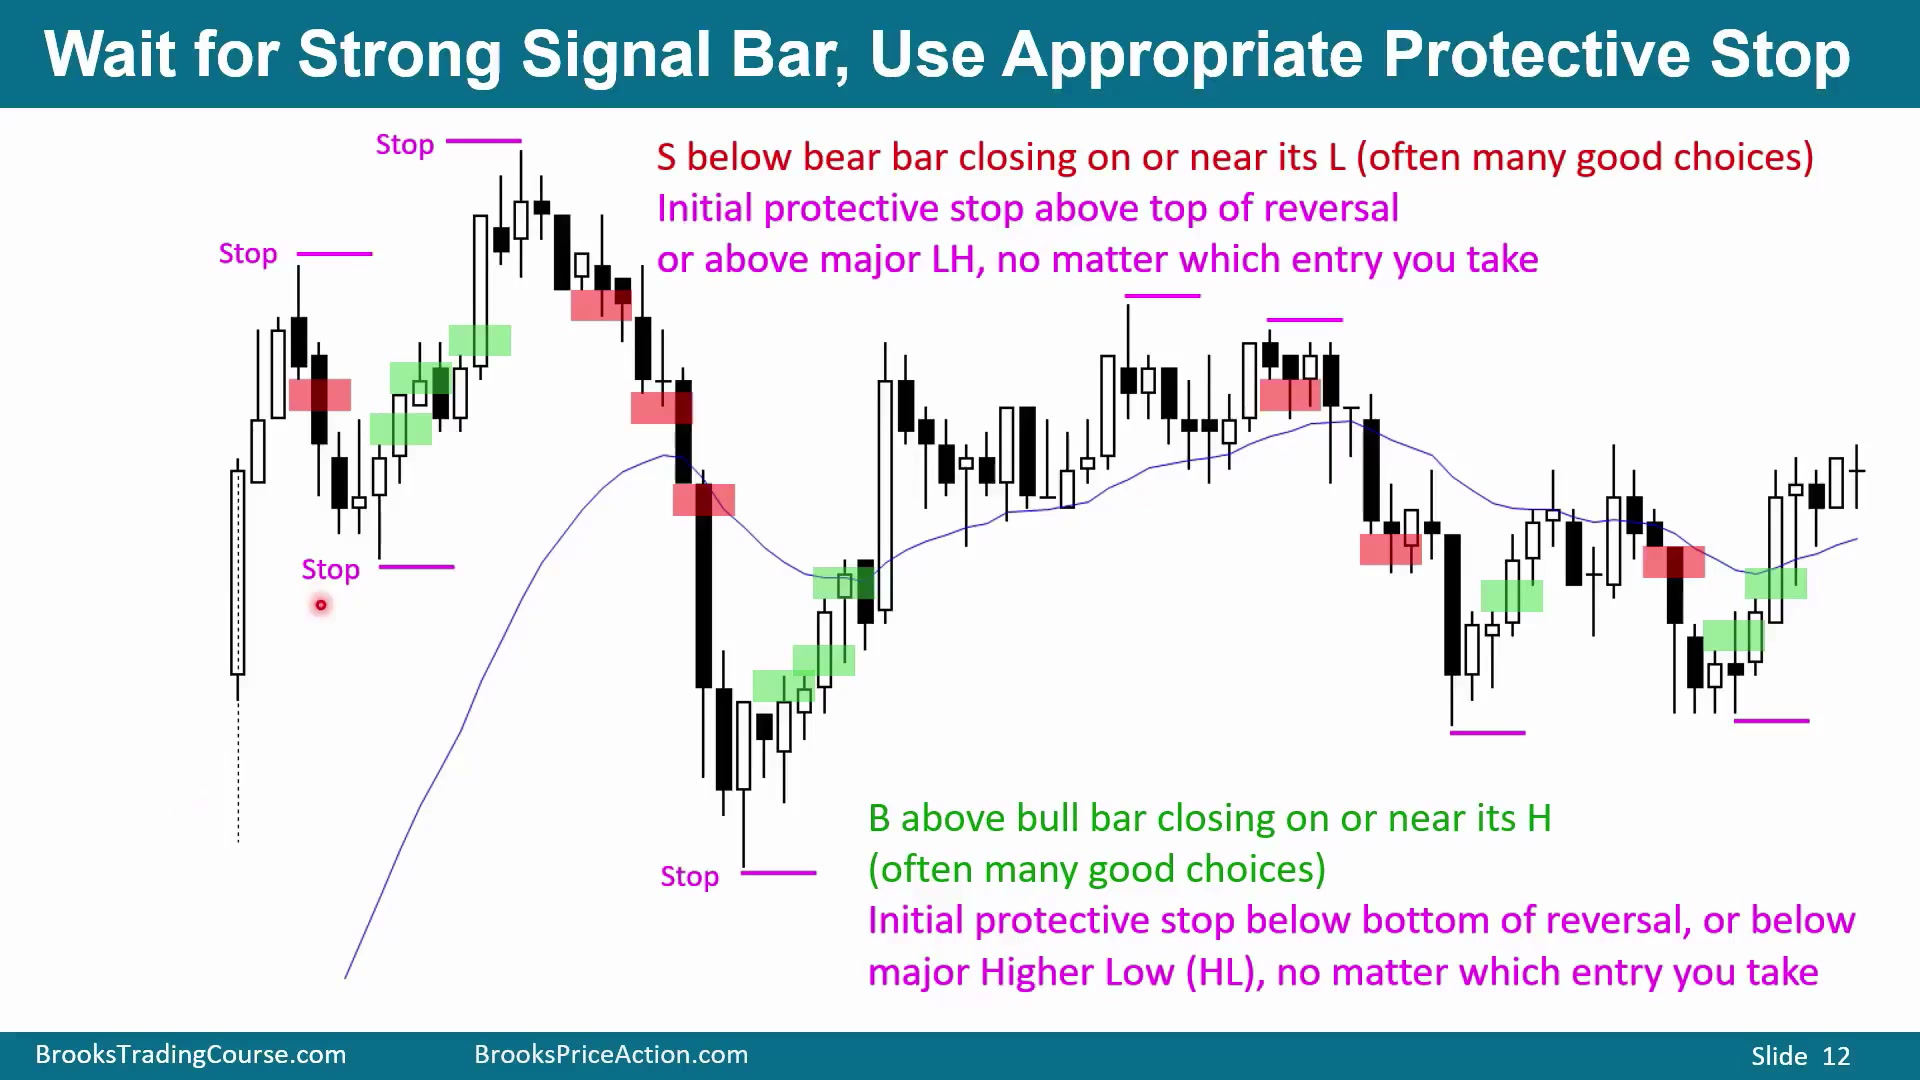
做空时,止损放在反转顶部上方。卖出信号 K 线下方触发做空,但止损常常应放在上涨 swing 顶部,而不是只贴着信号 K 线。有些较早做空可以把止损放在信号 K 线上方,但更稳妥的是放在整个 swing 顶部。
初学者应主要寻找 swing trades,目标通常是每天一到三笔。持续盈利后,才加入较小形态和 scalps,交易频率可增加到每天三到十笔。开盘阶段尤其不适合还没稳定盈利的交易者频繁进出。
开盘波动大时,晚入场并不自动意味着止损变小;如果仍属于同一反转,止损位置仍要覆盖整个结构。
形态库用于预演后续
Time: 11:57
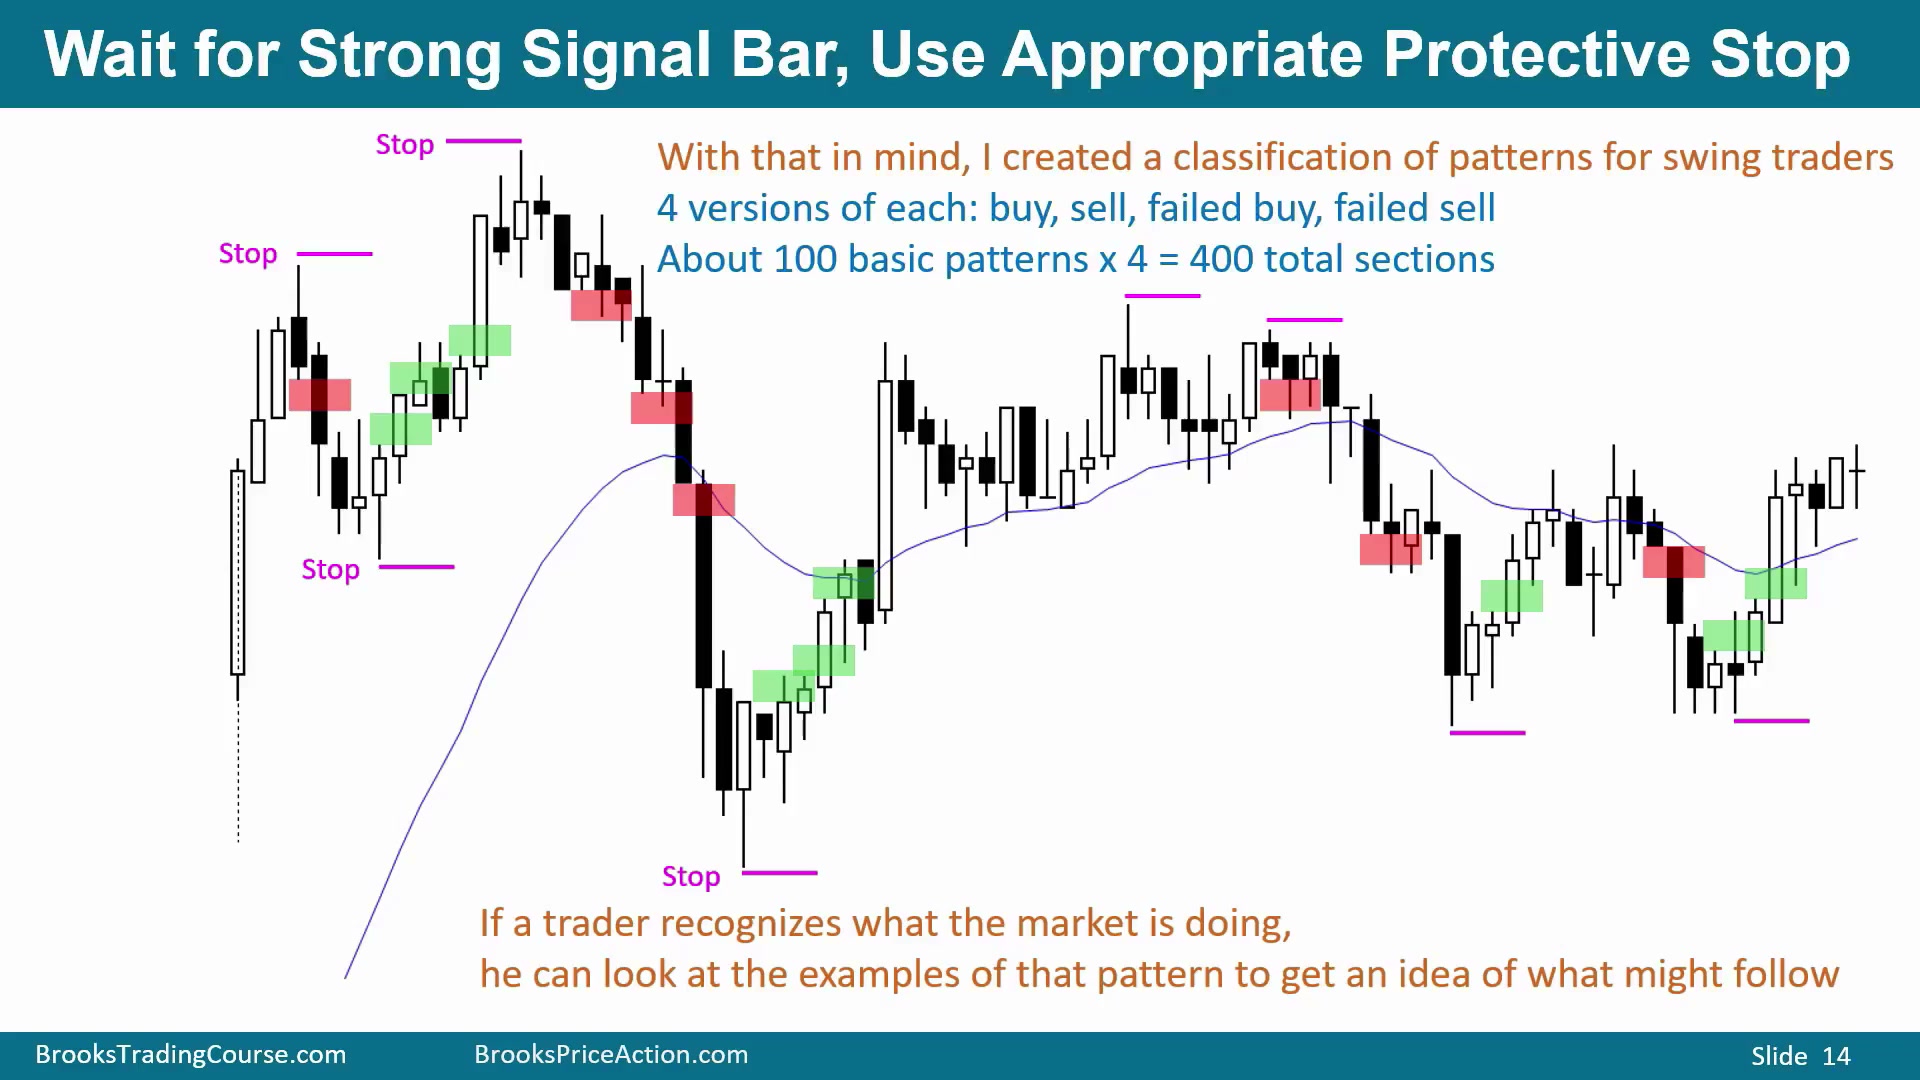
形态分类大约有 100 个经典形态,每个都有买入、卖出、失败买入、失败卖出四个版本,因此约 400 个类别,并且每类有许多例子。识别当前市场形态后,可以查类似案例,估计接下来可能如何发展。
例如看到 Wedge Bottom,就可以比较类似案例,判断反转通常多强、是否可能失败、后续是否需要第二次测试。接下来的案例从低开后反弹到 Buy Climax,再向下反转开始。
Buy Climax 后反转向下
Time: 12:57
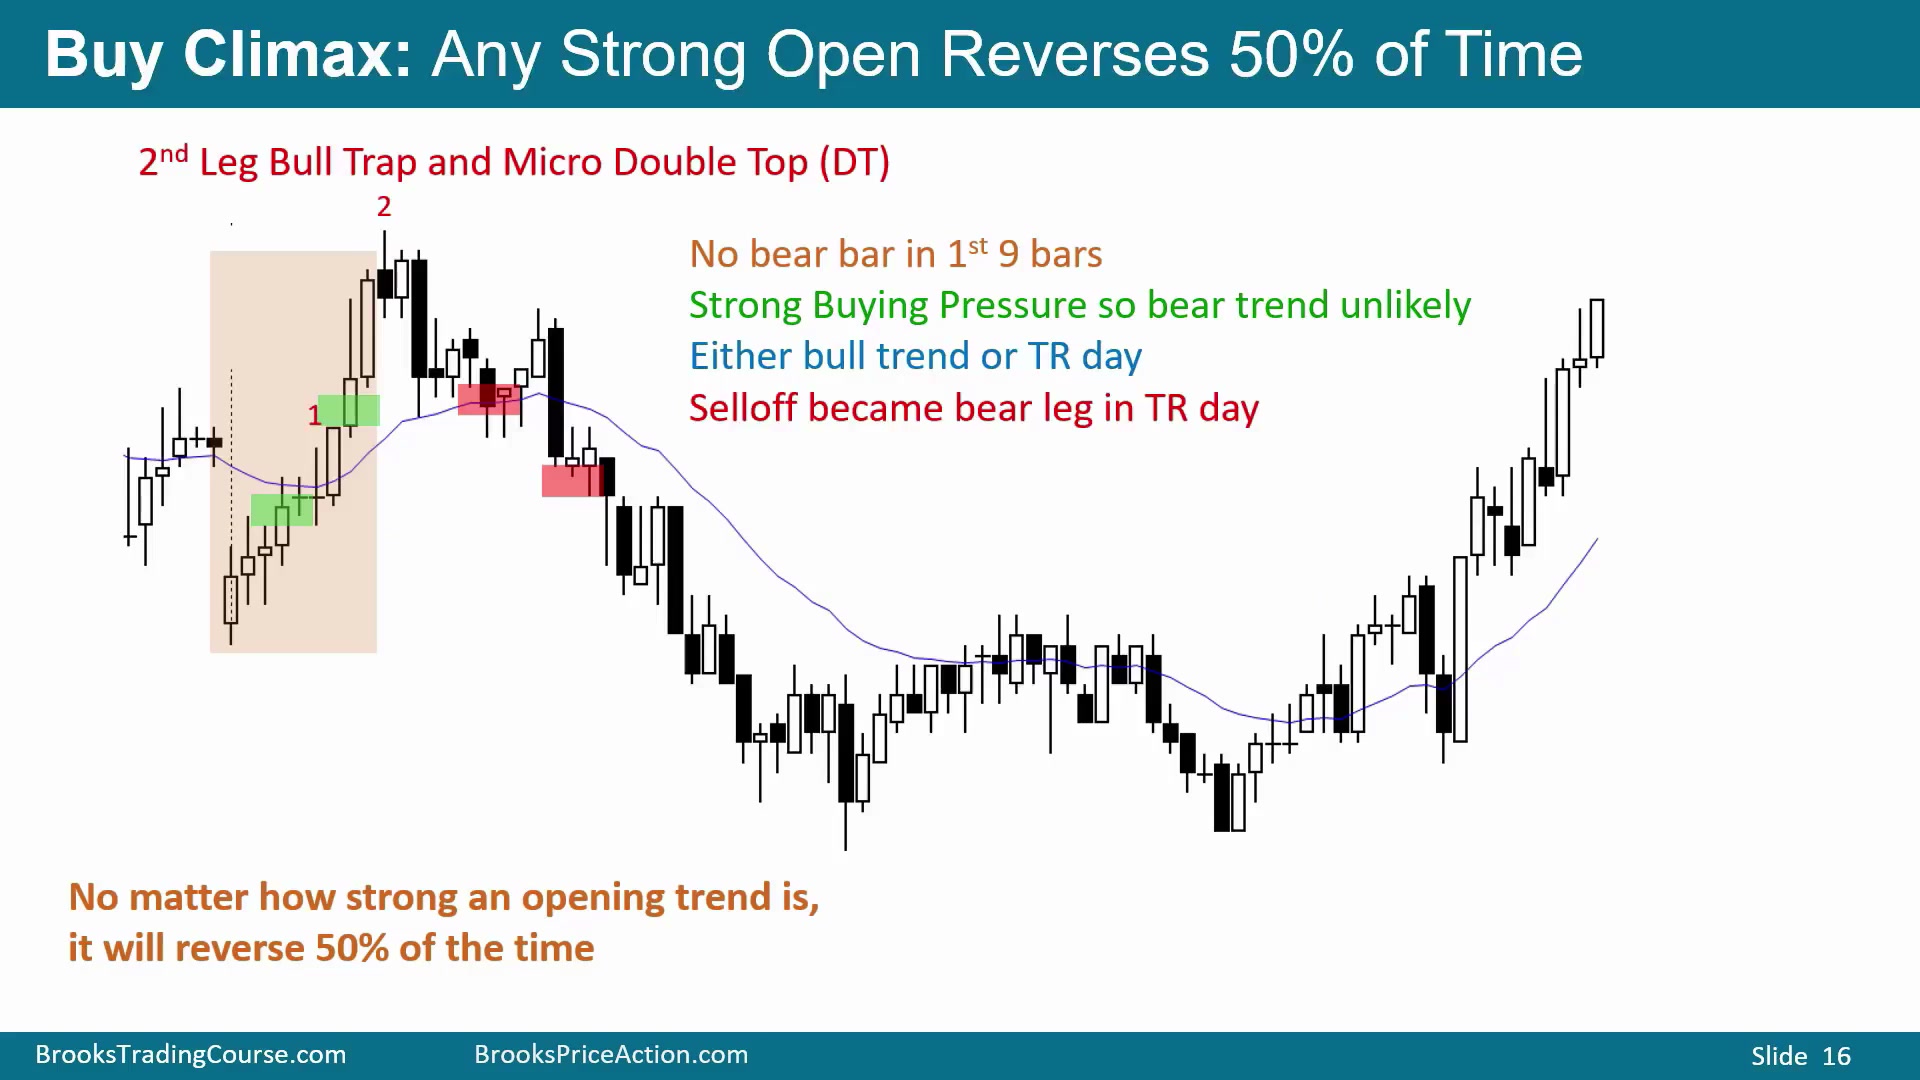
图中低开到昨天收盘和均线下方,随后强力反弹,但它是 Buy Climax,并反转向下。上涨过程中可以做多,但必须准备在下跌途中卖出,因为任何强开盘趋势都有约 50% 反转概率。
前九根没有阴线,买压很强,所以强空头趋势不太可能直接出现。若这种强开盘后下跌,常见结果是形成多头旗形后恢复上涨,或下跌成为交易区间中的空头腿。图中上涨两腿,第一腿三推反弹让空头希望形成均线附近 Parabolic Wedge bear flag;随后向上突破失败,成为 two-legged trap。Micro Double Top 后,买在高位的多头因阴线失望并退出,空头可以在颈线下方、第二入场或收低阴线下方卖。
这里没有前九根阴线,说明买压极强,所以反转向下更可能成为交易区间中的一条空头腿,而不是立刻形成强空头趋势。空头获利目标要现实:卖出成功后,后面仍可能出现另一条多头腿。图中的 selloff 最终成为交易区间日的一部分,而不是整天单边空头趋势。
测试昨天高点后的 Low 2
Time: 14:50
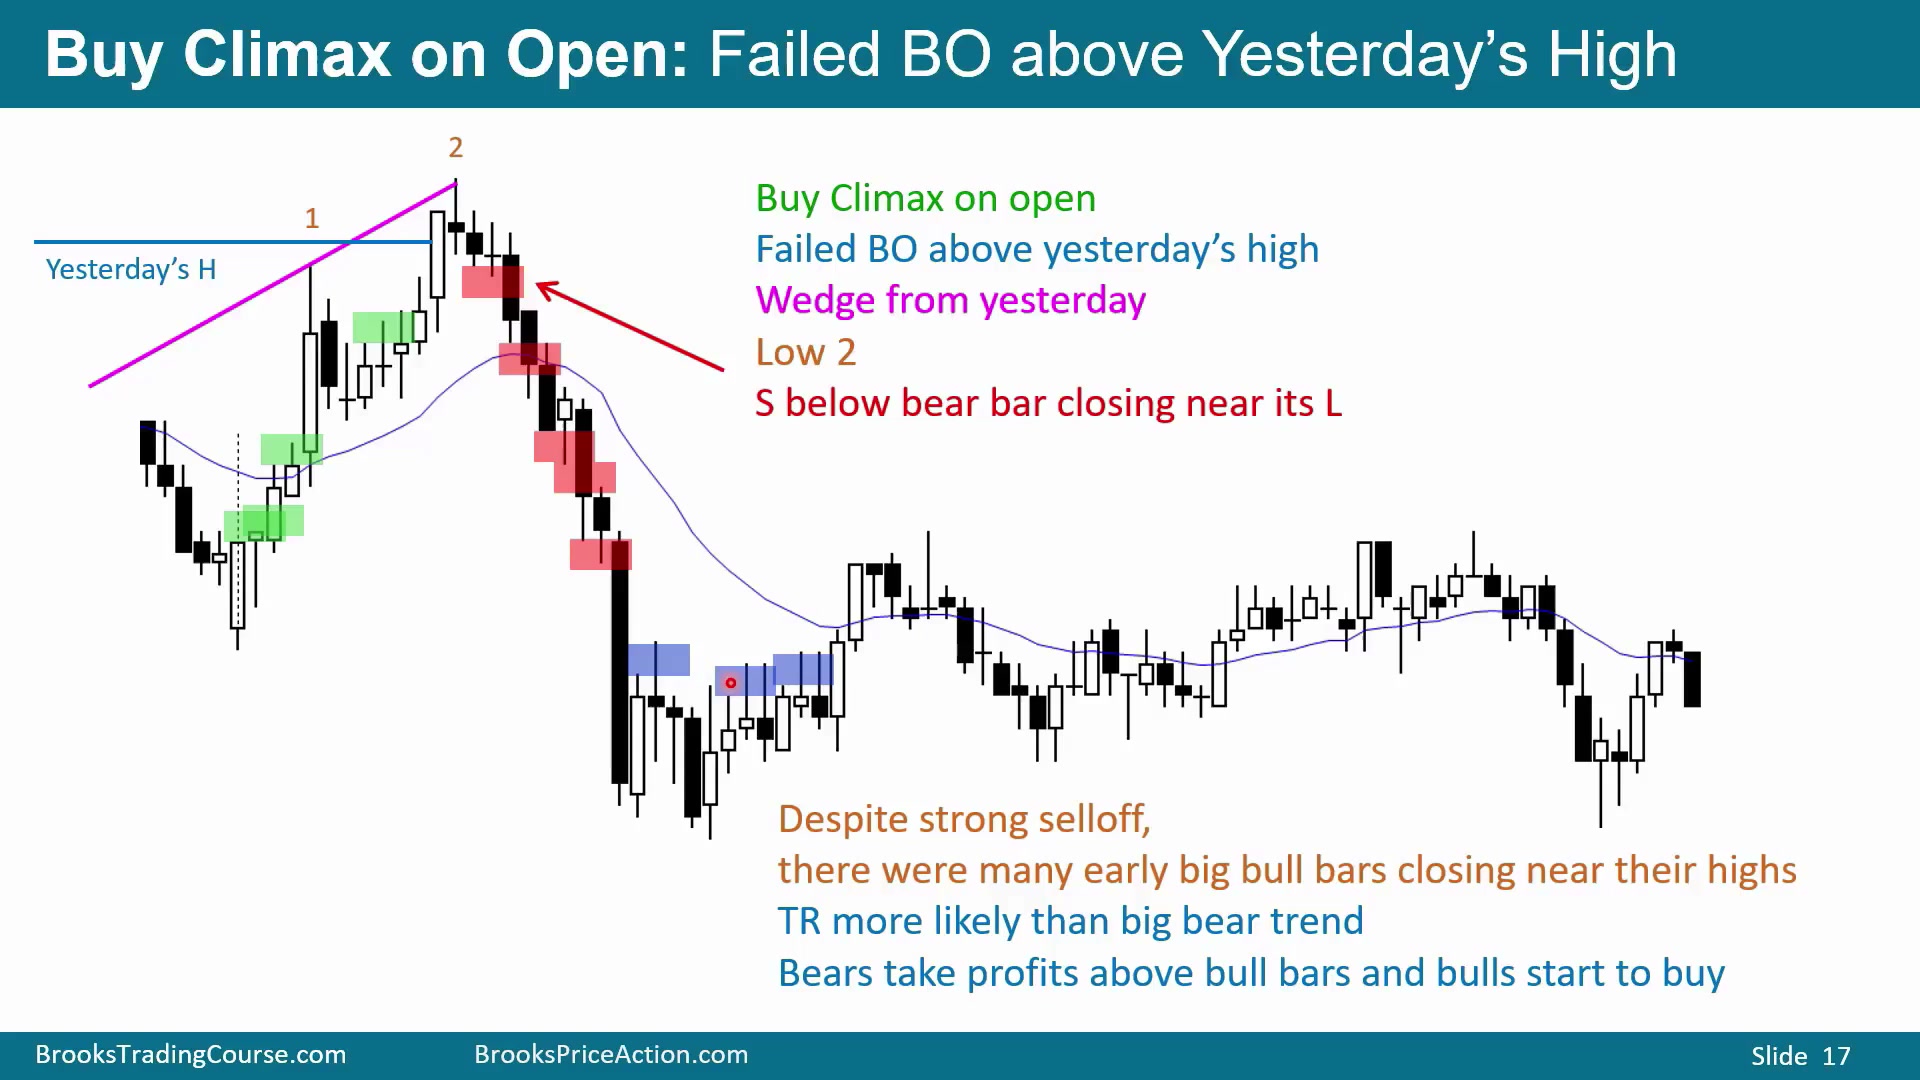
图中低开后强反弹,两腿上涨并突破昨天高点后反转。昨天高低点必须持续关注,市场经常测试它们后反转;有时略低于昨天高点反转,有时略高后反转,昨天低点也一样。
这里形成 Buy Climax、第二次 Buy Climax、突破昨天高点失败和 Low 2。第一卖点有明显尾巴,更像 doji,概率不如后面的收低阴线。只要下跌继续,空头可在收近低点的阴线下方卖。但连续四五根下跌后突然出现大阴线,常引发获利了结,不适合追卖。后面强反转向上时,空头可在阳线上方或第二次买入信号上方退出。
昨天高点附近的失败突破会让多头失望,也会吸引空头寻找 Low 2。信号 K 线越接近收低,卖出概率越好;长尾 doji 则说明下方已有买盘。
Buy Climax 反转失败成为 bull flag
Time: 16:32
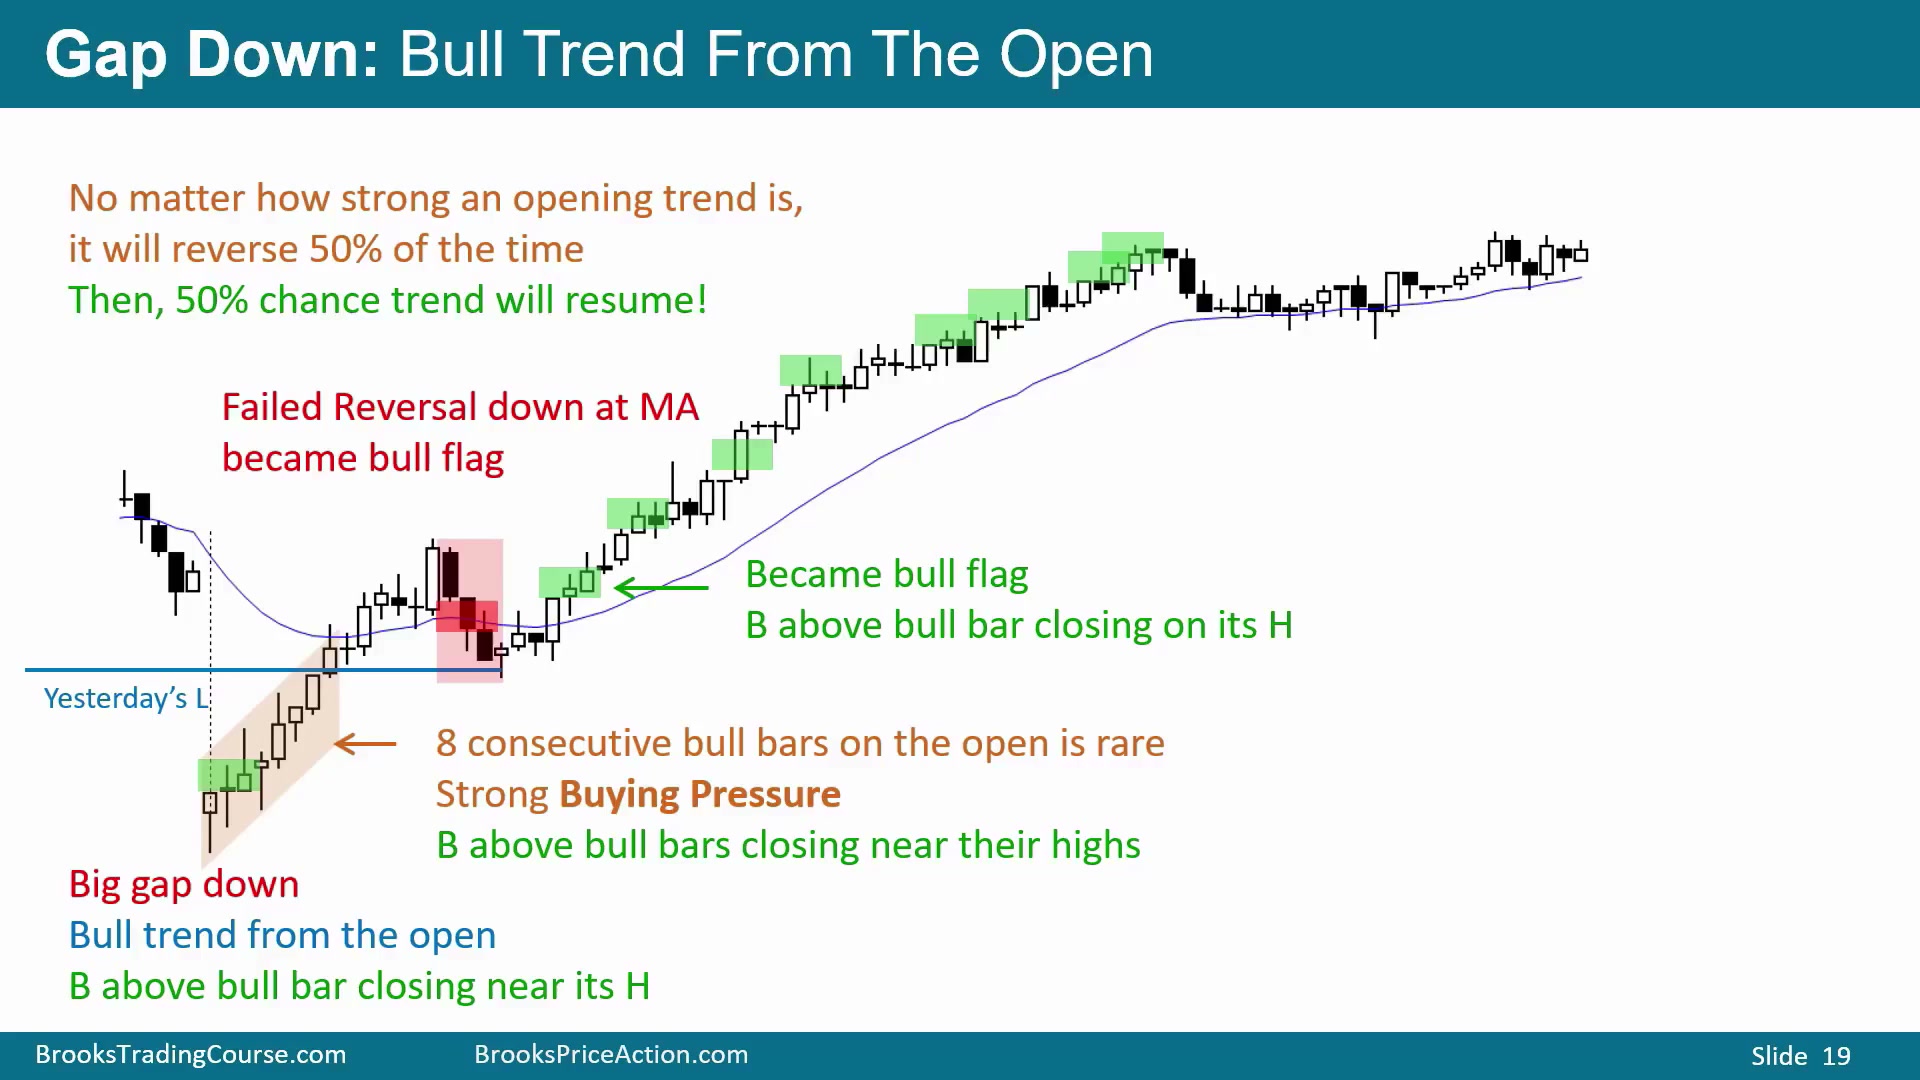
图中低开后强反弹,空头尝试第二入场卖出,想让昨天低点下方的反转失败。但市场再次测试昨天低点后形成多头趋势,所以 Buy Climax 没有转成下跌,而是变成 bull flag。
开盘阶段看起来好的交易也常只有 50% 成功率,不能固执。图中八根开盘 K 线都有多头实体,买压极强。空头在均线附近的 Buy Climax 回调处卖出本身合理,但一旦后面出现收在高点的阳线,就要平空并转多。随后连续阳线、无回调、收近高点,交易者需要做多;错过第一买点,也可在后续收高阳线上方买。
这里的关键不是空头最初卖错,而是空头不能和仓位结婚。开盘阶段任何漂亮信号都可能只有一半概率成功;当反转没有继续下去,而是形成 bull flag,持空者必须承认市场已经恢复多头趋势。后续没有回调、连续收高,说明买压持续,空仓者也要找机会转多。
Sell Climax 后 ii 和 higher low
Time: 18:53
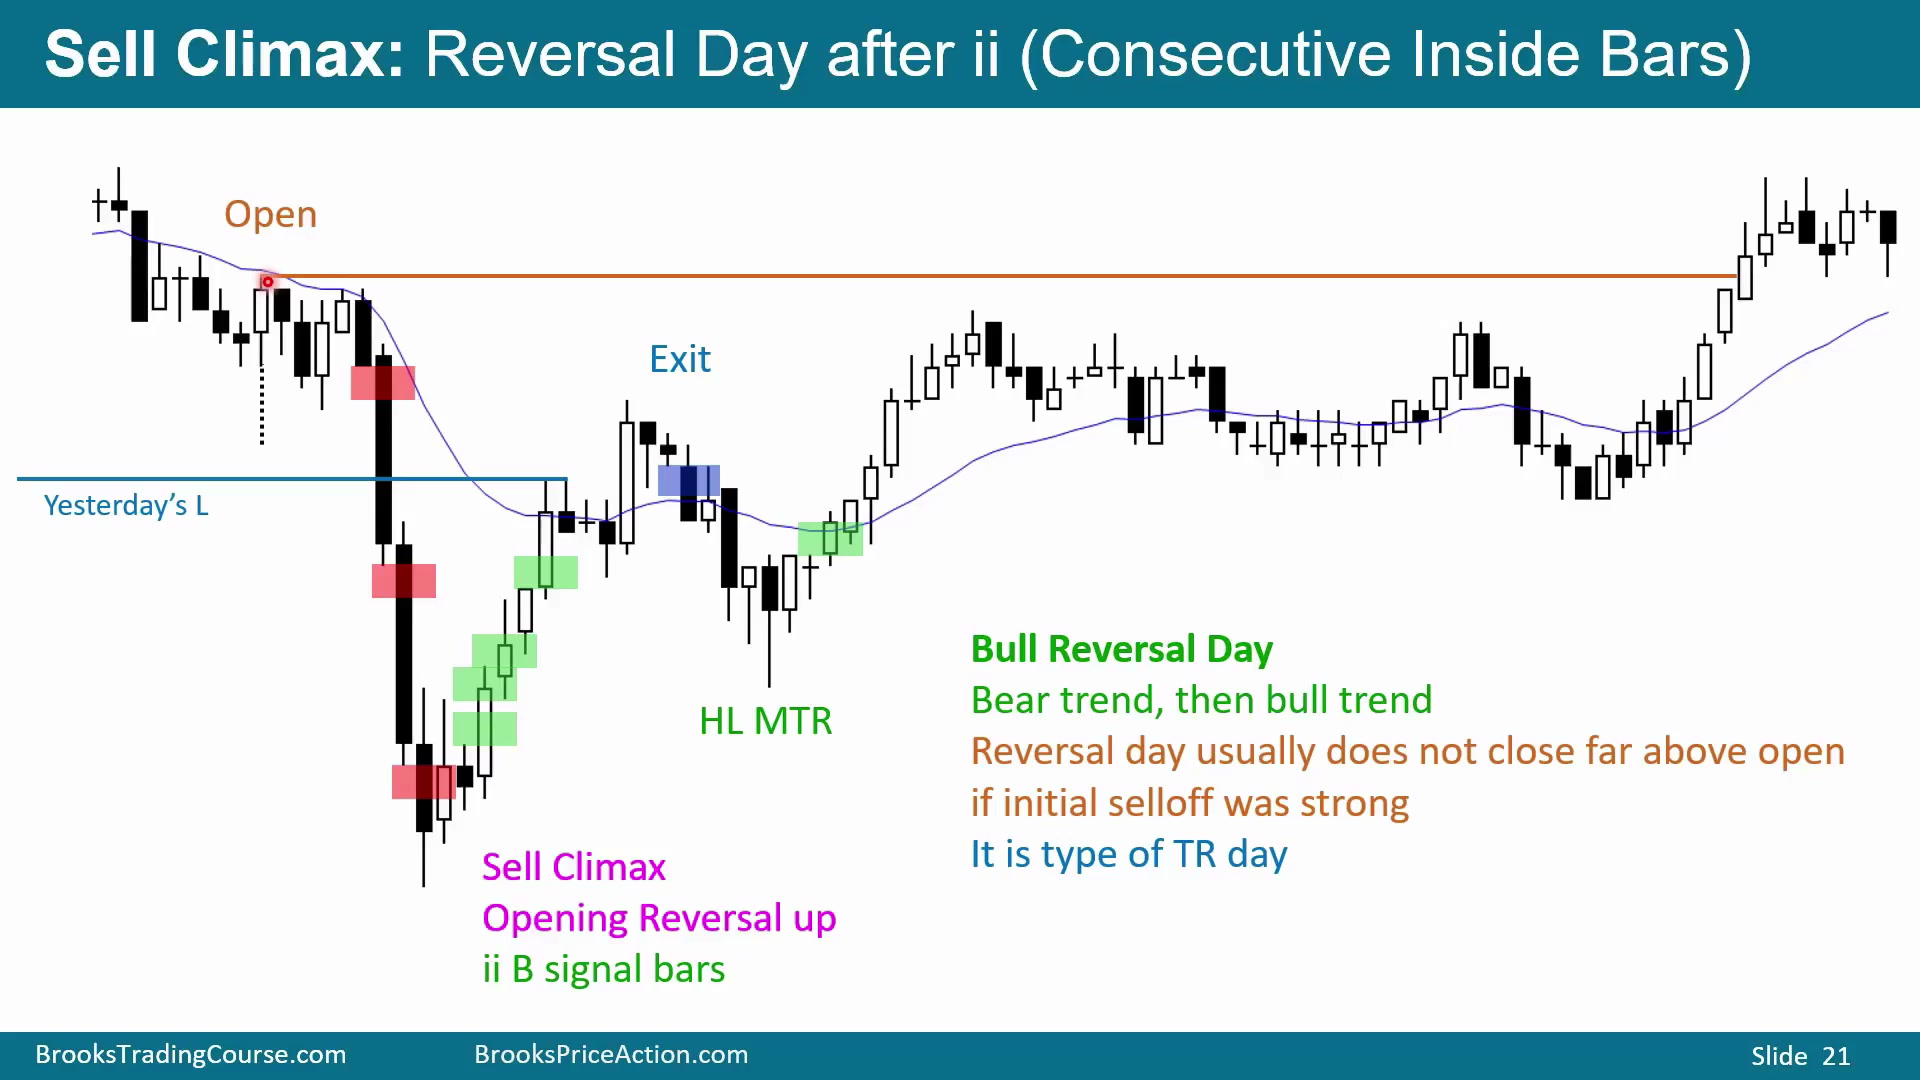
图中低开到均线下方,空头在均线下方得到 Double Top 和收低阴线,做空合理。但强空头开盘约 50% 会反转,出现阳线时平空合理。随后形成 ii,连续 inside bars 在小级别上是三角形。即使 ii 的第二根是阴线,在其上方买也合理;更保守可等阳线或收高阳线。
上涨两腿到均线后出现 bear ii,多头可退出。但强反转向上后,再强烈反转下跌的概率较低;若下跌,更可能形成 bull flag。反转后接 bull flag 就是 cup and handle。图中还可称为 Higher Low Major Trend Reversal:空头趋势、强小反转、回落测试前低但没接近,形成 higher low。开盘大跌后反转到新高,通常不会远超早前高点,更像交易区间日。
ii 的价值在于压缩波动后给出突破点;在 Sell Climax 后的 ii,即使第二根是阴线,向上突破也可能触发空头回补。Higher Low Major Trend Reversal 则说明市场已经从强空头腿转为测试低点失败,多头买入不只是追阳线,而是在买一个更高低点。
图中向上反转后的 bull flag 没有接近前低,说明空头已经无法把市场压回底部。这个 higher low 是多头愿意买回调的核心证据。
大低开后的第二买入
Time: 21:13
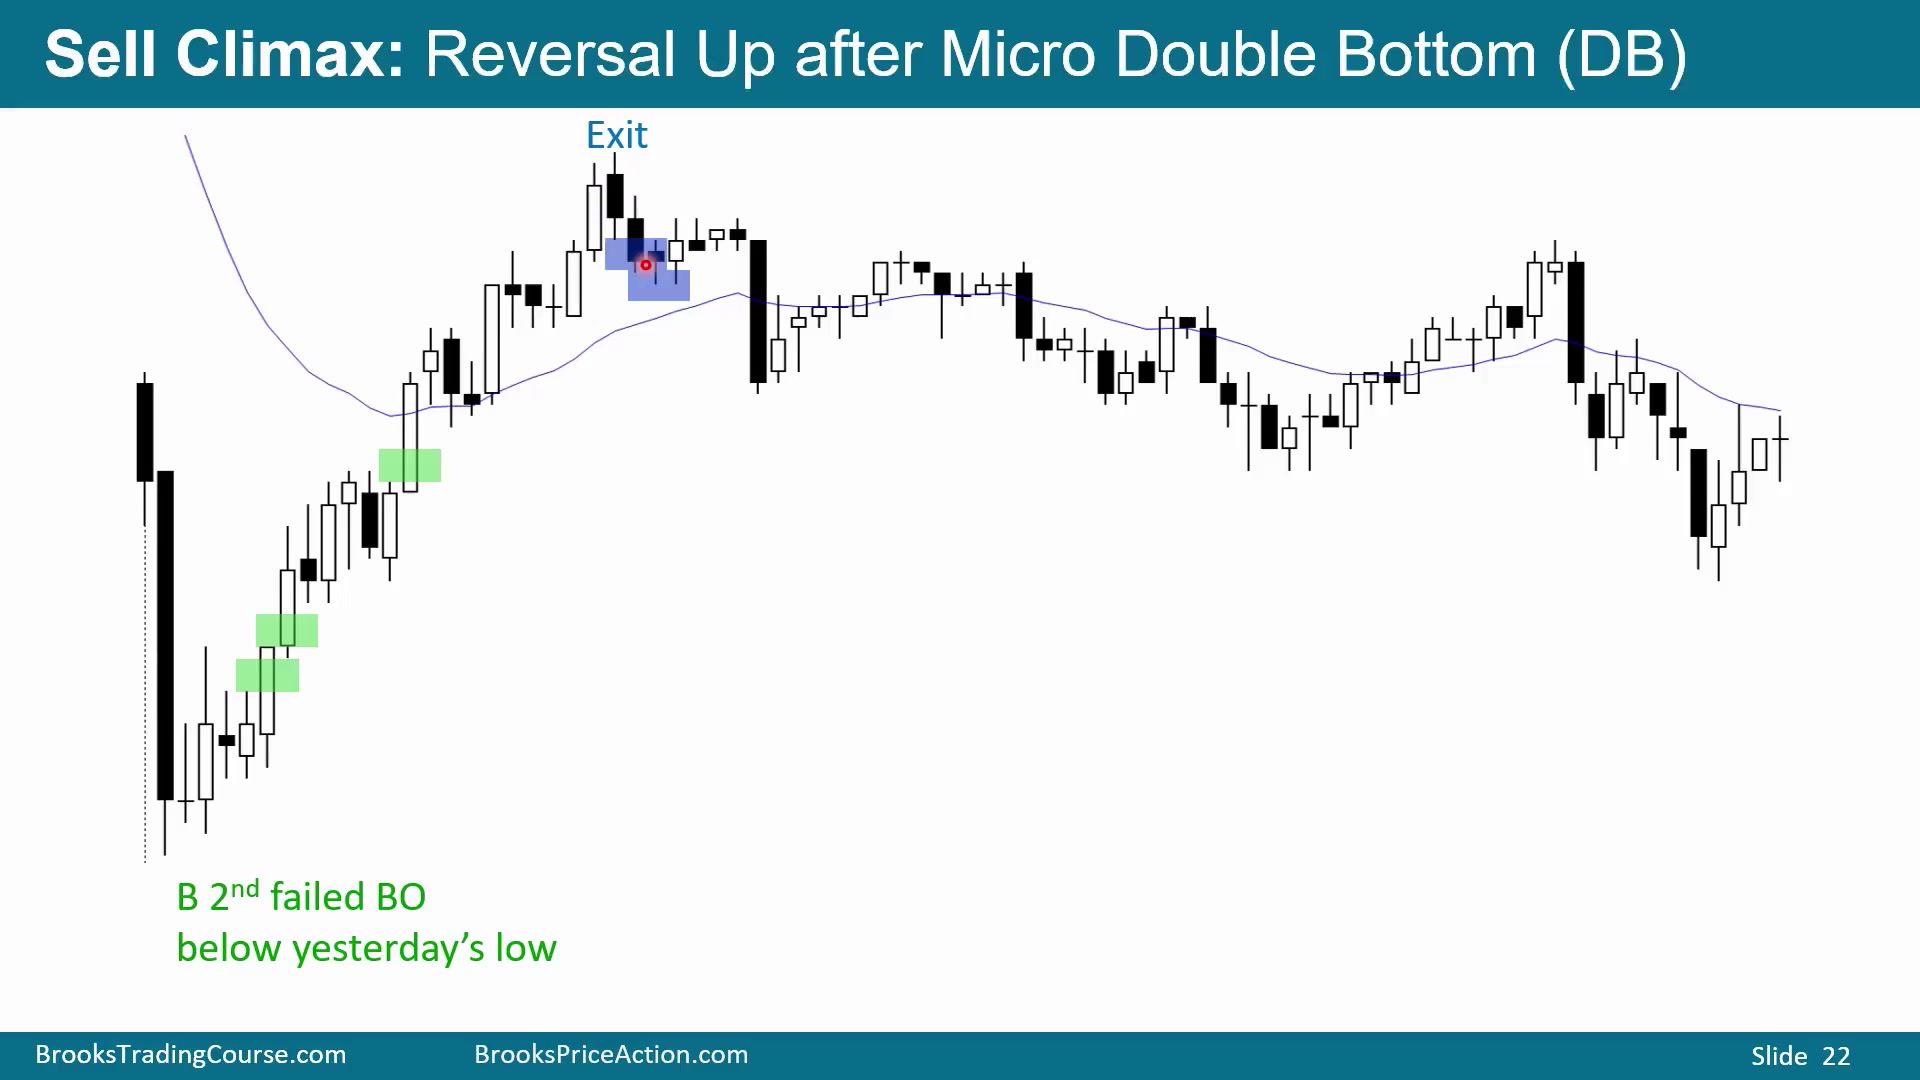
图中大幅低开到均线下方,开盘大阴线构成 Sell Climax,所以要想到 50% 概率反转。第一根 doji 不是强信号,但后面给出第二买入:第一次买入失败后,空头没能恢复下跌,第二次向上反转出现,且是 ii,概率更高。
也可以等收近高点的阳线再买。随后上涨多腿:Buy Climax、回调、第二次 Buy Climax、回调、第三次 Buy Climax,形成 Parabolic Wedge rally。出现阴线后,多头可在其低点下方退出;若接着连续阴线且第二根收低,退出更明确。
第二腿空头陷阱
Time: 22:10
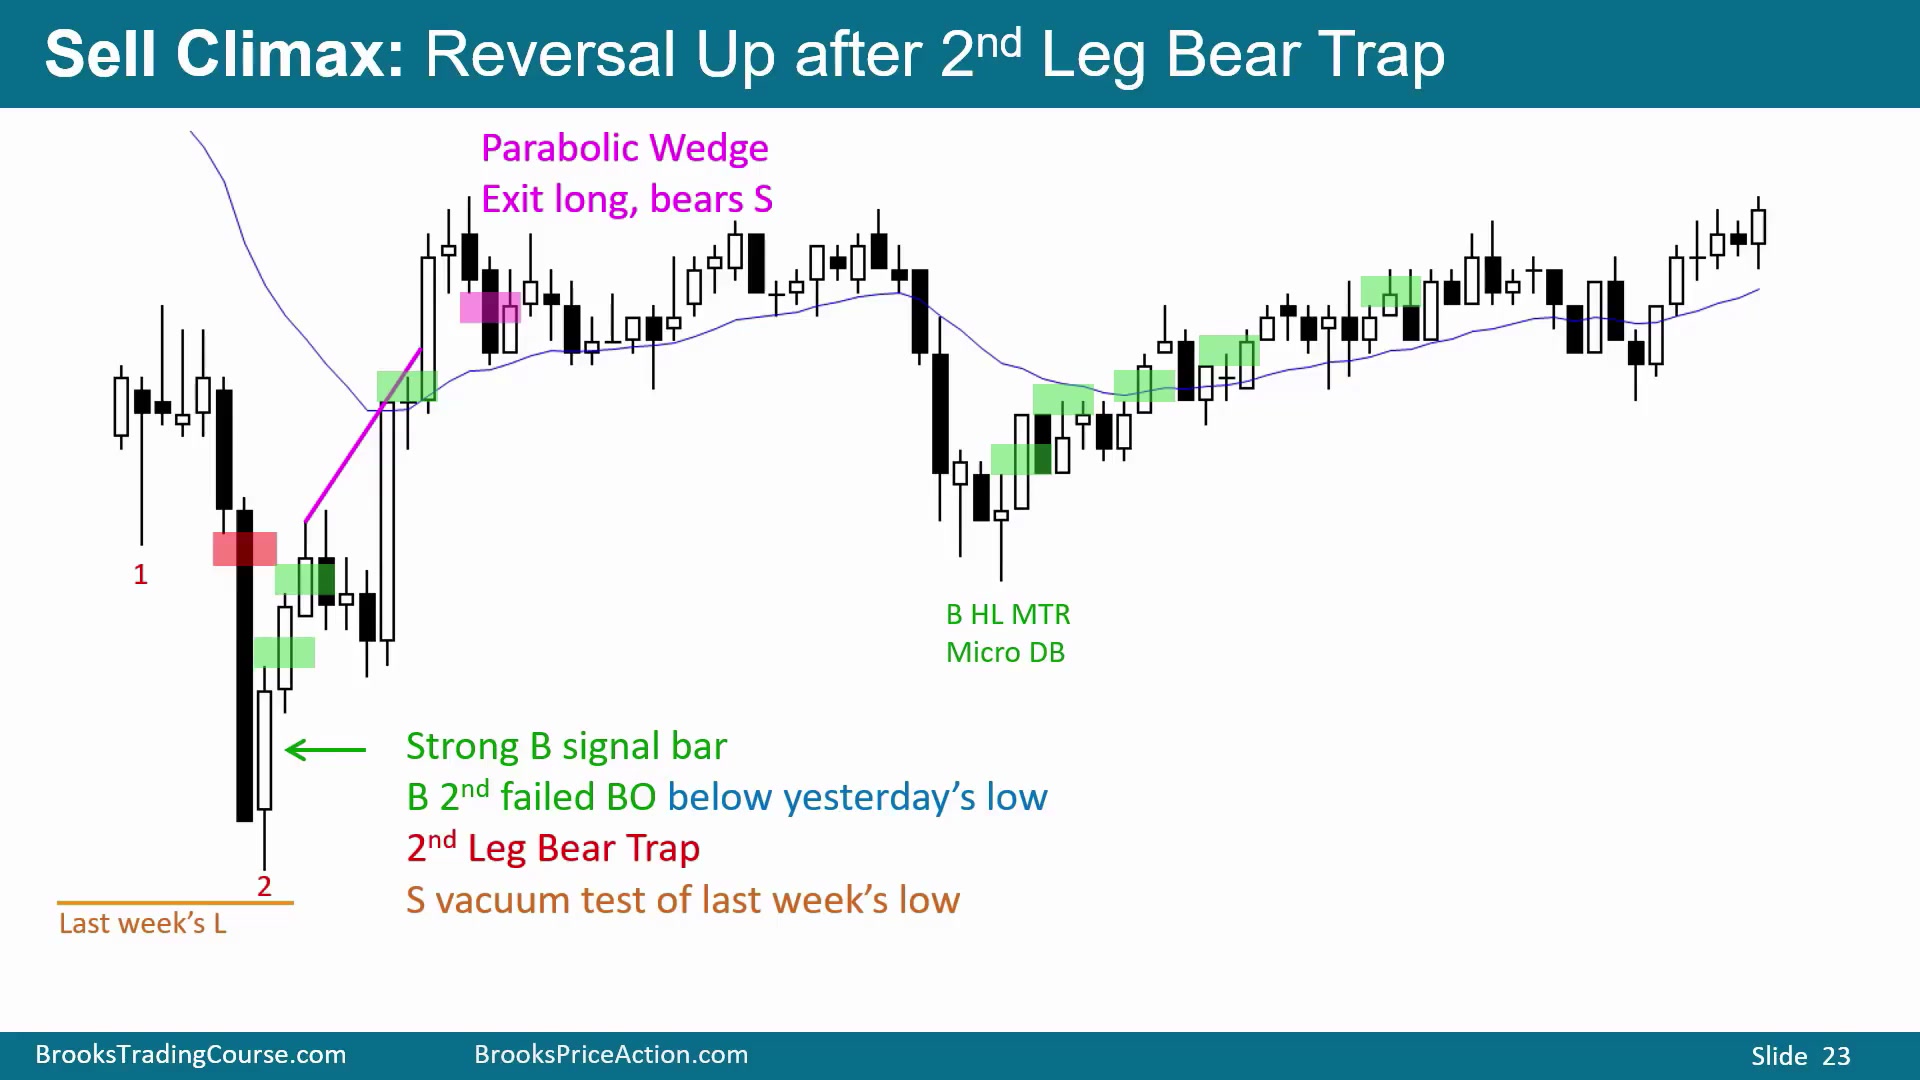
图中 Sell Climax 测试上周低点。开盘常测试昨天低点、上周低点或上月低点。这里强多头反转 K 线出现在上周低点附近,并且是第二次向上反转。空头若前面卖出,必须退出;多头会在第一根或第二根强阳线上方买。
这是 2nd Leg Trap:低开后先下跌、反转向上、再更强地下跌,空头希望第二段下跌开启趋势,结果却把空头困在低位。若空头卖在阴线收盘或低点下方,几乎没有好退出,只能在强阳线上方亏损回补。后面三腿上涨形成 Parabolic Wedge rally,多头可在阴线下方退出;再往后出现 Micro Double Bottom 和 Higher Low Major Trend Reversal,多头重新买入。
测试上周低点这种更高周期支撑时,第二次向上反转尤其重要。空头若低位追卖,一旦强阳线出现,损失会很快固定;但同一交易者若能反手买入,后面的上涨足以补回前面的亏损。
昨天低点下方的动能衰竭
Time: 23:58
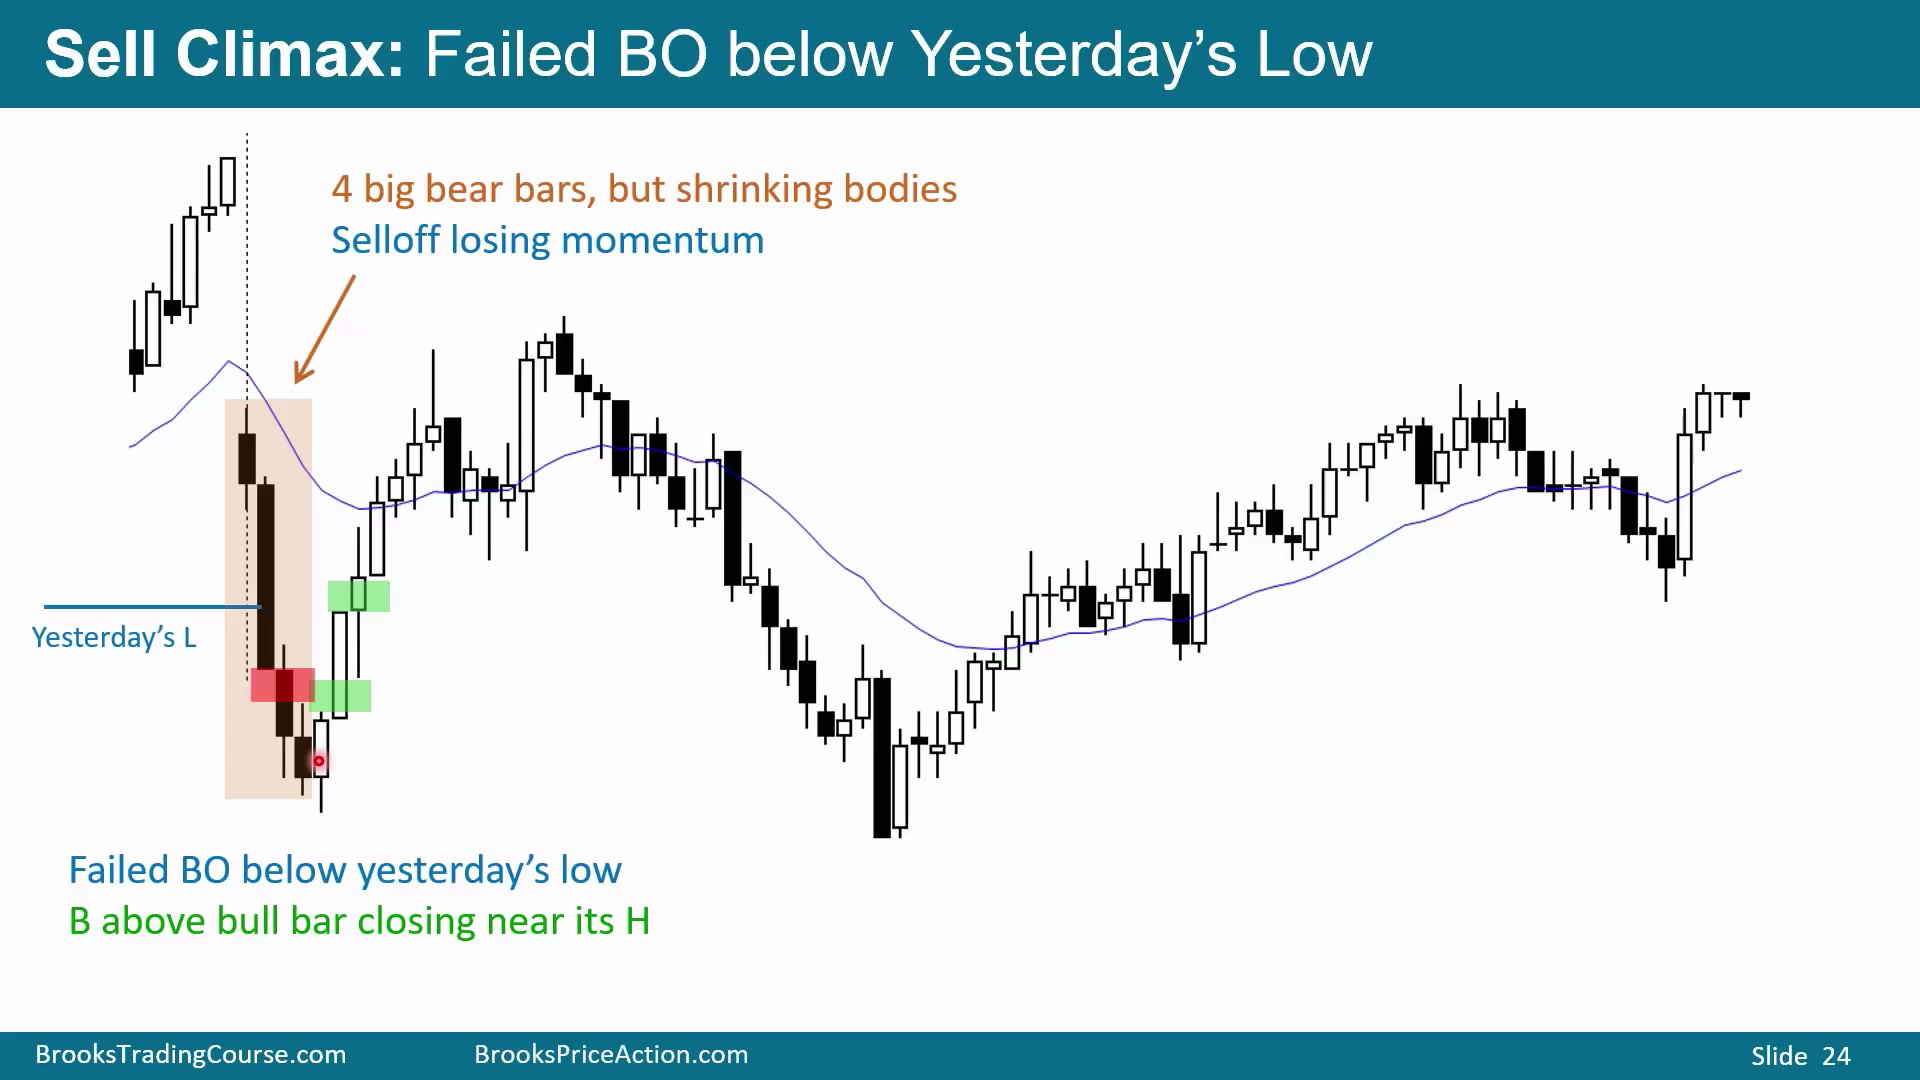
图中低开到昨天收盘和均线下方,并跌破昨天低点。两根连续阴线中一根收在低点,卖出合理。但市场正从昨天低点下方反转向上,而开盘交易者总在寻找对昨天高低点的测试和反转。
阴线实体逐步缩小,显示动能丧失;随后出现多头实体。卖在前面阴线下方的空头必须退出,多头会买入寻找 swing up。三推下跌、实体缩小、漂亮反转 K 线,再加第二根收在高点且实体更大的阳线,说明市场向上加速,买入概率更高。
紧空头通道后的第一反转多半小级别
Time: 25:07
图中没有低开,但开盘强烈下跌,是 Sell Climax。随后市场多次尝试筑底,阳线和 doji 都是尝试;更好的底部是第二入场买入和阳线。结构上,三根 K 线向下 spike 后,通常还会有两腿下跌再尝试反转。
第三腿后向上反转概率增加,买入合理。但紧空头通道持续很多根,第一次向上反转通常只是小级别。有时能赚 swing,有时入场后马上失望,入场 K 线变阴,随后又有阴线。多头应在收低阴线下方退出,尤其三四次小上推失败后;空头会卖出测试低点。长影线和频繁反转说明这段抛售可能转成交易区间,到低点附近又会找向上反转。
第一次反转之所以通常小,是因为紧空头通道让空头仍有信心继续卖。多头需要看到第二次或第三次反转、Micro Double Bottom,或至少一根质量更好的阳线。
日线缺口支撑上的楔形卖出高潮
Time: 27:10
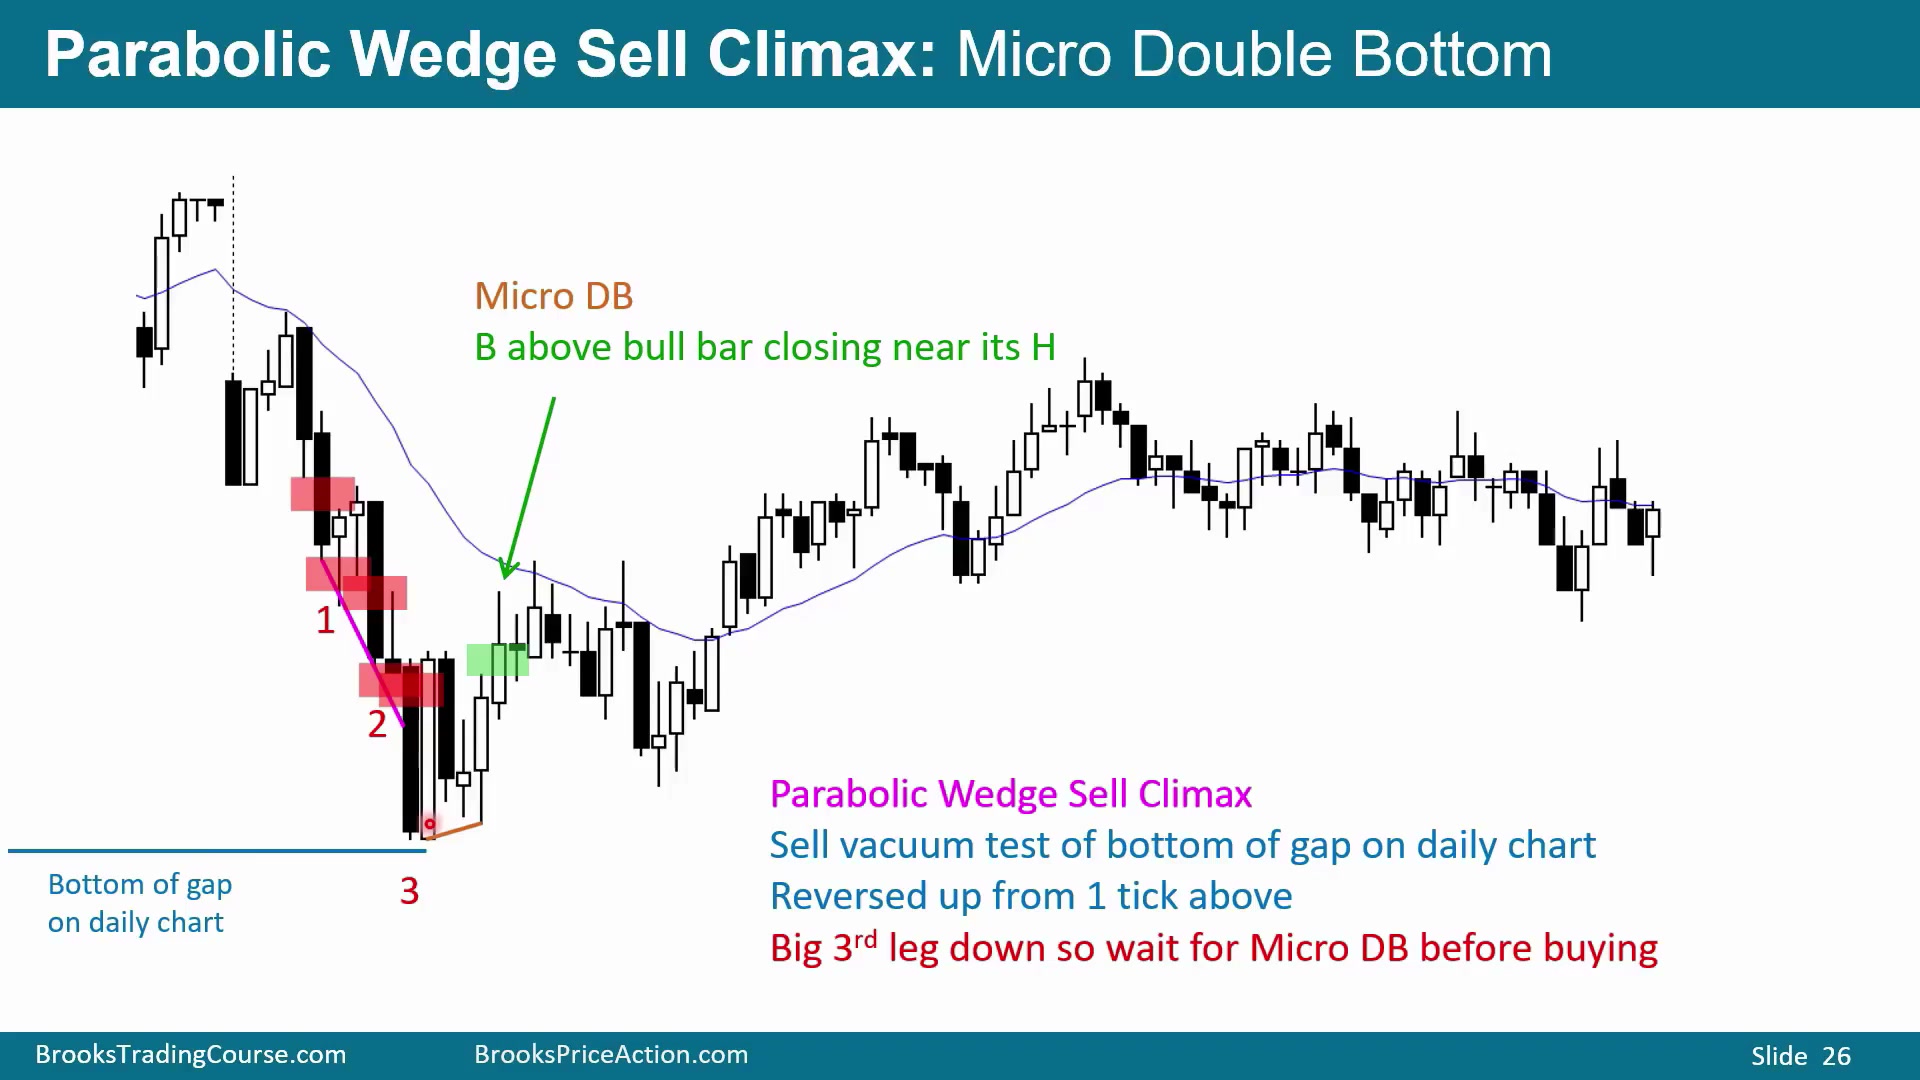
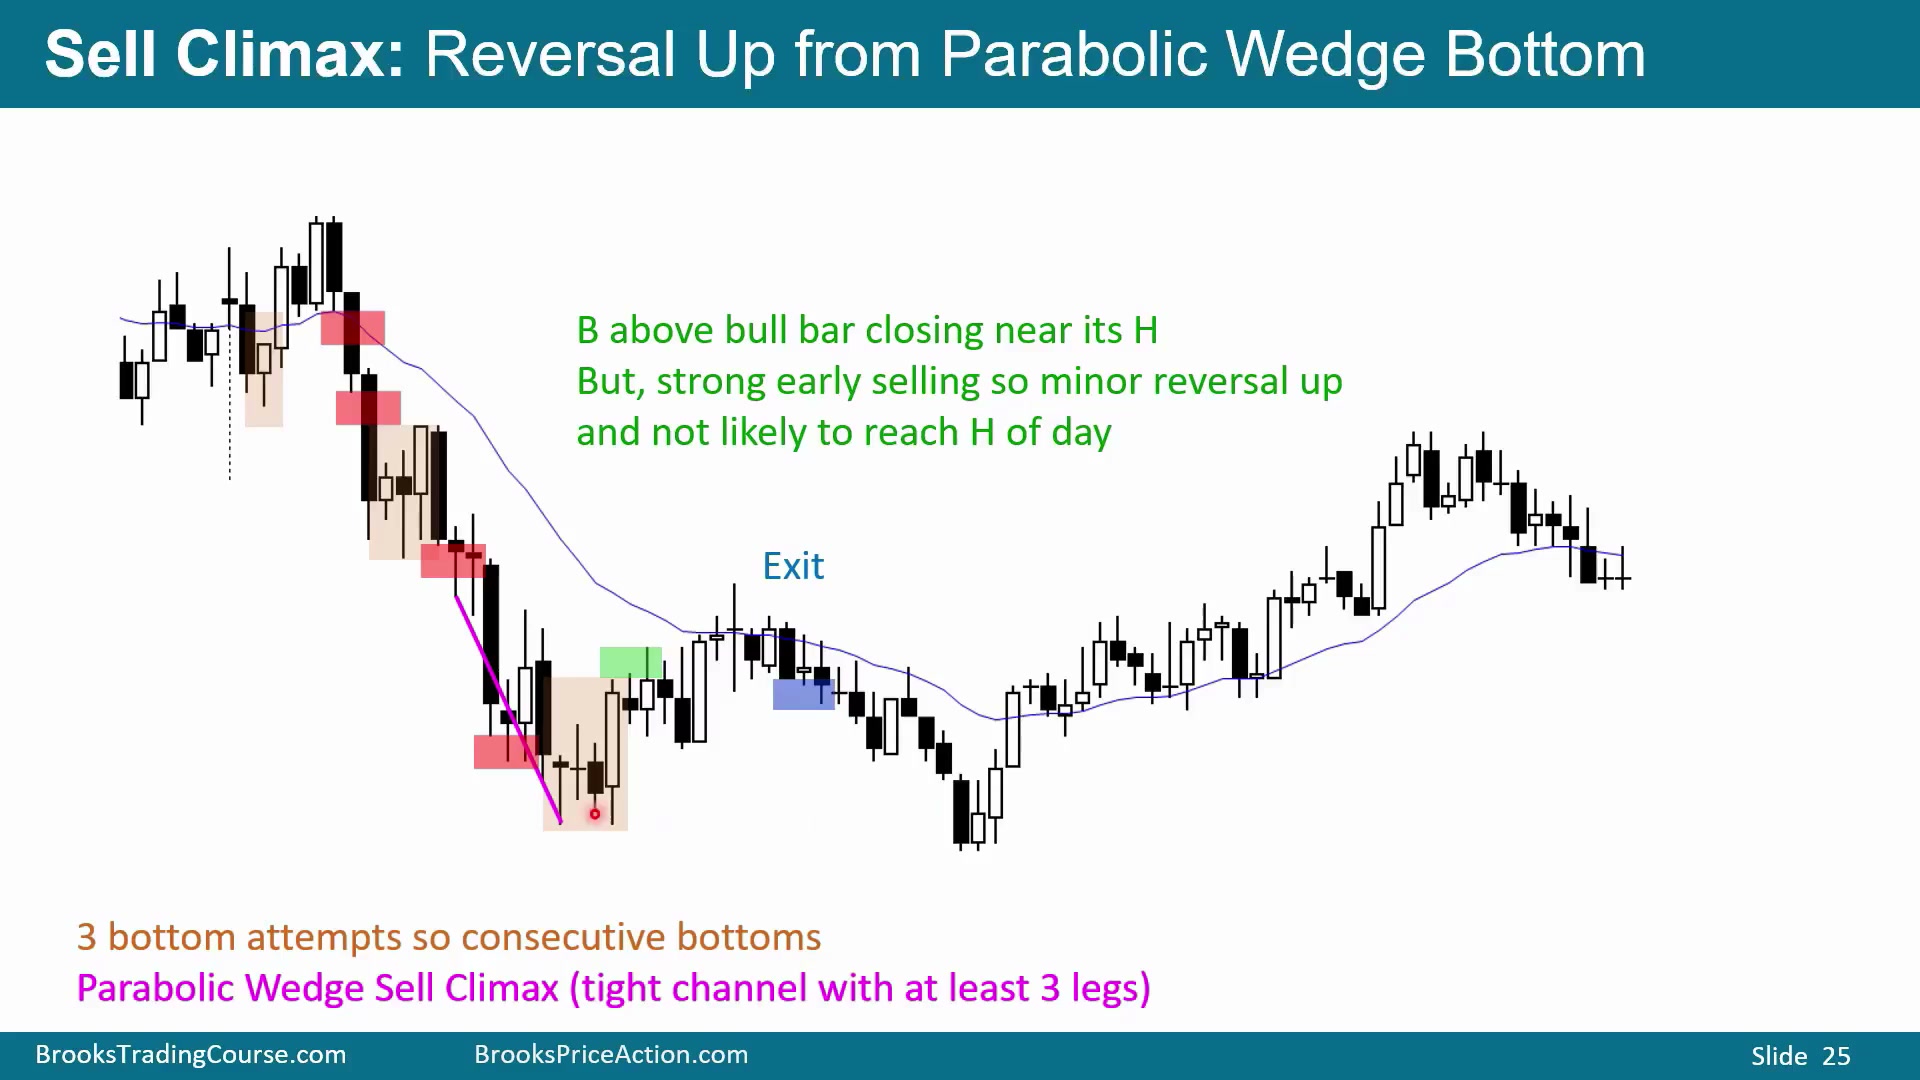
图中大幅低开后,多头反弹弱,没有收在均线上方,随后向下反转。两根 K 线形成 spike,之后暂停、第二腿、小暂停、第三腿,构成 Parabolic Wedge Sell Climax。关键是位置:这次反转发生在日线缺口底部上方几乎一 tick 的地方。
强下跌可能只是被真空吸向重要支撑。随后形成 Micro Double Bottom,卖在前一根阴线收盘的空头因阳线失望,会在原入场价附近回补。紧空头通道后的第一次反转通常小级别,交易者会等第二次反转和向上 swing。这里有重要支撑、Parabolic Wedge、Micro Double Bottom 和两根不错阳线,可在阳线上方买。
日线缺口底部提供了看不见于单纯 5 分钟图的支撑背景。下跌接近该支撑时,空头获利了结和多头买入会同时出现,Micro Double Bottom 就是这种力量变化的可见痕迹。
第二次反转比第一次更可靠,因为它测试了空头趋势底部。若第二次反转配合好阳线,空头会把它视为失败突破并回补。
趋势开盘失败成为三角形区间
Time: 29:10
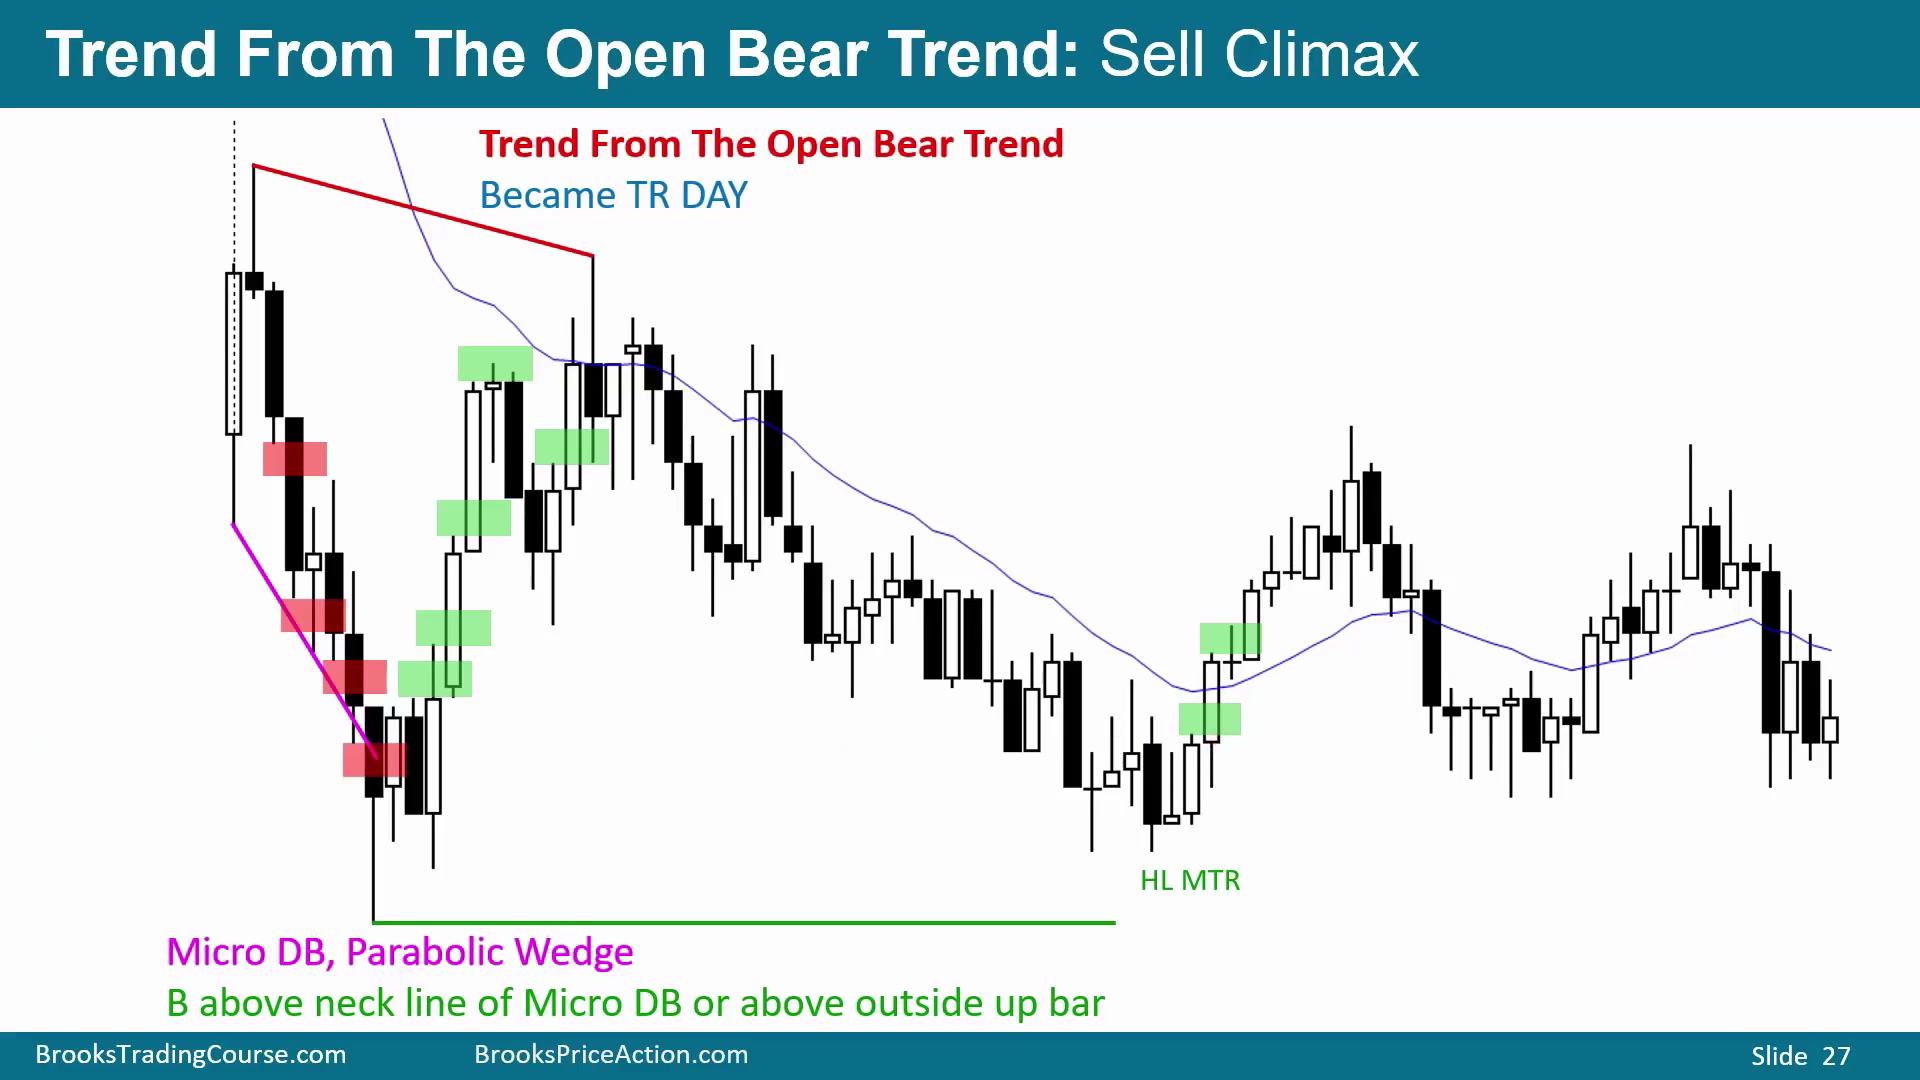
图中看起来可能是空头 trend from the open,但只有约 20% 能延续到收盘,约 80% 会反转并形成交易区间。这里空头开盘趋势最终反转,全天形成三角形交易区间:lower highs、higher lows。
Parabolic Wedge 后出现第一次、第二次、第三次向上反转。三根阴线后,许多多头会等第二入场买入,例如 Micro Double Bottom,或等收在高点的阳线。强空头趋势后的强小反转通常还会测试低点,之后可能形成 Higher Low Major Trend Reversal。图中它没有发展成多头趋势,但仍是合理买点。
这里的买入不是期待立刻大牛市,而是期待测试低点后的第二次反转。即使最终只形成交易区间或一段 swing,也仍可能是合理交易。
坏跟进暗示只是区间空头腿
Time: 30:23
图中低开,反弹失败形成 Double Top,空头在阴线下方卖。但后续很多 K 线下影线明显、跟进差:阴线后接 doji,阴线后接小阴线,成对阴线也有尾巴。这更像交易区间中的空头腿,而不是强空头趋势。
交易者会寻找反转。图中可看作 Wedge Bottom 或 Micro Double Bottom。第一买入信号是阴线,不好;第二入场也是 doji,仍不理想。许多多头会等收近高点的阳线上方买,而不是因为位置在区间底部就买任意阳线。
连续 Sell Climax 后等第二反转
Time: 31:25
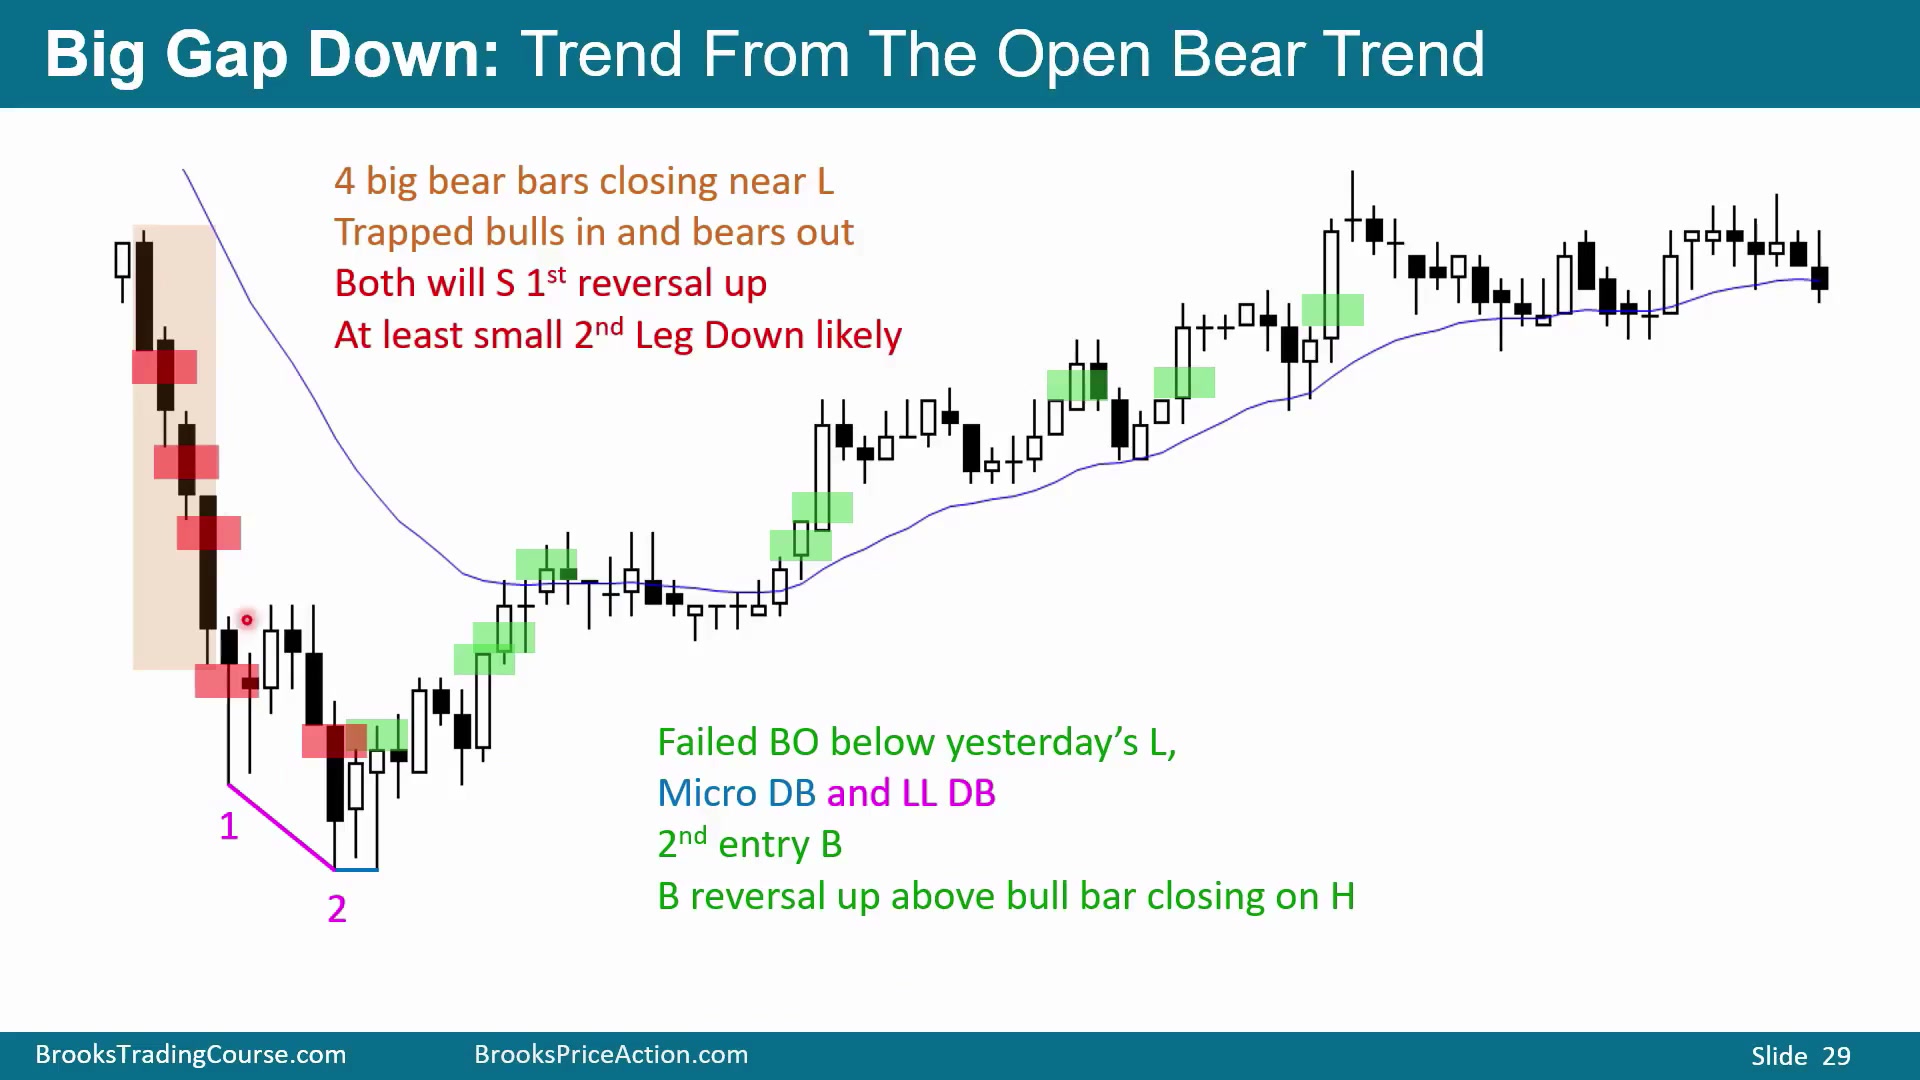
图中低开后下跌崩溃,空头在收近低点的阴线下方卖。四根大阴线收近低点后,至少再有一小段下跌的概率高,但下跌后也可能反转。
多数多头不会在四根强阴线后的第一次反转买入,而会等第二次反转,尤其是 Micro Double Bottom 后再买。图中既有小 Micro Double Bottom,也有更大的 Double Bottom,属于连续 Sell Climaxes 后的反转尝试。
多次卖出高潮和更大楔形底
Time: 32:10
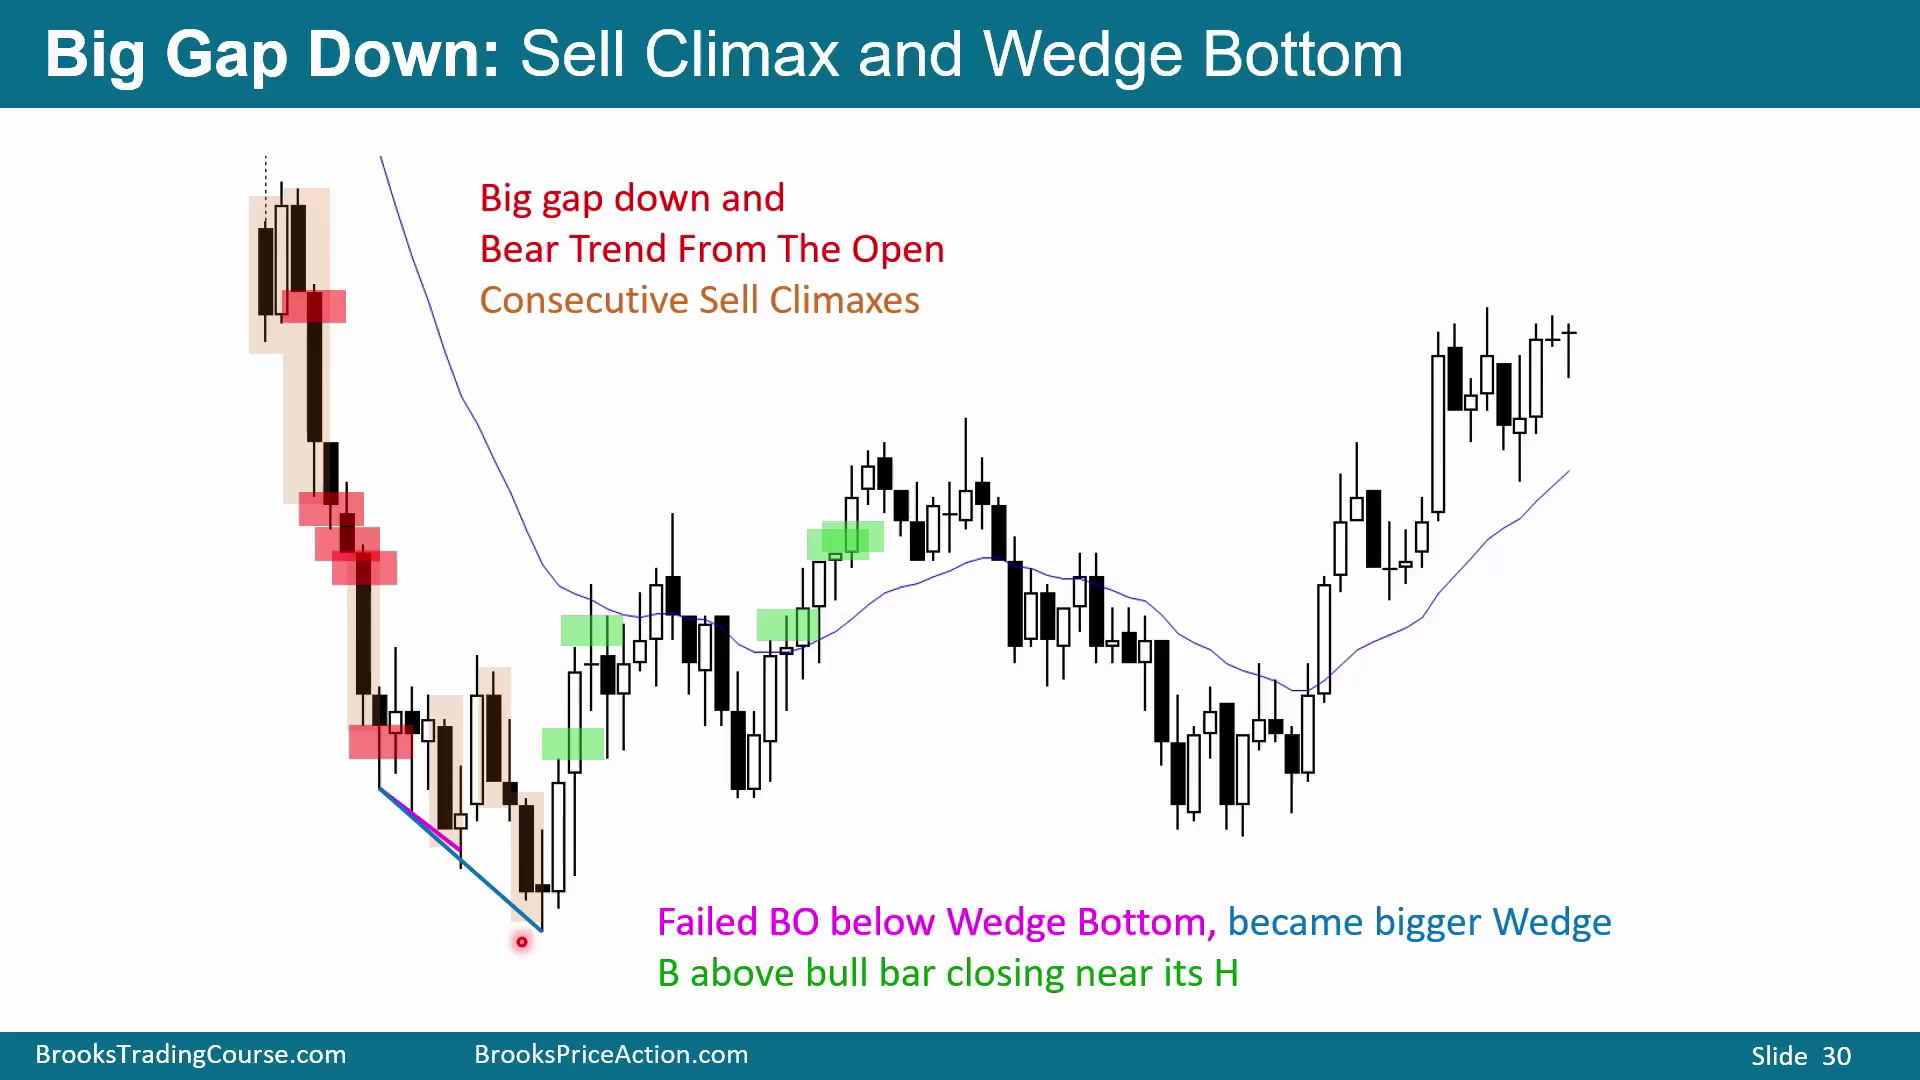
类似开盘下跌中,阴线收低,空头会卖。但当尾巴和 doji 增多,下跌动能减弱,这些是交易区间 K 线。市场可能结束空头趋势,转入交易区间,甚至反转成多头趋势。
图中有多次 Sell Climaxes。每根阴线或连续阴线都是卖出高潮;如果高潮多、跟进差、下影线多,就会吸引向上反转买入。小 Wedge 先形成,跌破后又发展成更大的 Wedge Bottom。买入重点仍是收近高点的阳线。
多次 Sell Climax 加坏跟进,会让空头逐渐减少追卖意愿。尾巴越多,越说明低位买盘正在吸收卖压。
第二腿空头突破失败后的 cup and handle
Time: 33:18
图中大幅低开并下跌,随后形成 Low 2 bear flag,做空合理。多头试图形成 bull flag 或 Higher Low bull flag,结果向下突破,形成两腿下跌。空头希望突破开启趋势,但它最终反转,所以是 second leg bear trap。
第一腿向下本来想形成 higher low,第二腿 Sell Climax 反转。后续可能成为多头趋势,也可能只是结束卖压并进入交易区间;无论哪种,都要找向上反转买入。强抛售后的剧烈反转会成为当天主导特征,价格很少再回到底部,之后更可能横盘或上涨。反转后接 bull flag,就是 cup and handle。
这个主导特征会改变当天预期:后面空头再想把价格压回低点,难度很大。多头既可以直接买反转,也可以等反转后的 handle。
强空头趋势第一反转通常小级别
Time: 34:50
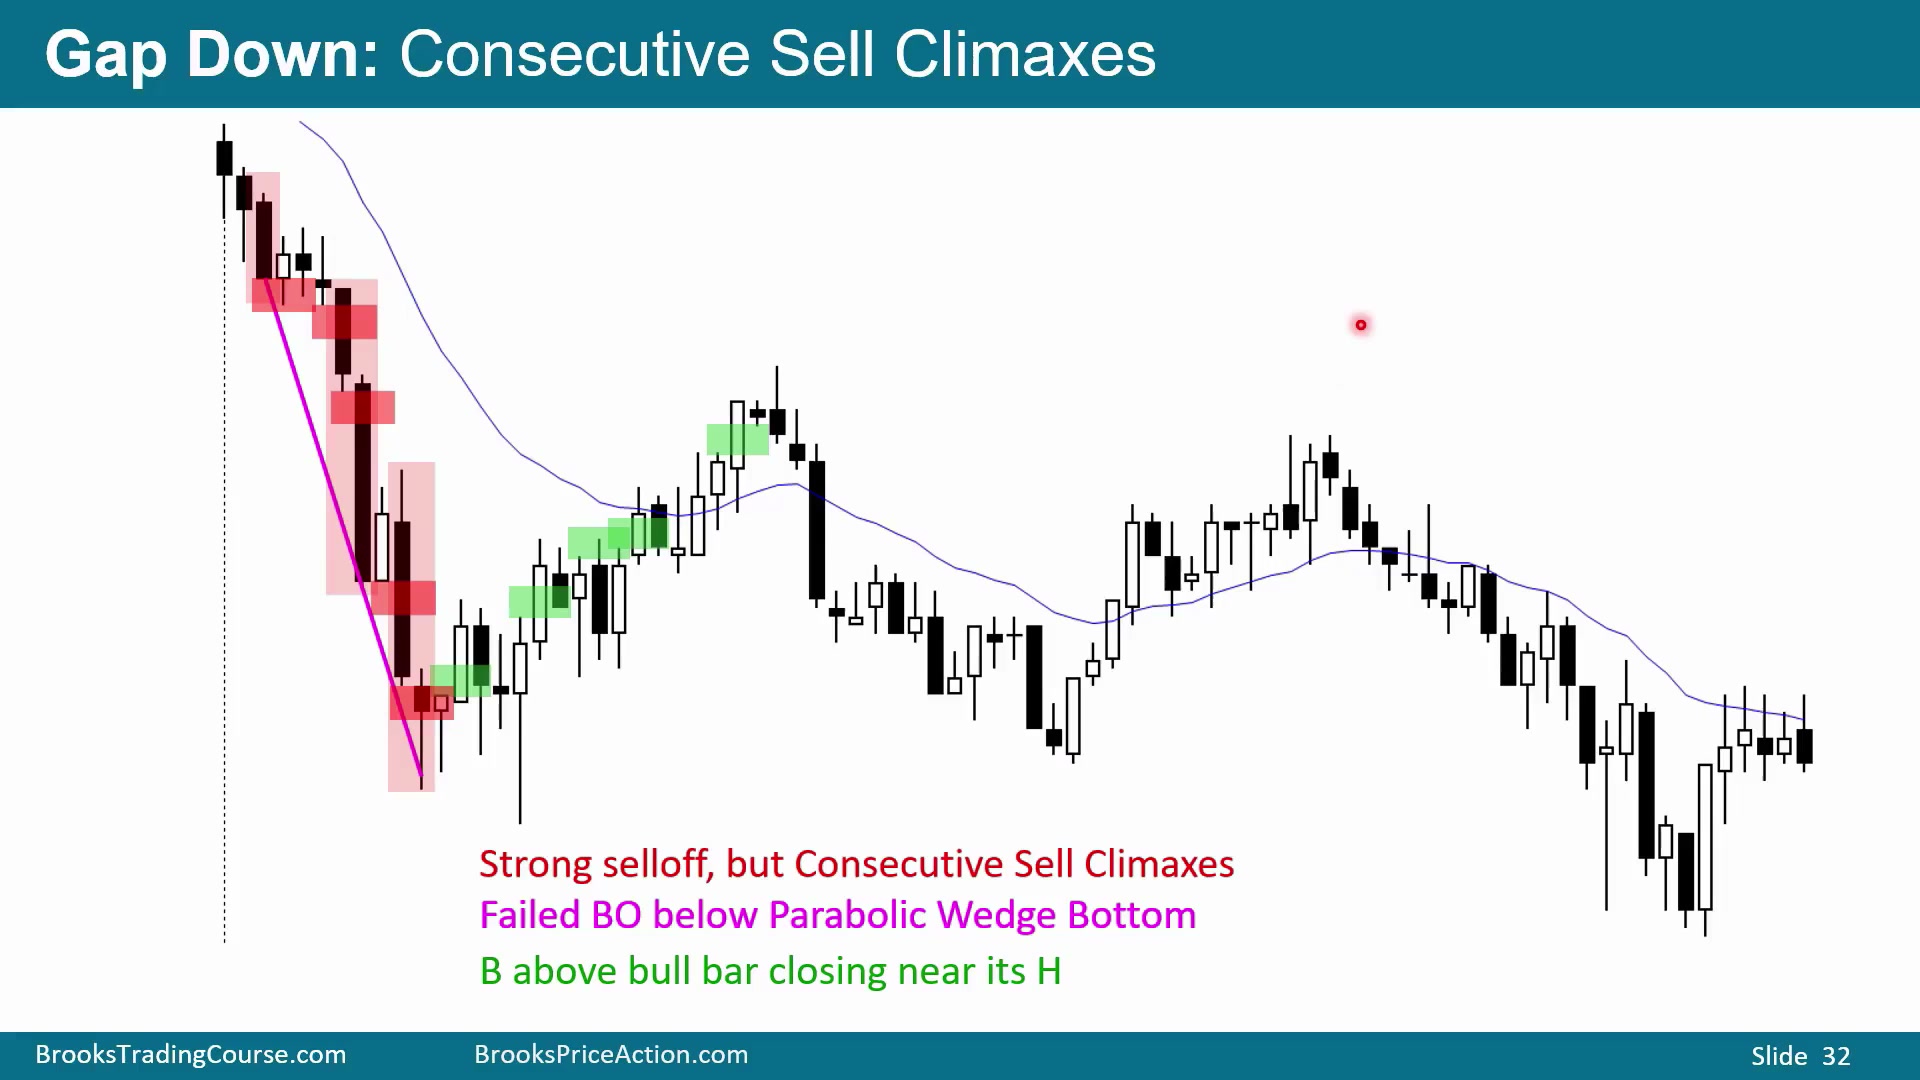
图中连续阴线让空头开始卖出,试图向下反转。两根大阴线后,至少再有一腿向下概率高;随后又有两根阴线,买入信号弱,不足以反转前面大阴线。空头仍可能再得到一腿。
之后三推向下形成 Parabolic Wedge,并跌破后强力向上反转。多头会在阳线上方买。强空头趋势后的第一次向上反转通常小级别,可能够 swing,但通常还需要一次向下测试才可能 major reversal。图中后面形成 Higher Low Major Trend Reversal,却没有转成多头趋势,最终 Double Top bear flag 后创新低。
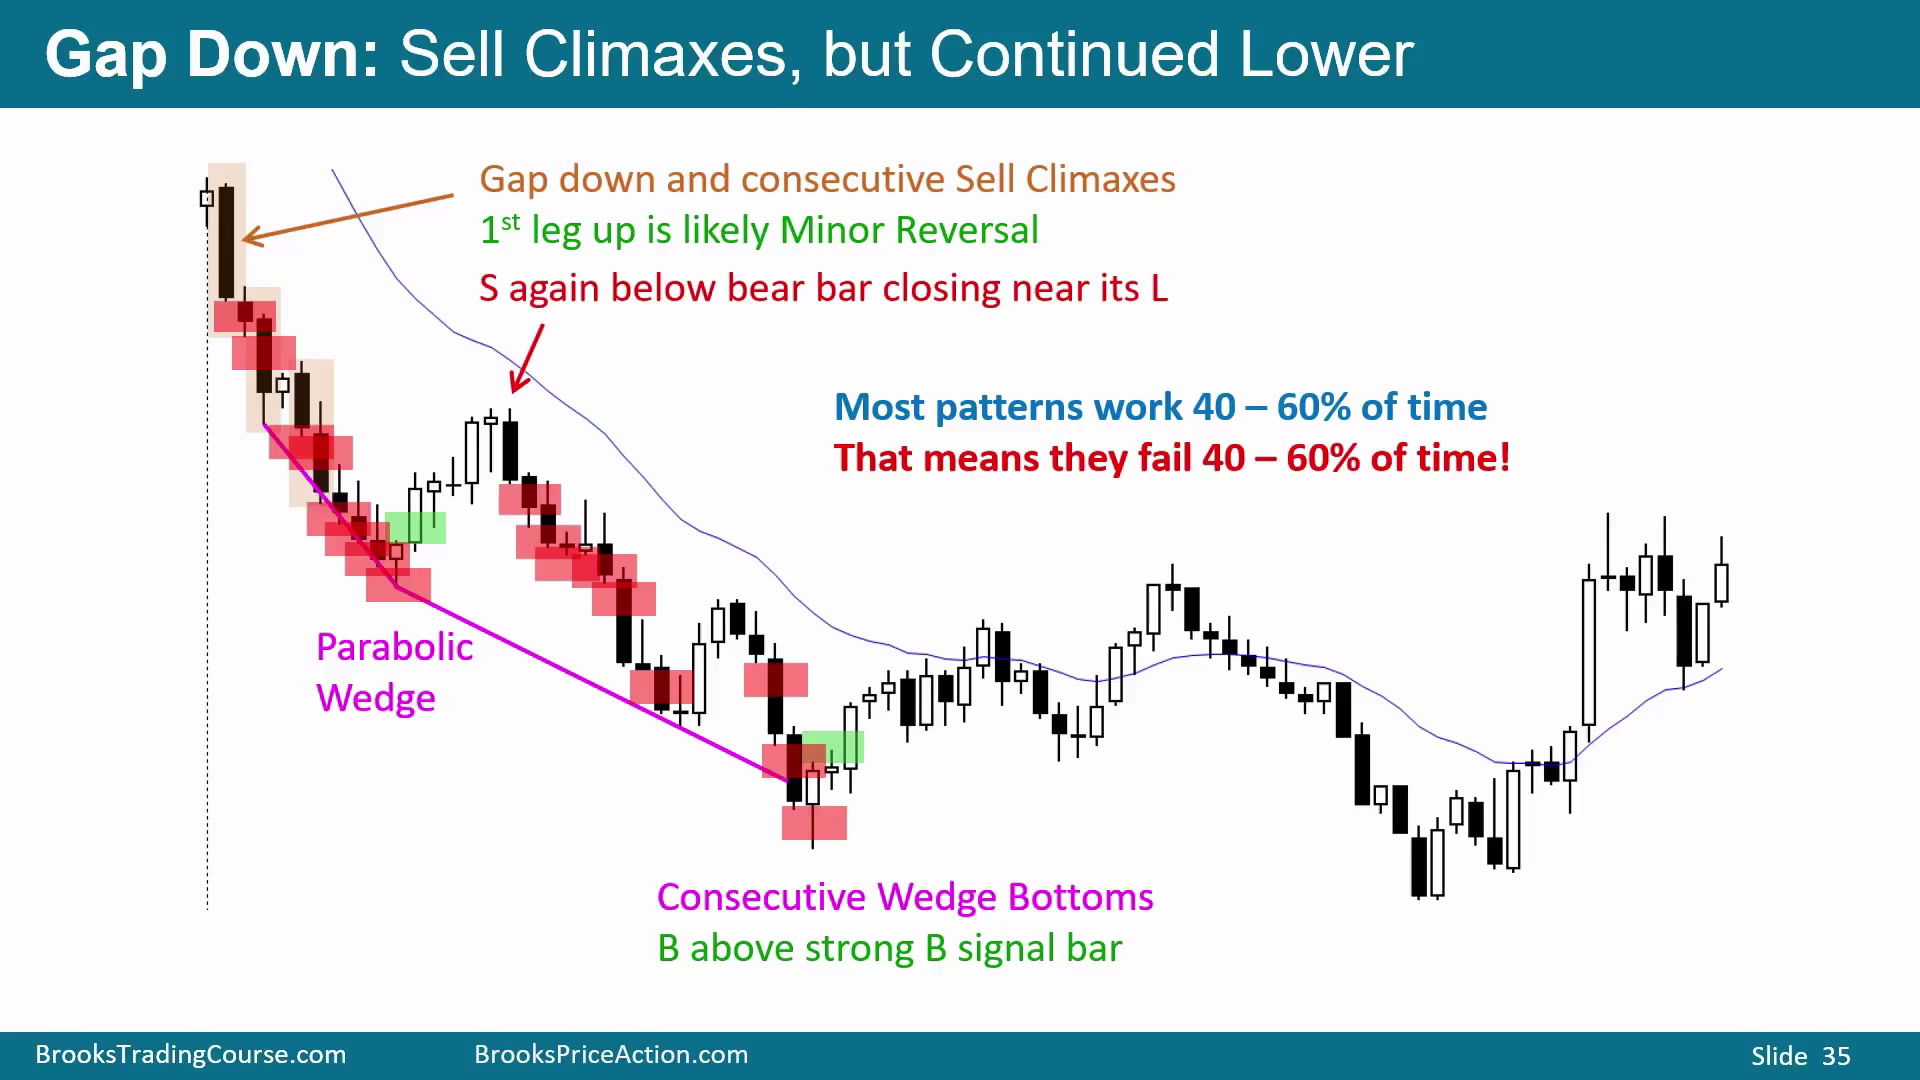
Sell Climax 反转成为主导特征
Time: 36:00
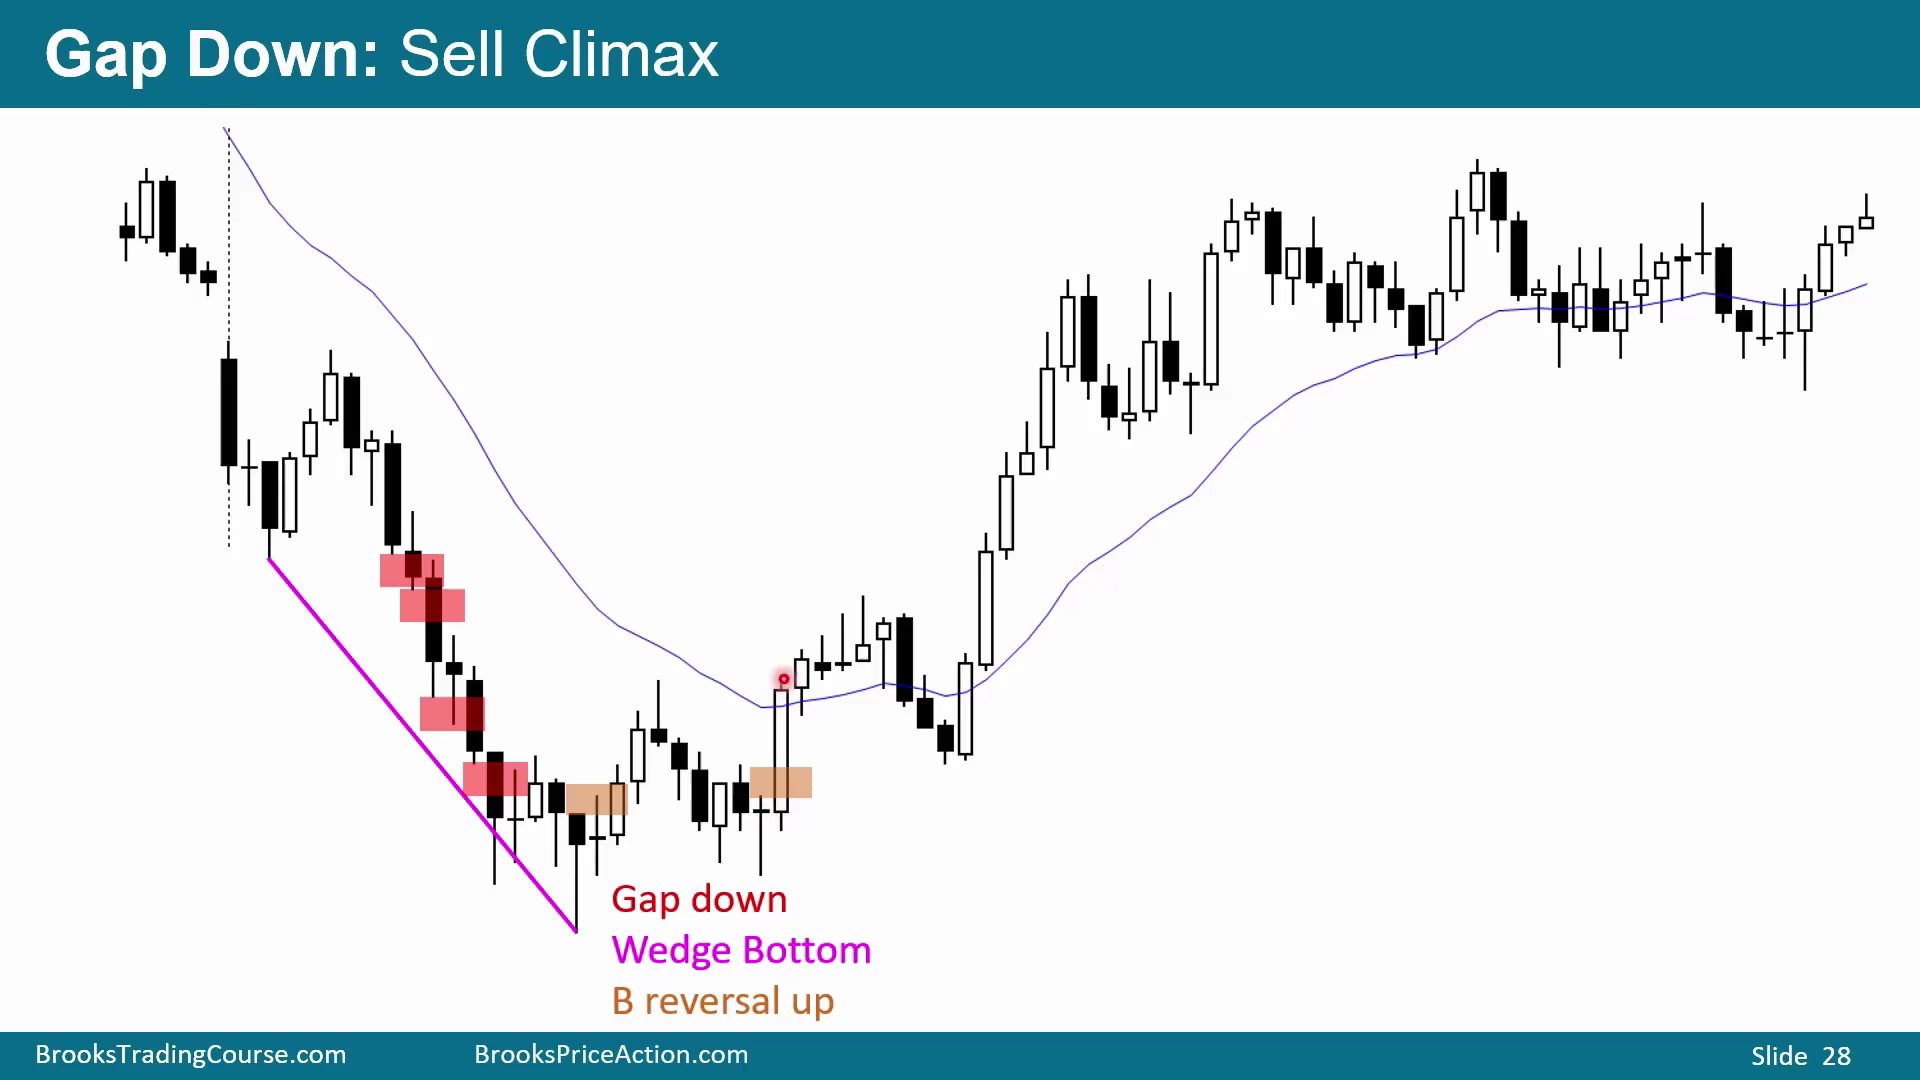
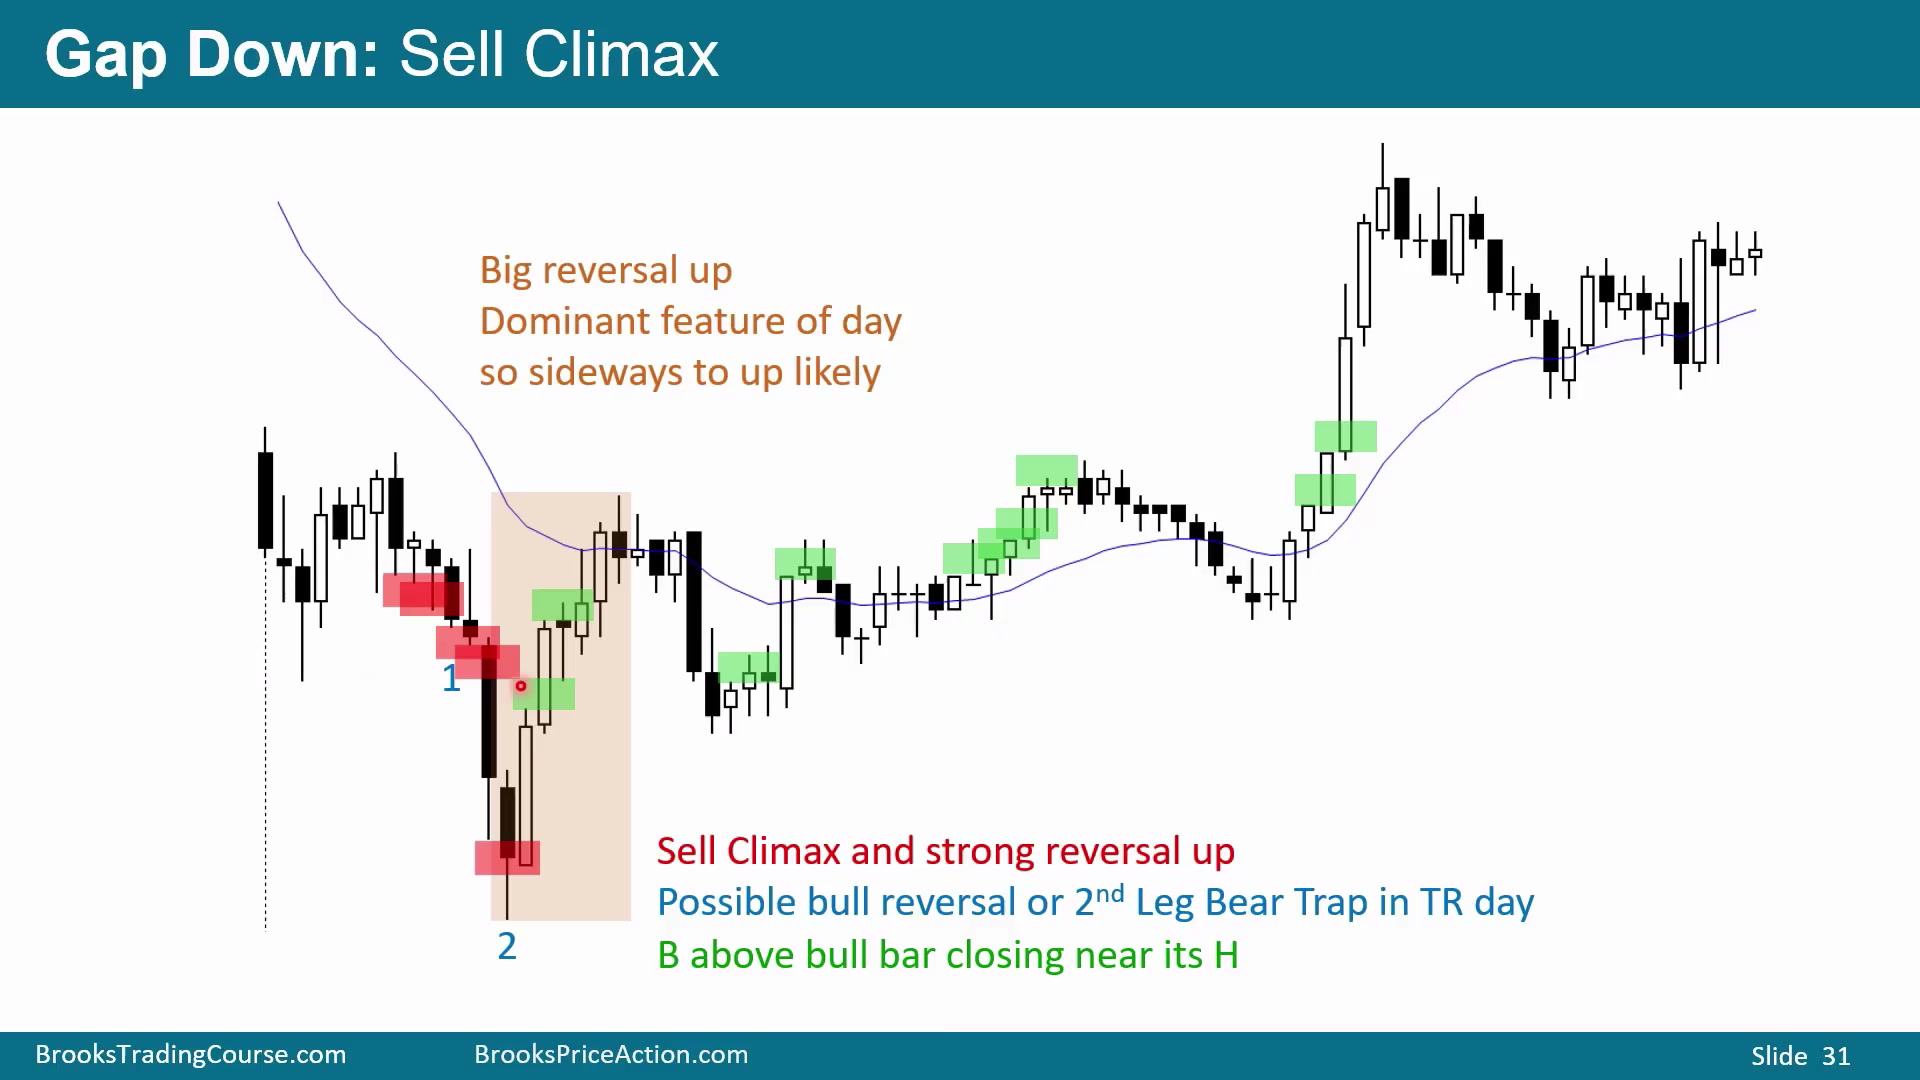
图中低开后先以 Wedge rally 到均线,空头趋势恢复并连续下跌。随后下跌在 Sell Climax 中崩溃,再次向上反转。前半段是 Wedge bear flag 和从均线向下的 opening reversal,后半段形成 Double Bottom。
Sell Climax 后的双底可能成为当天低点。交易者既会做空前面的楔形旗形,也会做多后面的强反转。多头可以第一根阳线买;前面有三根阴线时,也可以等第二或第三根阳线。剧烈下跌后的漂亮反转是主导特征,之后更可能横盘或上涨。
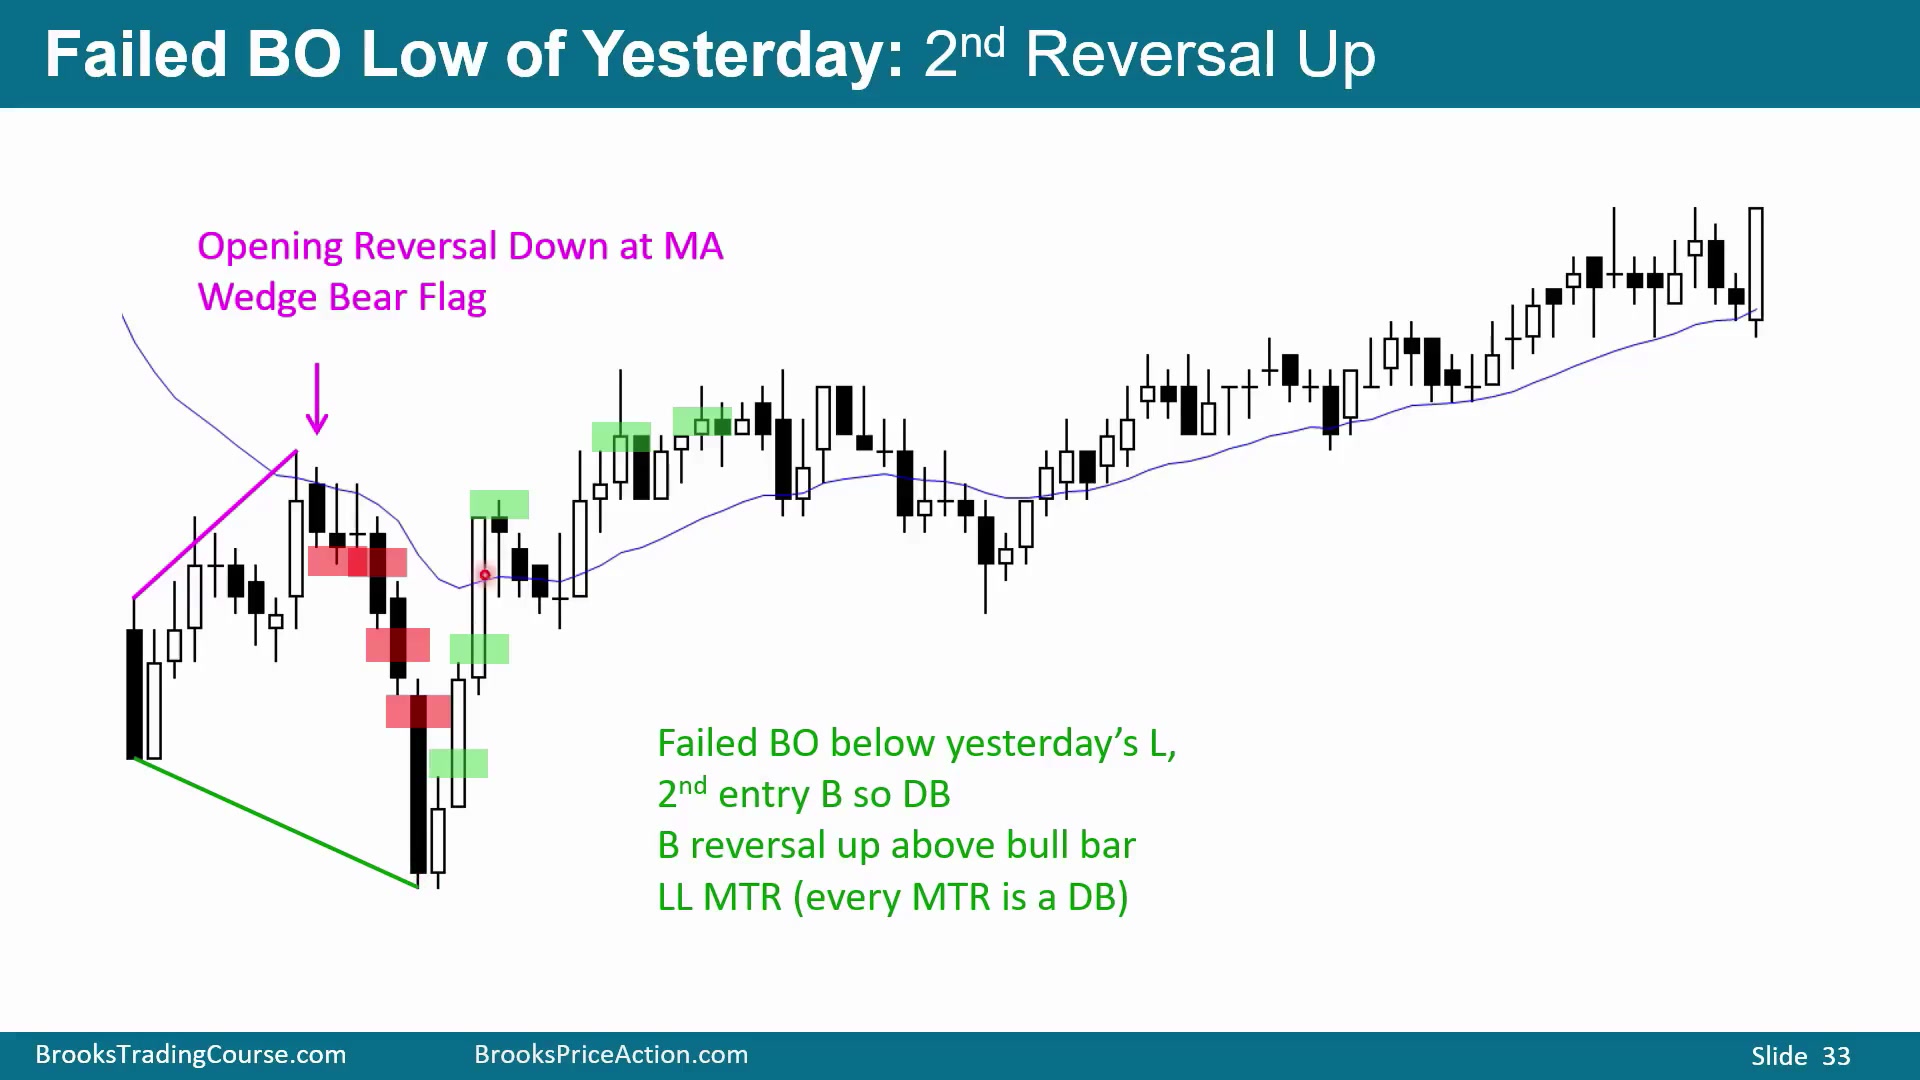
反转失败成为空头旗形
Time: 37:12
强开盘抛售后,多头试图向上反转,但反转没有成功,变成 bear flag,空头趋势恢复。连续 Sell Climaxes 后,第一次向上反转通常小级别。图中多头希望第二次反转形成 Double Bottom 或 Parabolic Wedge,但买入后的 follow-through 差:买入信号不大、入场 K 线不大、多头突破也不大。
这样的上涨更像交易区间腿或空头旗形,空头会在收近低点的阴线下方卖。后面又形成更大的 Wedge Bottom 和连续楔形底,漂亮买入信号出现后可期待两腿上涨。但这里上涨只走了两腿,没有转成多头趋势,随后创新低。多数形态只有 40% 到 60% 成功率,因此看到任何形态都要准备其失败后的反向交易。
失败的线索是 bad follow-through:买入信号 K 线不大、入场 K 线不大,突破也不大。多头没有连续强阳线,空头就能把反弹当成 bear flag 继续卖。
后面的 consecutive Wedge Bottoms 说明卖压在反复高潮化。即使一个楔形失败,另一个更大楔形加漂亮买入信号仍可能带来两腿上涨;但两腿上涨不等于趋势反转成功,之后仍可能创新低。
四类开盘形态的复盘
Time: 39:40
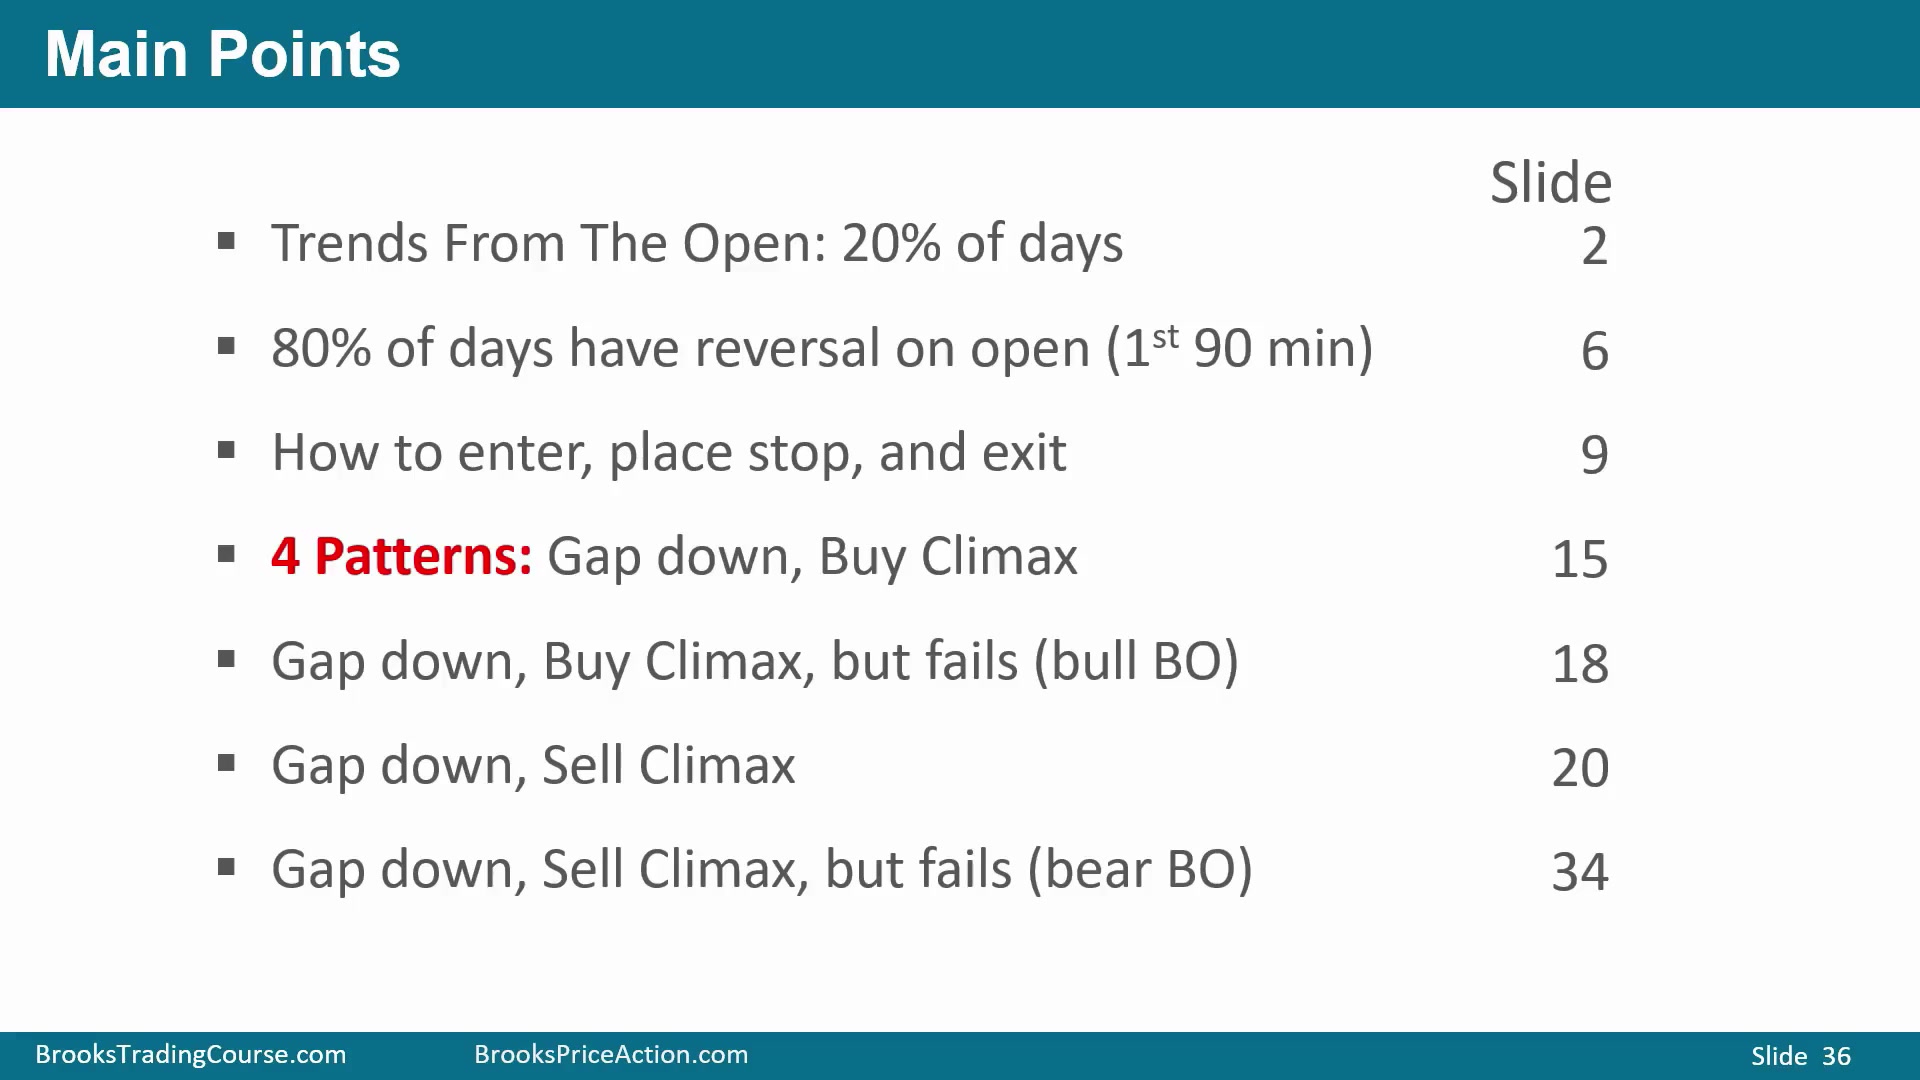
从开盘持续到收盘的强趋势大约一周一次。约 80% 的交易日会在第一小时到一个半小时内形成某种开盘反转。交易开盘形态时,进场通常用 stop,保护性止损放在整个反转结构另一端,离场根据反向强信号或趋势结束迹象。
四个版本分别是:低开后 Buy Climax 并向下反转;低开后 Buy Climax 尝试反转,但失败成为 bull flag 并恢复上涨;低开后 selloff 成为 Sell Climax 并向上反转;低开后 selloff 尝试向上反转,但变成 bear flag,空头趋势恢复。每个版本都要同时看左侧背景、昨天高低点、均线、支撑阻力、信号 K 线质量和后续跟进。