al-brooks-course
49F - Swing Trading Examples
Readable self-study lecture notes for 49F - Swing Trading Examples.
Source Media
更高周期背景给日内 swing 提供方向
Time: 00:11
这是 swing trading 案例六节课中的最后一节,重点放在更高周期如何给日内交易者提供 swing 设置。日线如果处于 Buy The Close 多头趋势或 Sell The Close 空头趋势,低周期图上经常会出现相应的日内交易机会。比如日线处在 Buy The Close 多头趋势时,当天早盘常有小抛售,随后余下时间变成多头趋势日;日内交易者应该寻找这个小抛售后的向上反转买入。
如果日线处于强趋势,例如没有回调的 micro channel,交易者会在第一次回调入场。空头 micro channel 中,如果连续 4、5、6 根 K 线没有回调,第一次涨到前一日高点上方时,交易者会寻找卖出机会。日内交易者可以在 5 分钟图或 60 分钟图上寻找向下反转;市场突破昨日高点后反转,就要考虑卖出,因为空头趋势恢复的概率高。
日线处于交易区间时,顶部附近常会出现大多头趋势 K 线。不要把它自动当成 Buy The Close;应假设这次上涨会失败,并寻找向下反转卖出。相反,交易区间底部附近的大空头 K 线也不应自动当成 Sell The Close;如果低周期早盘出现向上反转,往往是好的 swing 买点。最后,如果日线或 60 分钟图上有支撑/阻力,低周期在该支撑/阻力处出现反转,也经常提供好的 swing trade。
日线 Buy The Close 趋势中的早盘抛售
Time: 02:01
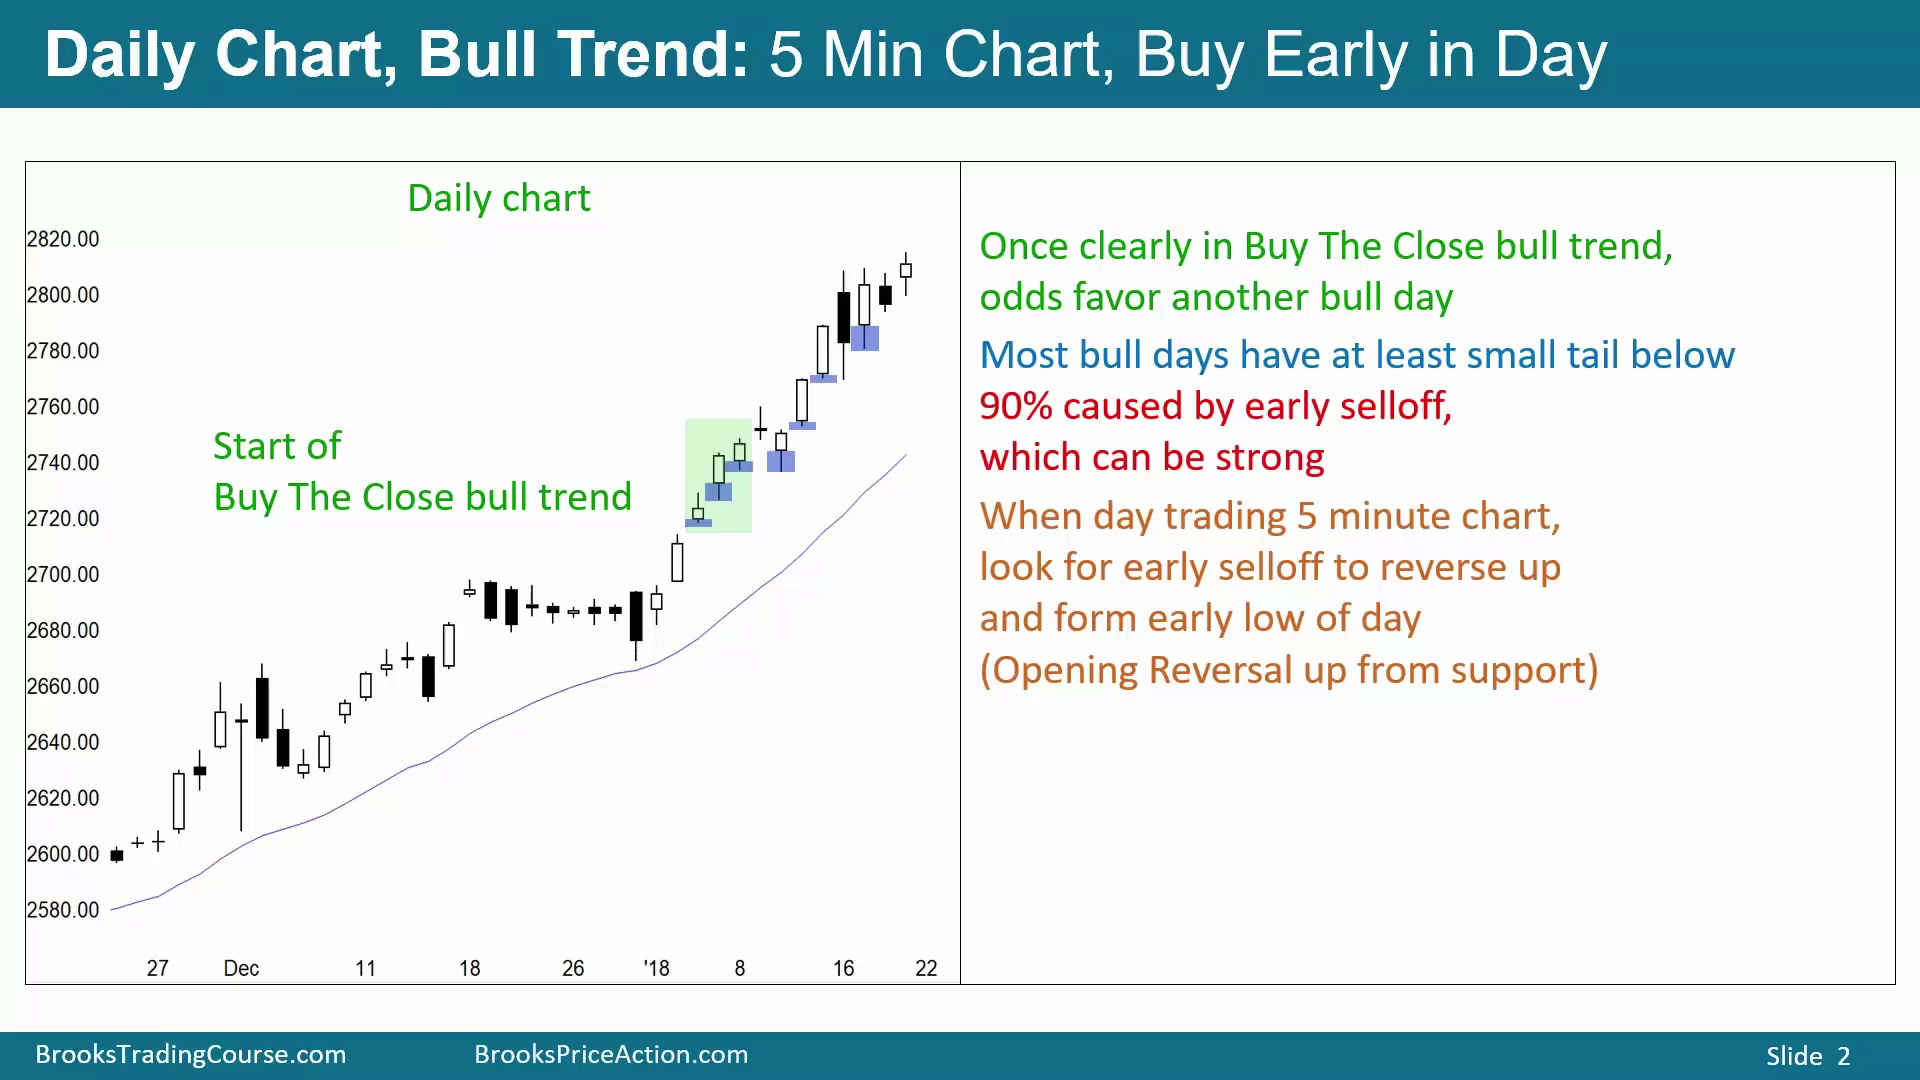
图中日线处于强多头趋势。到第三、第四或第五根 K 线时,就必须判断市场处在 Buy The Close 多头趋势中,意思是买入收盘大概率能赚钱。
即使日线有强多头趋势和一系列强多头 K 线,多头 K 线底部通常仍会有下影线。90% 情况下,这个下影线来自当天早盘的抛售;只有约 10% 情况下,下影线来自当天后段的下跌。日内交易者如果在 5 分钟图交易,并知道高周期处在 Buy The Close 多头趋势,就应该寻找早盘抛售后的向上反转,作为可能的 swing trade。基本假设是每天都会更高,因此每天都可能成为多头趋势日;交易计划就是等待早盘抛售失败并向上反转。
第一天:5分钟图中的早盘低点买入
Time: 03:15
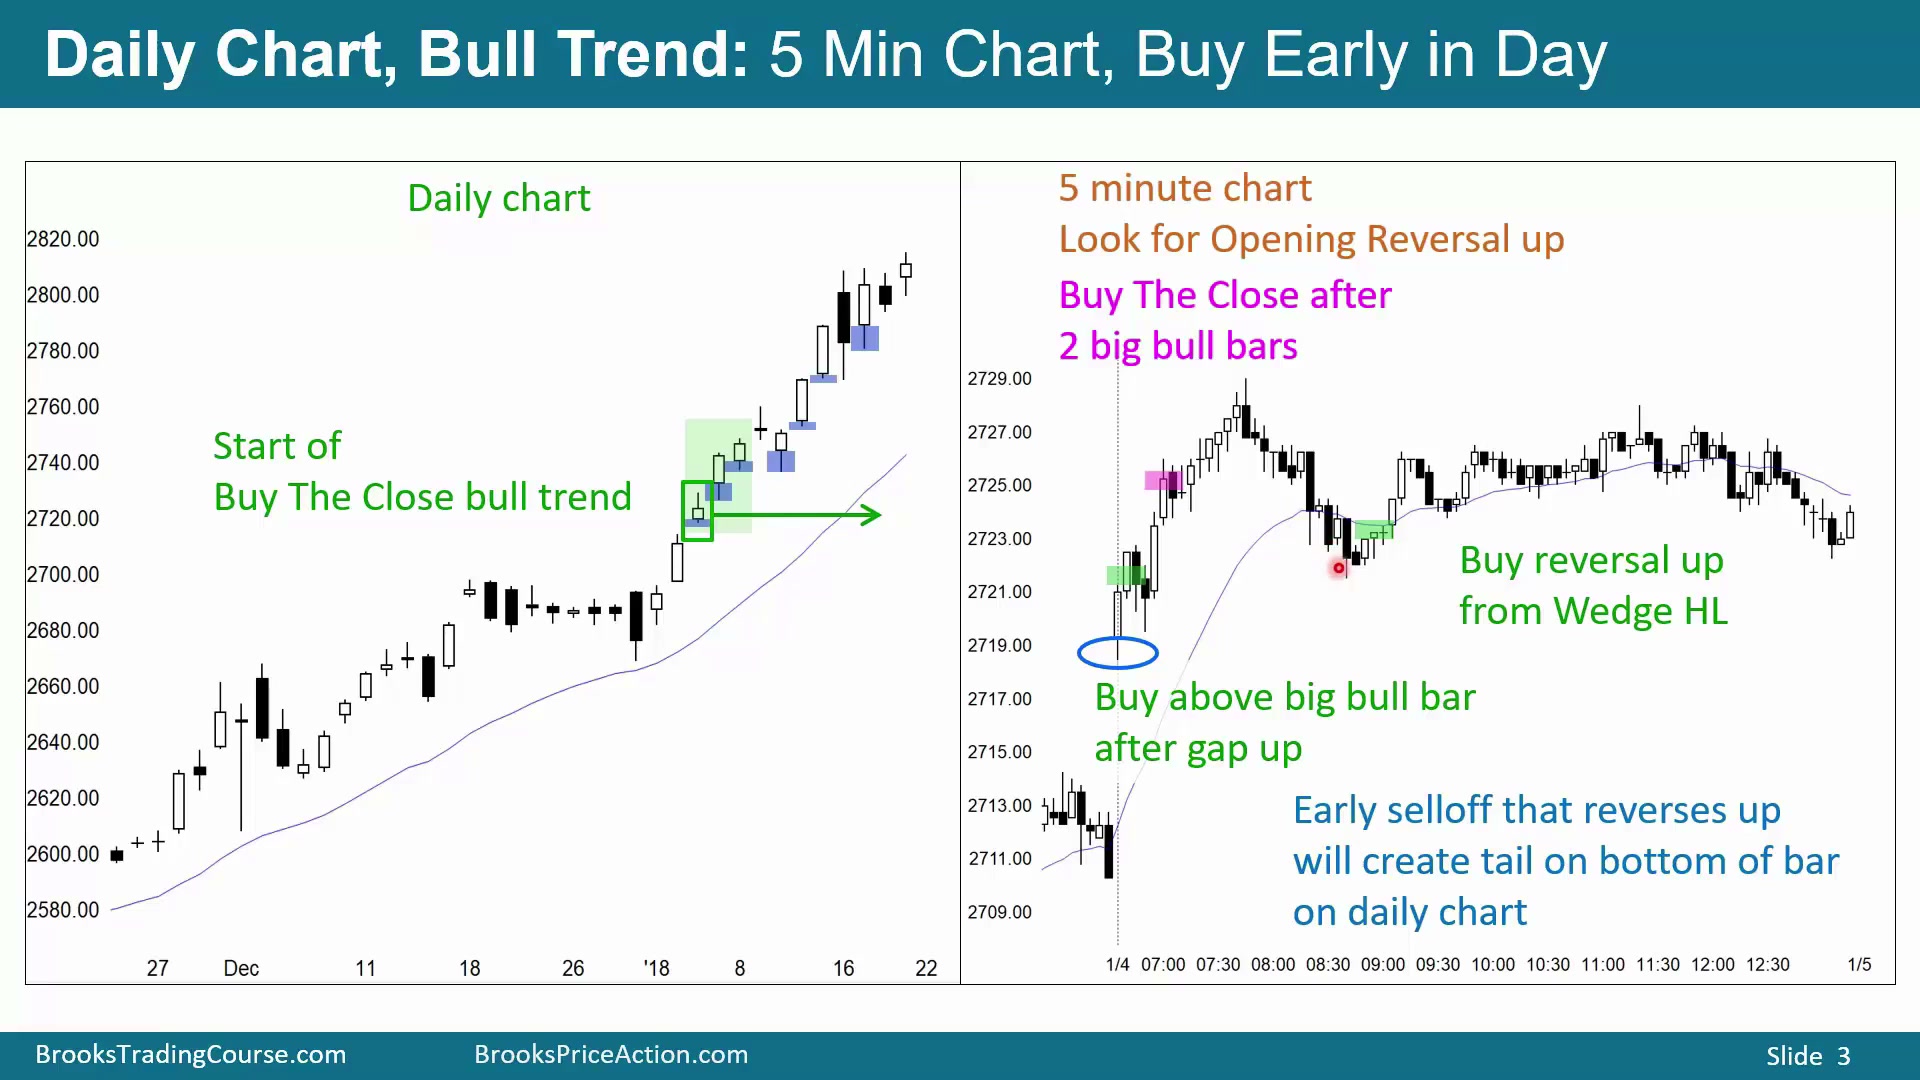
图中是对应日线当天的 5 分钟图。由于预期日线是多头趋势日,日内也应预期早盘形成当日低点。图中开盘后下跌到当日低点并向上反转,这就在日线 K 线底部留下小下影线。
当 5 分钟图出现收在高位的多头 K 线时,可以在其高点上方买入;也可以等连续多头收盘后买入收盘。图中后面又出现一组连续收盘,可以买那个收盘,或等待回调买入。回调中有三次下推,一、回调、二、回调、三,构成 wedge bull flag;在多头 K 线上方买入,是押注当天会成为多头日、收在开盘价上方,甚至成为大多头趋势日。实际结果只是小多头趋势日,收盘只略高于开盘,但交易逻辑仍成立。
关键来自日线背景:日线多头趋势已经持续很多根 K 线,并可能进入 Buy The Close 多头趋势。第三根日线时已经可疑,第四根时就很清楚,继续上涨概率高。图中跳空高开并出现收在高位附近的多头 K 线,在其高点上方买入合理,押注又是多头趋势日。更高概率的做法,是等待两根连续强多头 K 线的收盘再买。偏好回调买入的交易者,可以在回调到均线略下方、形成三推 wedge bull flag 后,在多头 K 线上方买入寻找向上 swing。
第二天:均线支撑上的 opening reversal
Time: 05:05
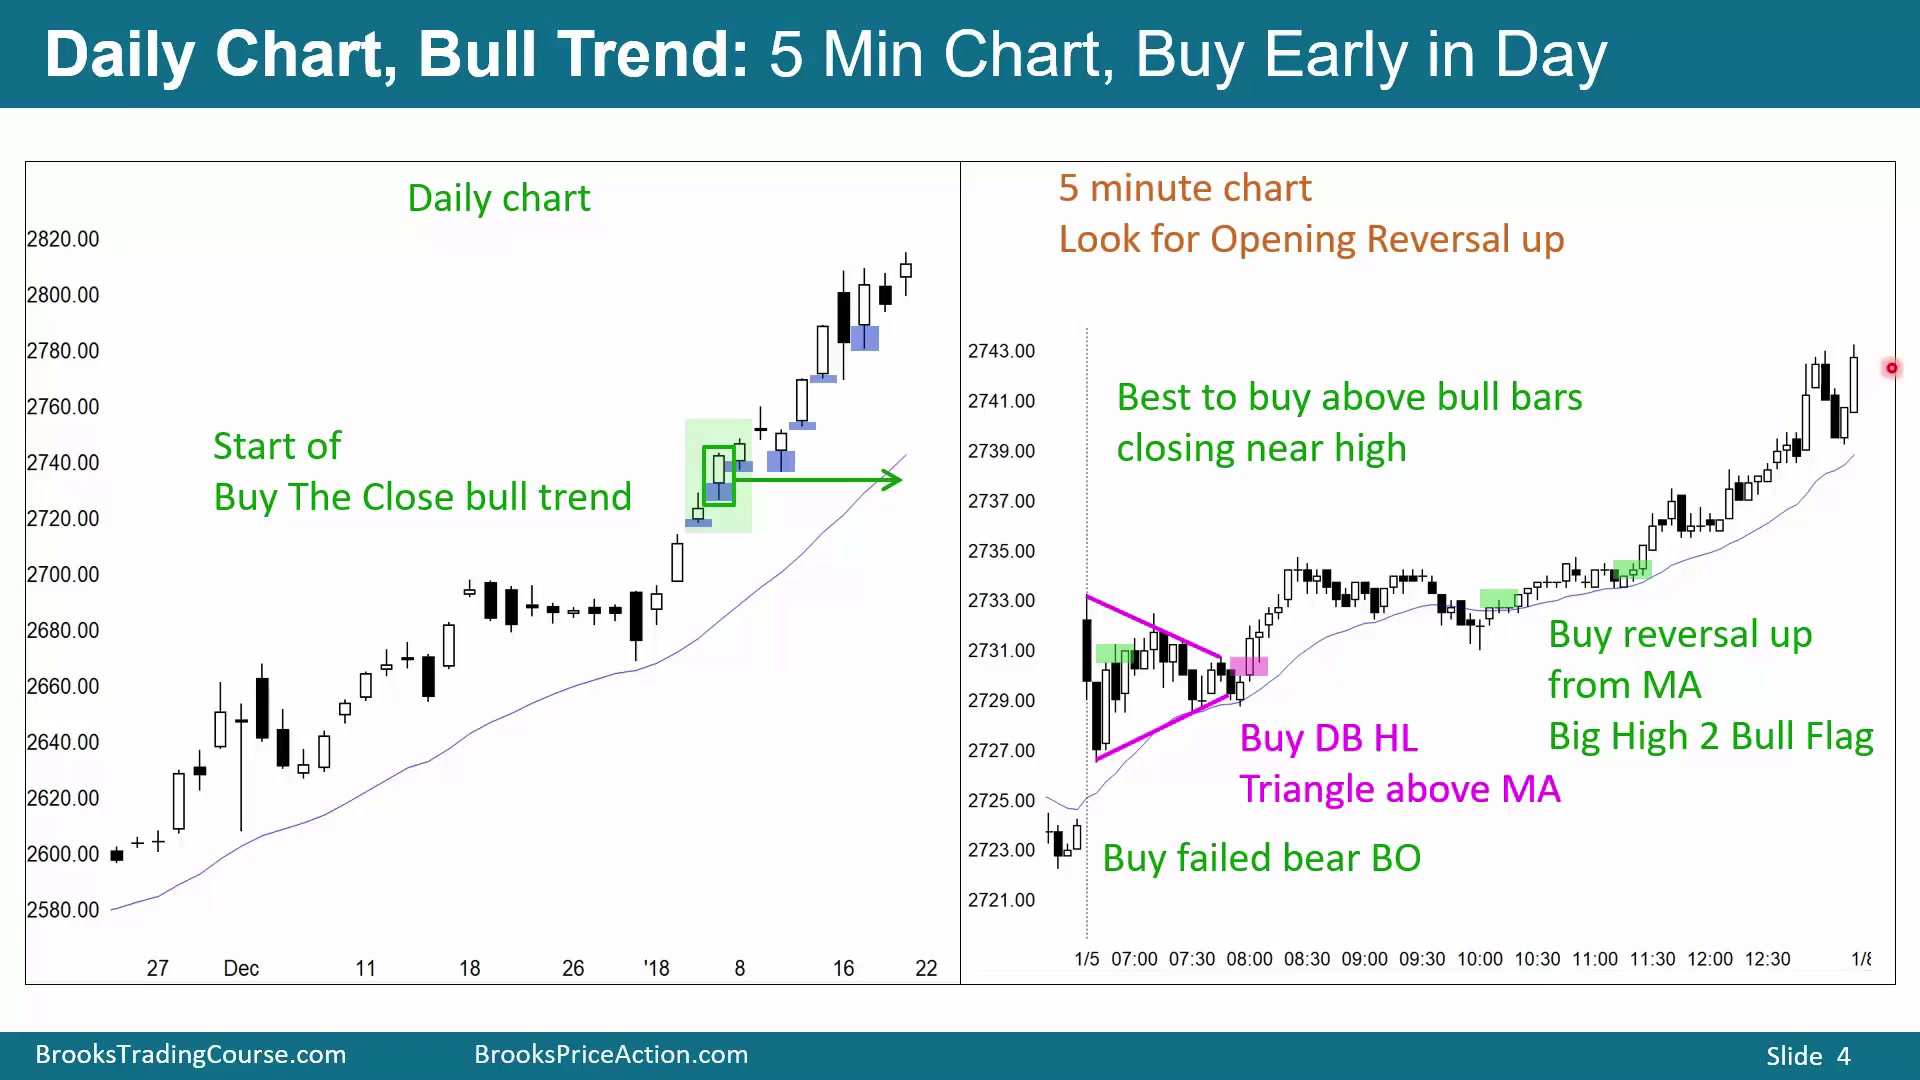
图中绿色框是第二天。日线已经有三根连续多头 K 线和突破,因此这一天很可能又是多头日。若早盘出现抛售,它更可能失败并引出多头日;图中结果是大多头趋势日。
早盘虽然有连续大空头 K 线,但价格仍在均线上方,也仍在昨日收盘上方。图中出现一根好看的多头 K 线,可以在其高点上方用止损单买入;也可以等价格更接近均线,再在好看的多头 K 线上方买入。后者形成收在高位的多头 K 线、均线处 double bottom,实际上也是 triangle:lower high 与 higher low 同时存在,所有反转都发生在均线上方,并且很多多头 K 线收在高位或接近高位,买压很好。因此当天大概率是多头趋势日。
买入时最好在强多头趋势 K 线上方入场。即使早盘抛售强,由于更高周期背景强,市场很可能在支撑处形成 opening reversal up,通常是在均线附近:有时在均线上方,有时正好在均线处。也可以在之后回调到均线并向上反转时继续买入,押注 5 分钟图和日线图的多头趋势都将继续。
第三天:反复早盘抛售失败
Time: 06:50
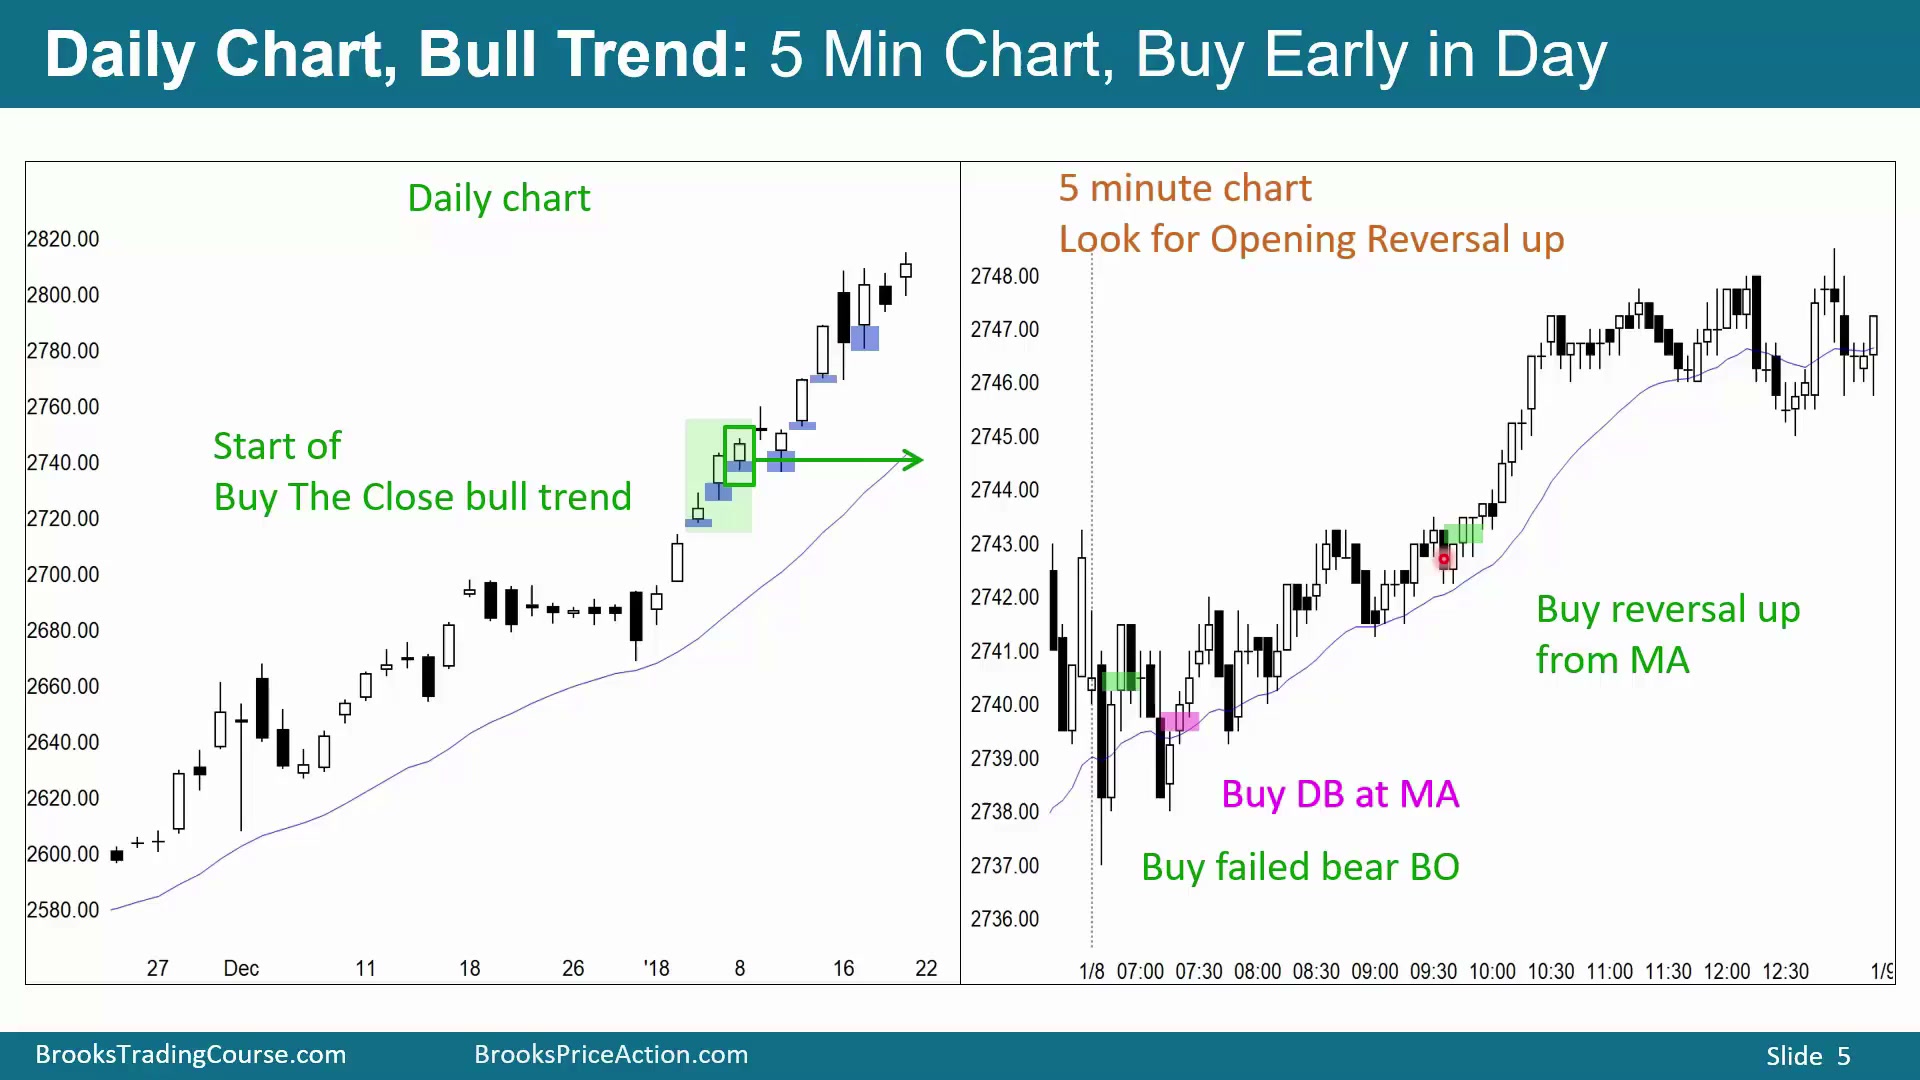
这是绿色框中的第三天,也是 Buy The Close 市场中的第五天。市场开盘反复尝试强烈抛售,但每次都在均线处找到支撑,并强烈向上反转。可以把它叫 triangle、double bottom,或 double bottom 后的回调,名称不重要;关键是强抛售后持续出现强向上反转。
开盘时,强上涨或强下跌有 50% 概率会反转。因此即使看到图中这些强抛售,也要记住它们有 50% 概率失败。更重要的是,市场不断从均线处向上反转,而日线背景已经是 Buy The Close 多头趋势;这种背景下经常早盘先跌,随后上涨。图中从开盘开始反复抛售,仍应假设市场会继续向上反转,并收在当日开盘价上方。实际当天是不错的多头趋势日。
图中空头突破失败后强力反转,并形成 High 2:前一天有 High 1,今天在均线处形成 High 2,可能是当日低点,且实际之后一直保持为当日低点。后面又在均线处形成 double bottom 和好看的买入信号 K 线。当天可以反复买入均线回调后的向上反转。
日线 Sell The Close 空头趋势中的早盘反弹
Time: 08:26
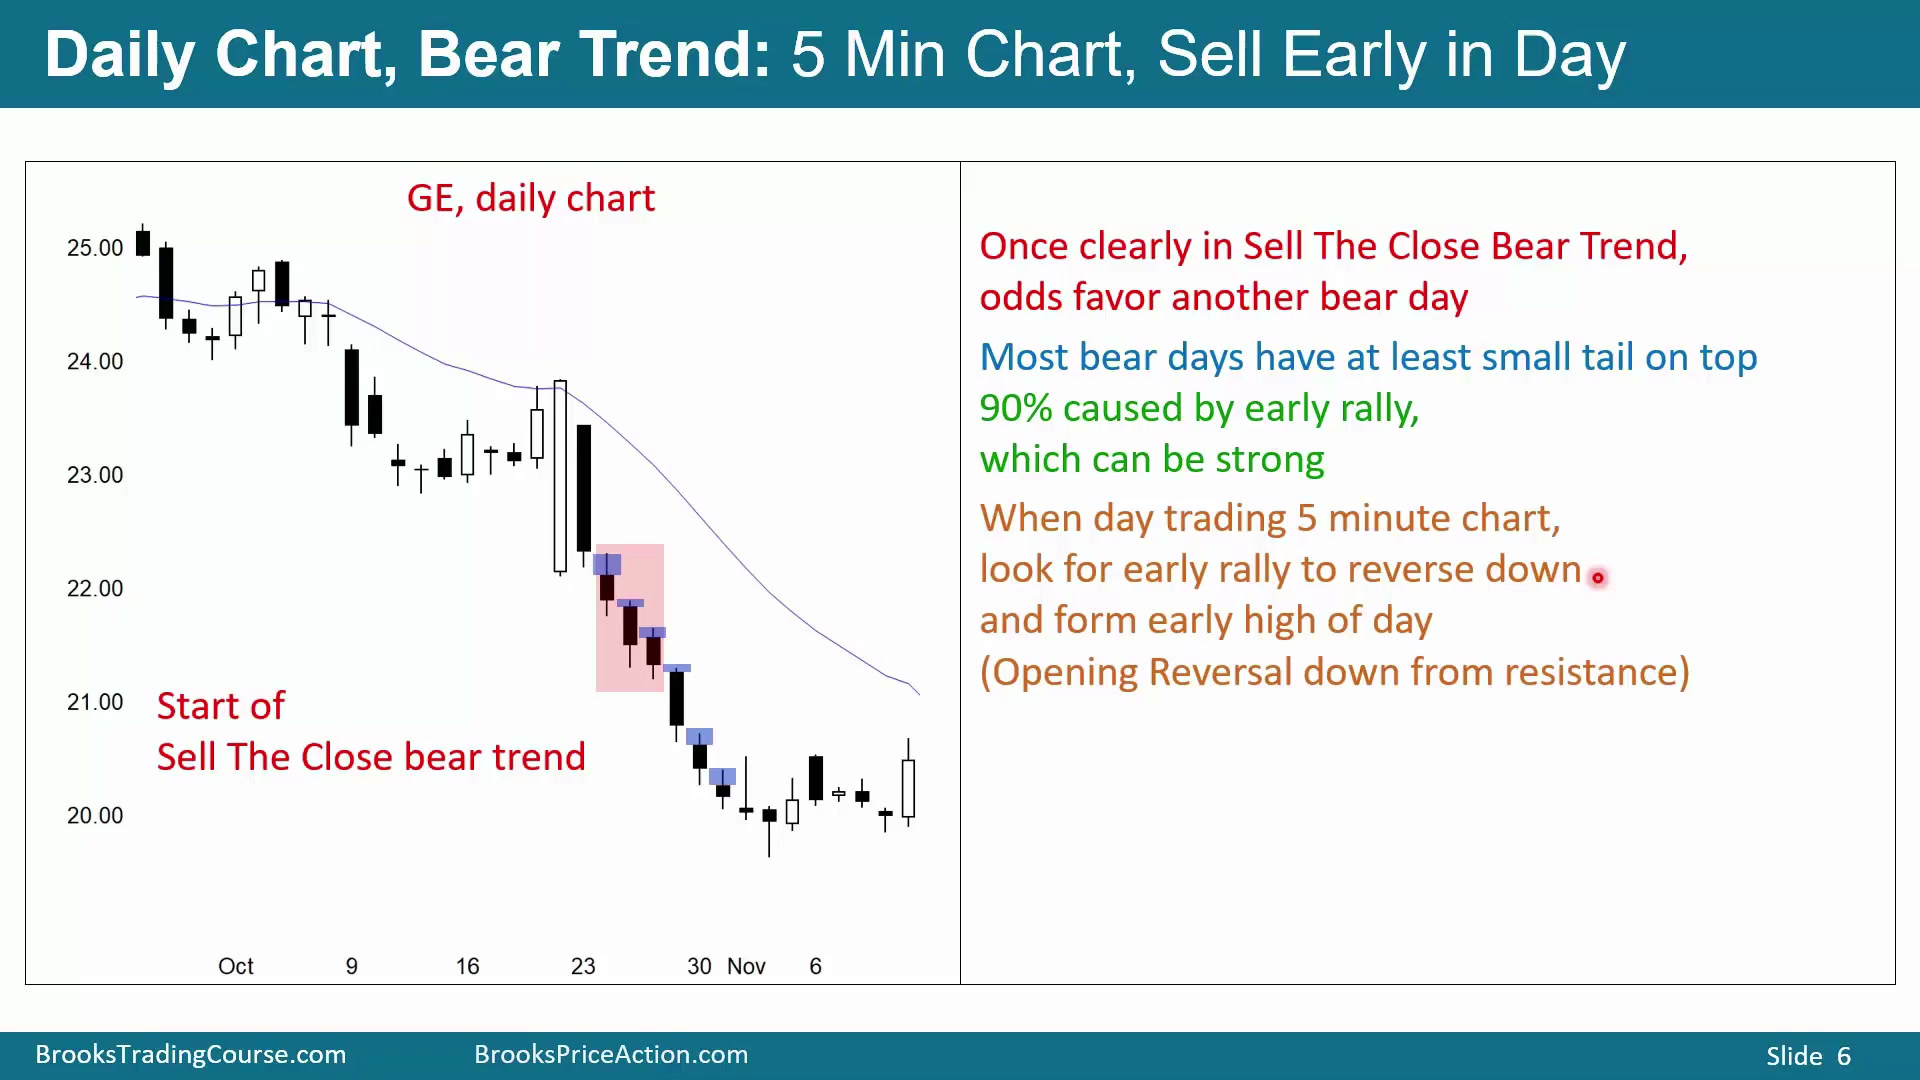
Sell The Close 空头趋势中的逻辑正好相反。日线空头 K 线上方常有上影线,90% 情况下是当天早盘反弹后向下反转造成的。图中是 General Electric 日线。在某个阶段必须判断市场进入 Sell The Close 空头趋势;多头尝试向上反转,空头在均线处卖出,随后趋势强烈恢复向下。
即使是强空头趋势日,每根空头 K 线上方通常也会有上影线。90% 情况下,这来自早盘反弹后向下反转,也就是 opening reversal down;10% 情况下,即使当天收在低位,上影线也可能来自当天后段反弹。日内交易者如果在 5 分钟等小周期交易,应寻找早盘反弹,预期它向下反转,并形成余下时间的向下 swing trade。
第一天:测试昨日收盘和均线后做空
Time: 09:45
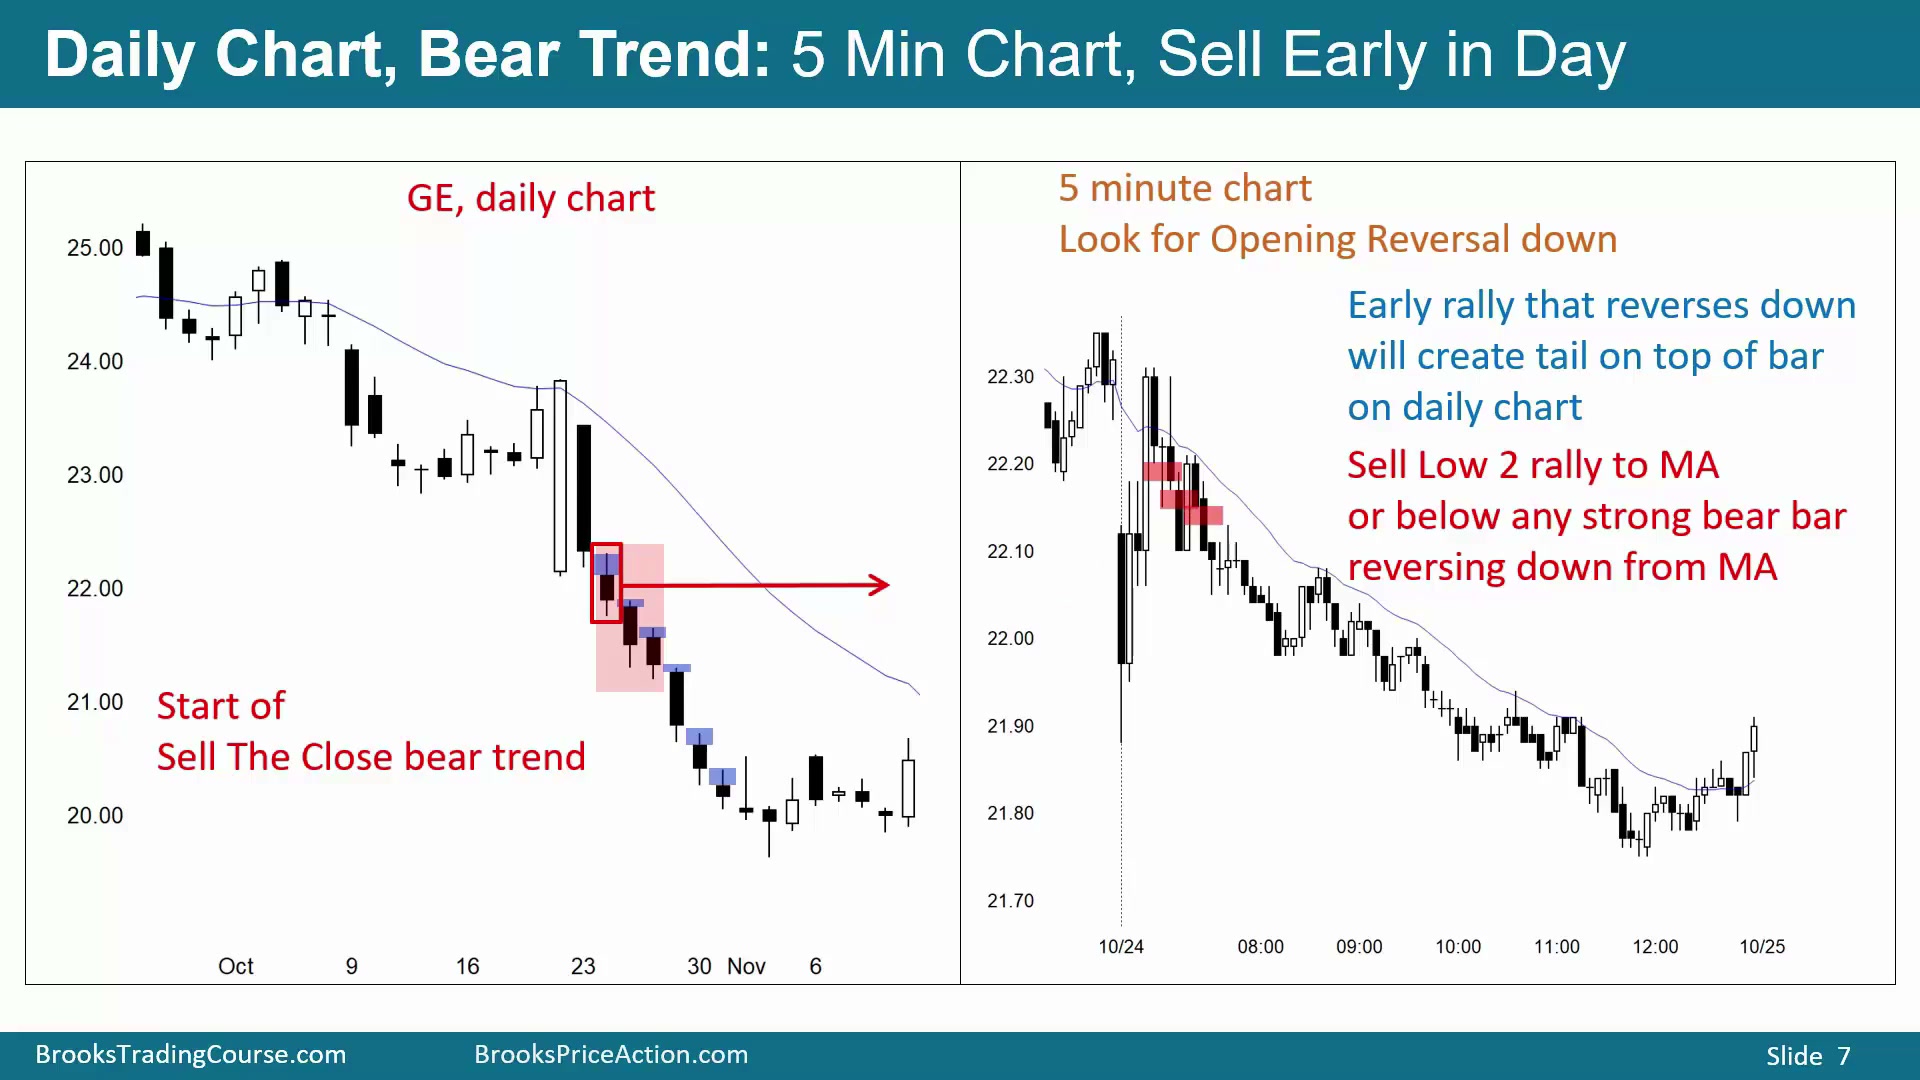
图中是该 Sell The Close 序列中的第一天。多头开盘有两根很大的多头趋势 K 线,但它们只是测试昨日收盘价和均线。随后出现一根收在低位的好空头 K 线,可以在其低点下方卖出;后面又形成 micro double top,也可以在相关空头 K 线下方卖出,或在任何测试均线的空头 K 线下方卖出。
由于日线处于强空头趋势,并开始形成 Sell The Close 空头趋势,这些空头更可能成功。必须假设每天会收在开盘价下方,并且当天某个时刻会出现向下 swing。因此要卖出反弹,尤其是早盘反弹。更好的入场是卖出空头 K 线下方,特别是在均线附近、且收在均线下方的空头 K 线。
第二天:强开盘走势仍有50%反转概率
Time: 10:55
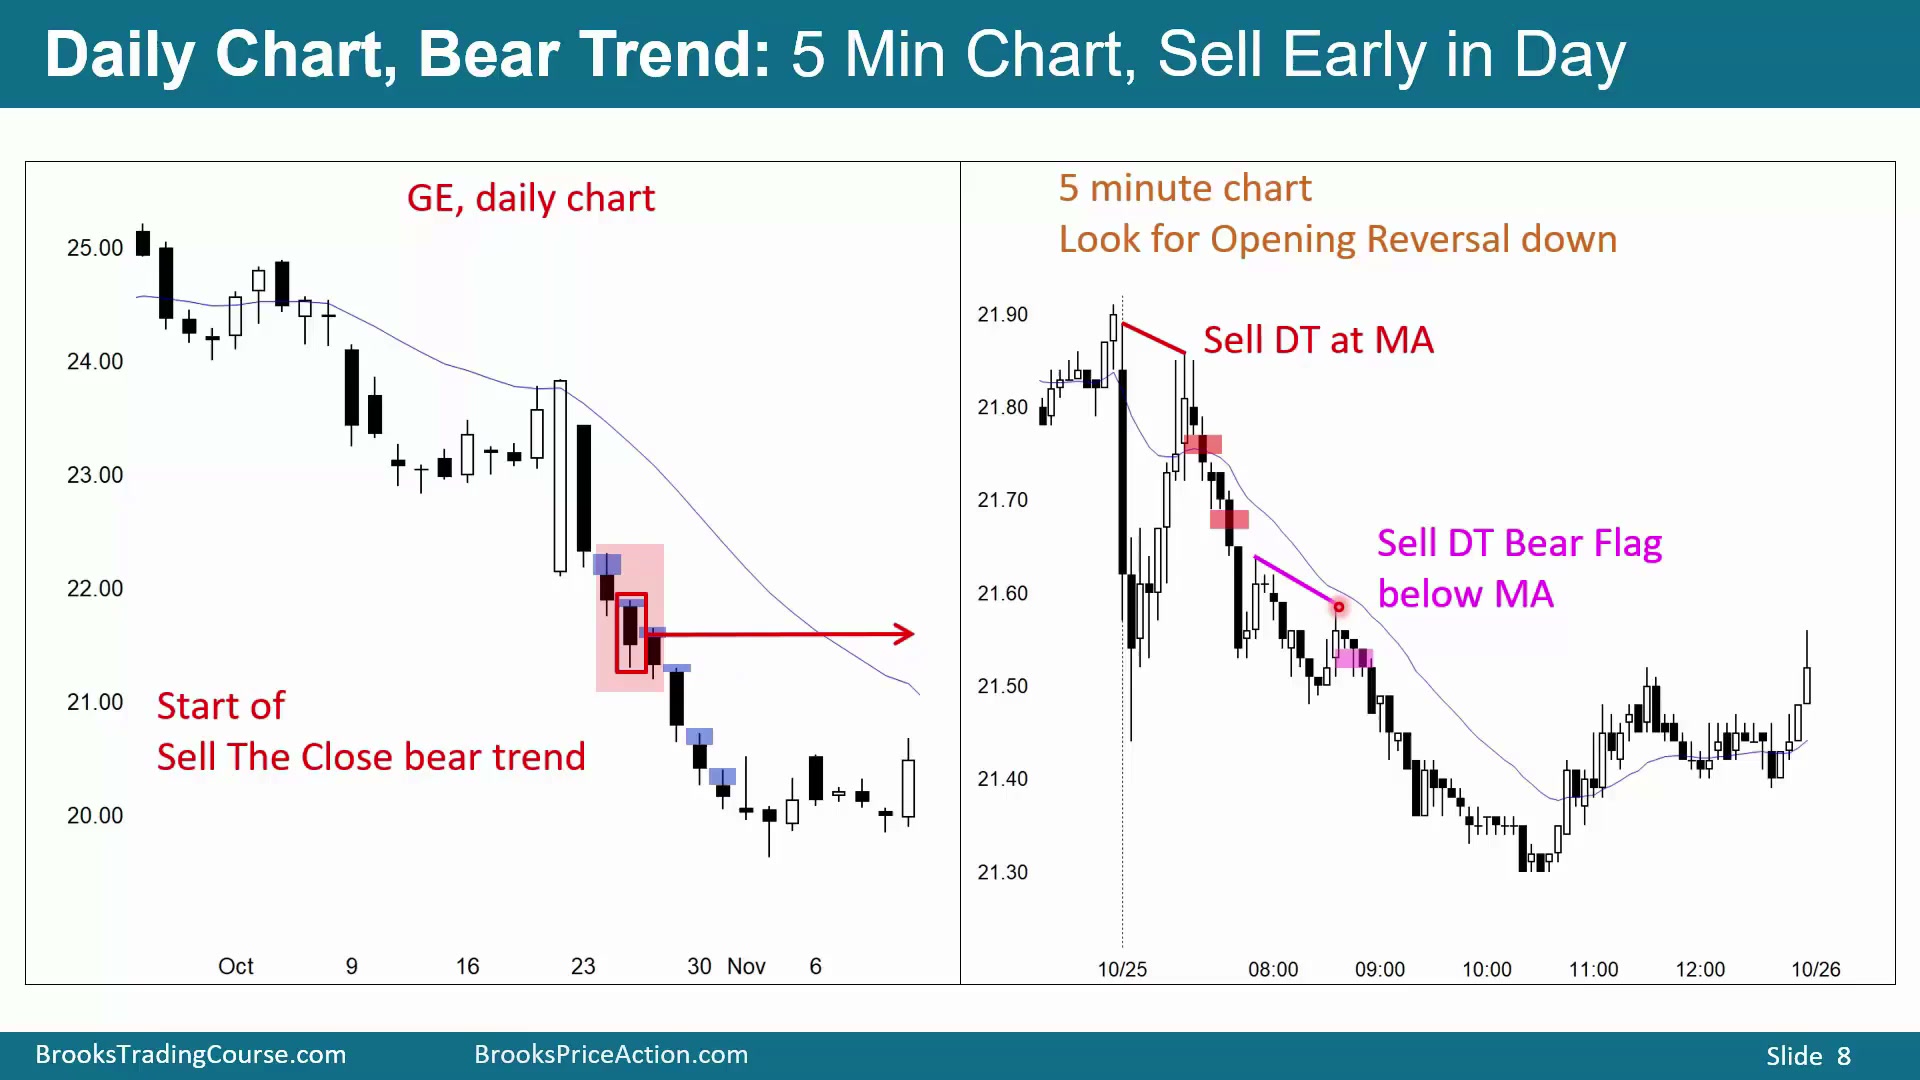
图中下一天在日线空头趋势背景下开盘强烈抛售。但无论开盘抛售多强,开盘强走势始终有约 50% 概率反转:强抛售有 50% 概率向上反转,强上涨也有 50% 概率向下反转。
这里后面形成 double top,第二个高点略低,更偏空;随后有一根收在低位附近的空头 K 线。可以把它作为 double top opening reversal、昨日收盘价测试和均线测试后的做空,寻找可能的向下 swing。当天后面还形成小 double top 和略低高点。大多数 double top bear flag 并不精确,第二个高点经常低于第一个高点,较少时候才略高于第一个高点。
日线多头 micro channel 的第一次回调
Time: 11:55
当日线处于 micro channel 时,交易者会在第一次回调入场。日内交易者如果看到日线是多头 micro channel,就会在跌破昨日低点后寻找买入机会。
bull micro channel 结束时的买入与止损
Time: 12:08
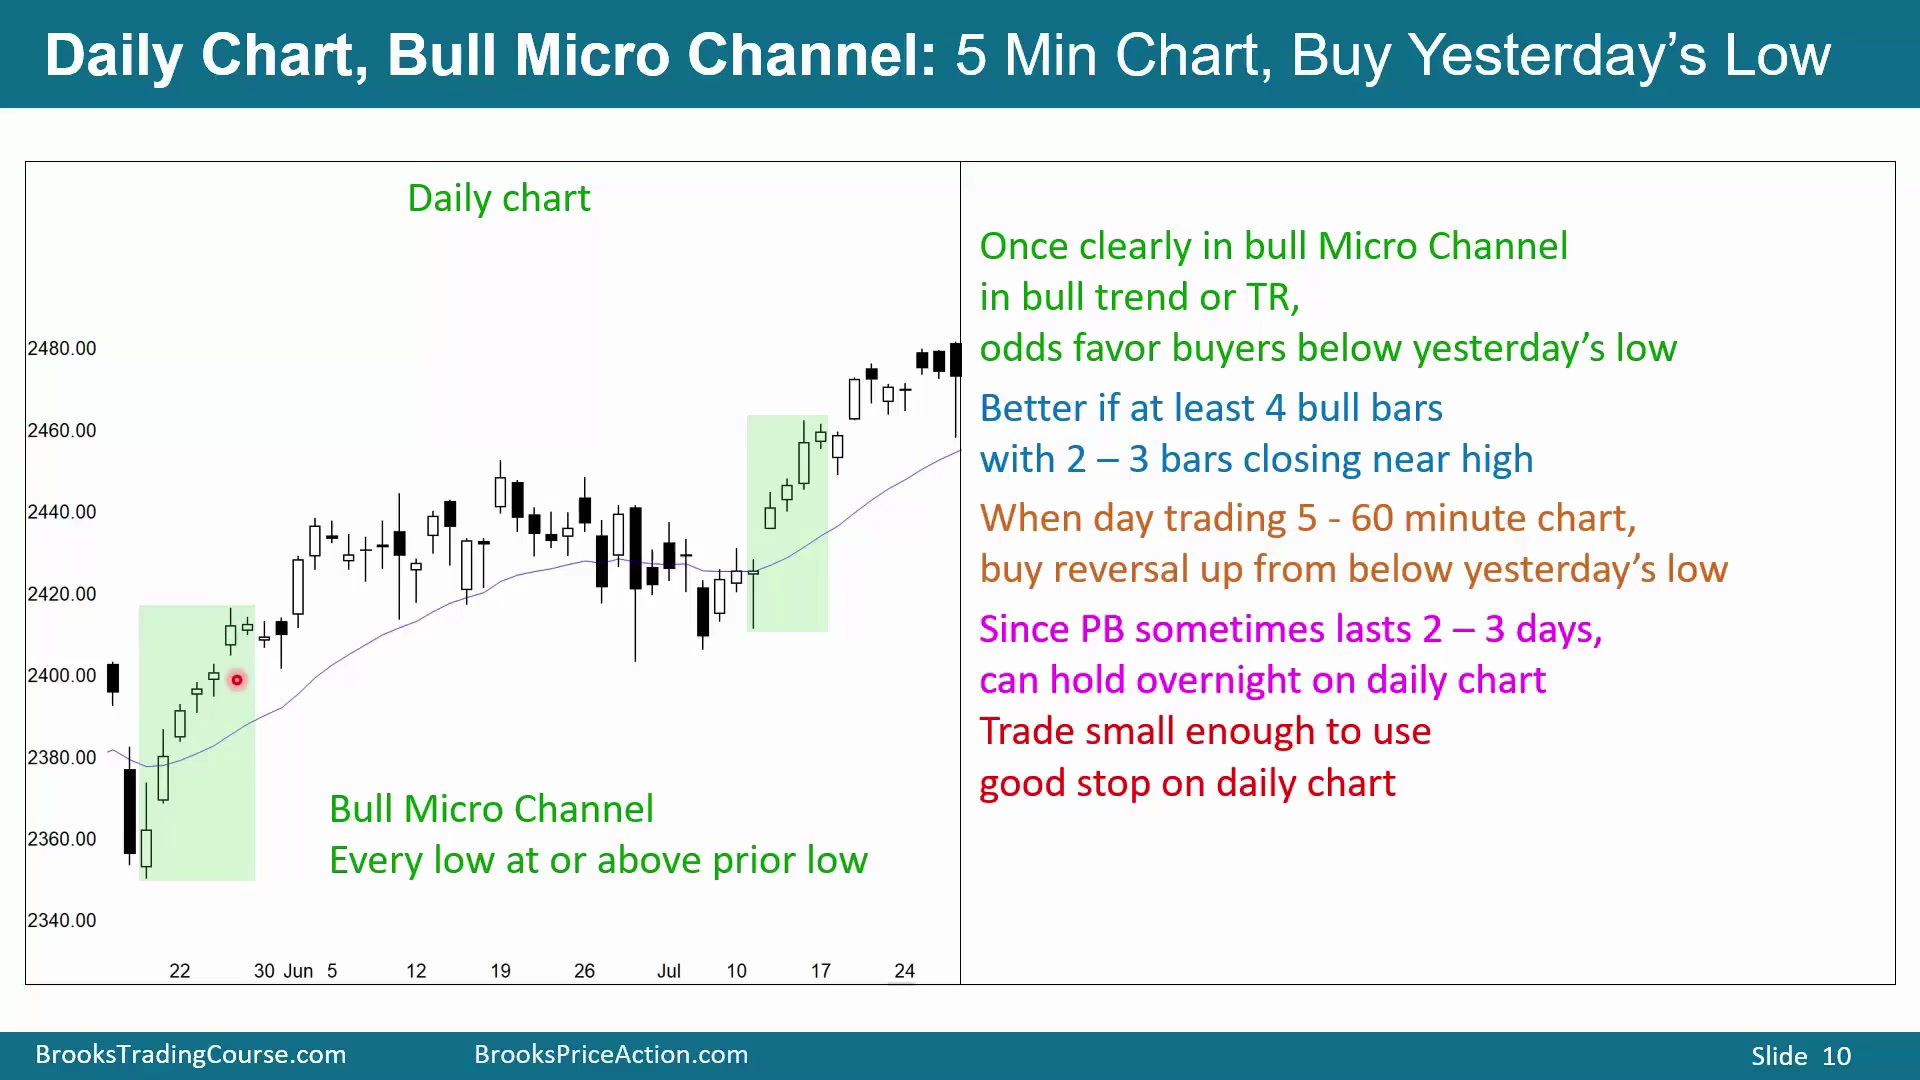
图中日线先后有两个 micro channel。回调发生在跌破前一根 K 线低点时,micro channel 就在那根 K 线结束。一旦市场明显进入 micro channel,通常到第三、第四或第五根 K 线结束时就能判断,交易者会积极买入第一次向下反转。这个反转有时会持续 2 到 3 根 K 线,但交易者仍会寻找前一根 K 线低点下方的买点。
日内交易者看到市场跌破昨日低点后,应寻找这个向下反转失败并恢复多头趋势的机会。也就是说,跌破昨日低点后,要寻找向上反转买入。有时日线回调会持续 2 到 3 天;如果仓位足够小,能容纳合理止损,就可以在 2 到 3 天回调中继续持有,仍然相信市场会走高。初始止损理论上可能很远,但实际不会冒那么大风险;可以接受两到三倍平均日波幅的风险,把止损放在相应位置。关键是仓位要足够小,才能使用合适的止损。
五根 bull micro channel 后的低点反转
Time: 13:45
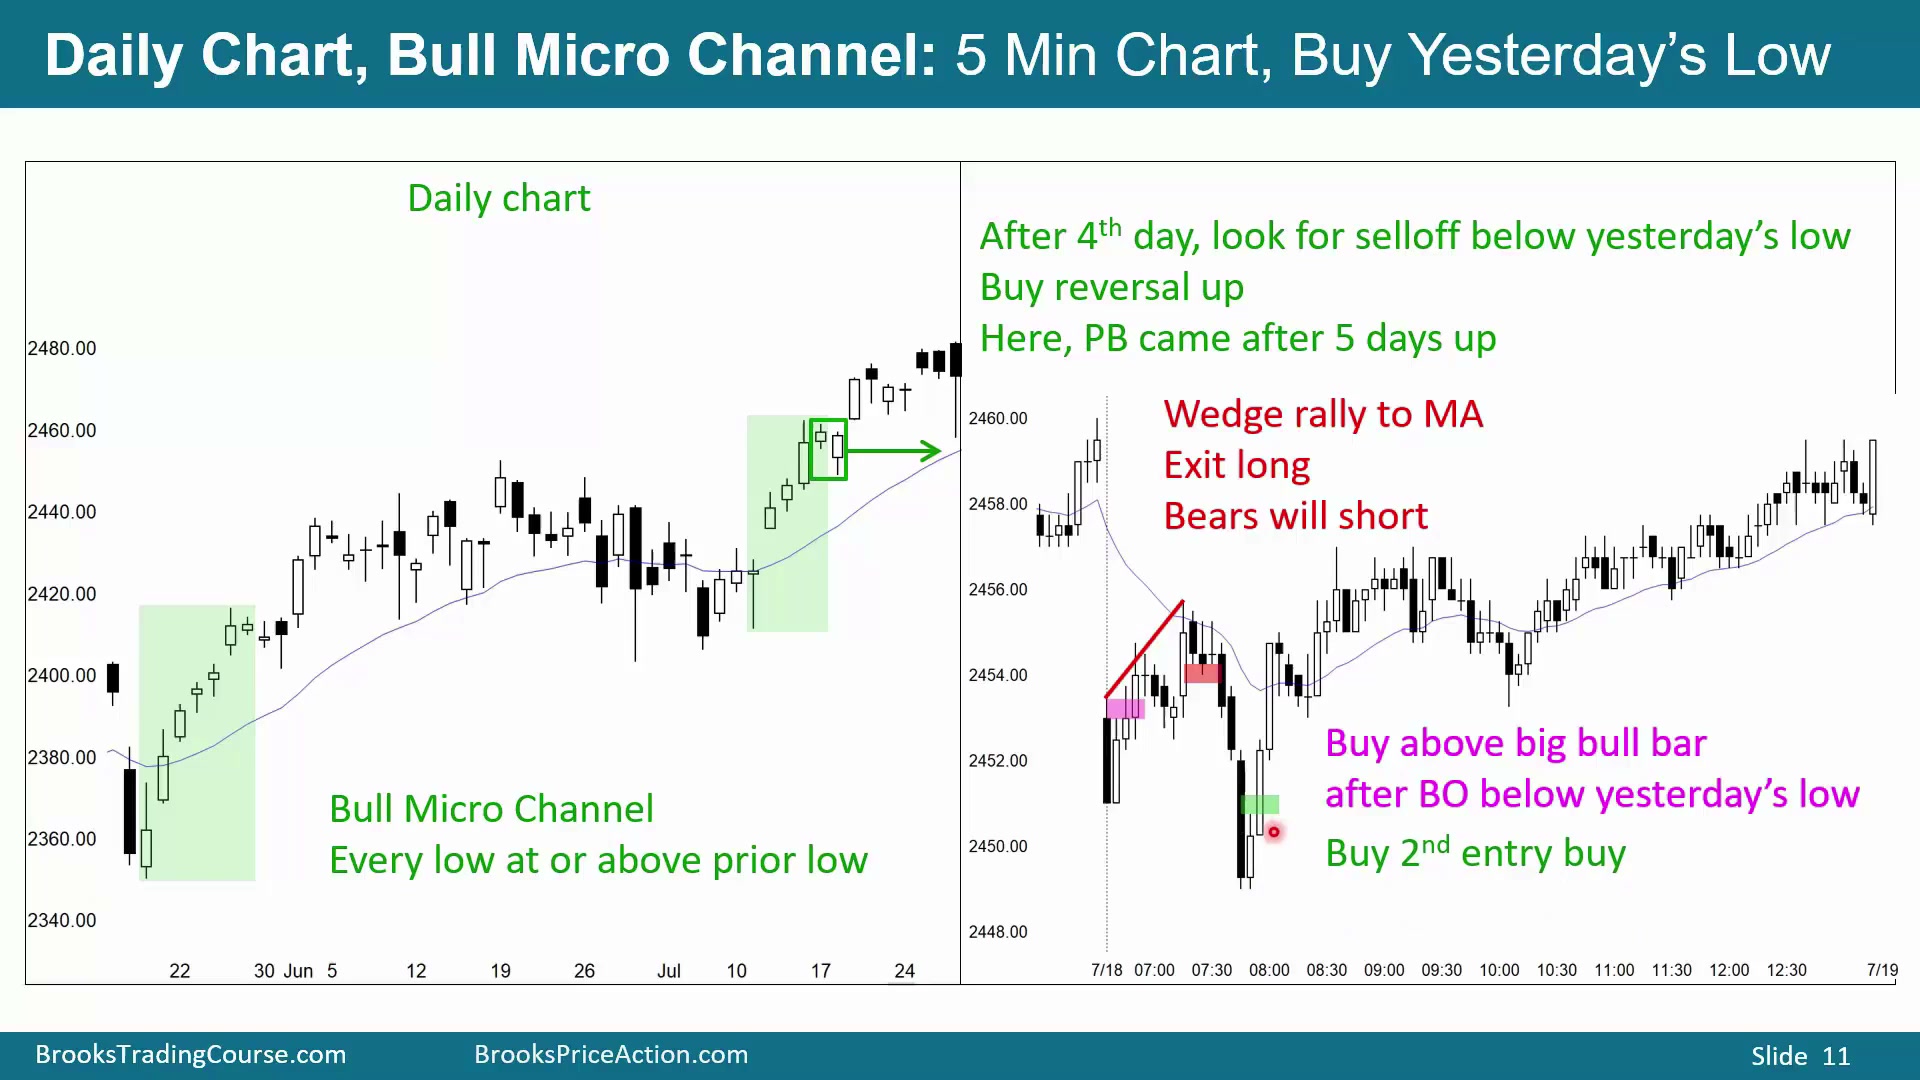
图中日线有 5 根 K 线的多头 micro channel。日线交易者会在昨日低点及其下方买入;如果交易 5 分钟图,就寻找跌破昨日低点后的向上反转。
图中确实从昨日低点下方向上反转,但随后在均线处形成 wedge bear flag opening reversal。如果已经买入,在空头 K 线下方应退出,因为当天可能变成空头趋势日。空头也可以把这里作为上涨到均线后的 opening reversal、wedge 来卖出:三次下推后反弹,再在空头 K 线下方或第二次入场做空。
不过,更高周期仍是多头 micro channel,市场应尝试从昨日低点下方反转。图中的强抛售也可以只是大型 High 2 bull flag:两腿下跌,第一腿、回调、第二腿,并且昨日低点下方有买方。随后出现收在高位的多头 K 线,可以在其高点上方买入;更保守的做法是等一组连续强多头 K 线再买。反弹完全收复了前面抛售,市场可能继续走高,甚至按这段反弹高度形成向上 measured move。
图中跳空低开后从昨日低点下方向上反转,前面买点合理。但当均线处出现空头 K 线,随后又有 micro double top 时,最好退出多头,等待另一个买入信号再买。空头会把它作为做空,期待向下 swing。后面出现 second entry buy,是不错的止损入场买点。
日线 bear micro channel 中卖出昨日高点上方
Time: 15:40
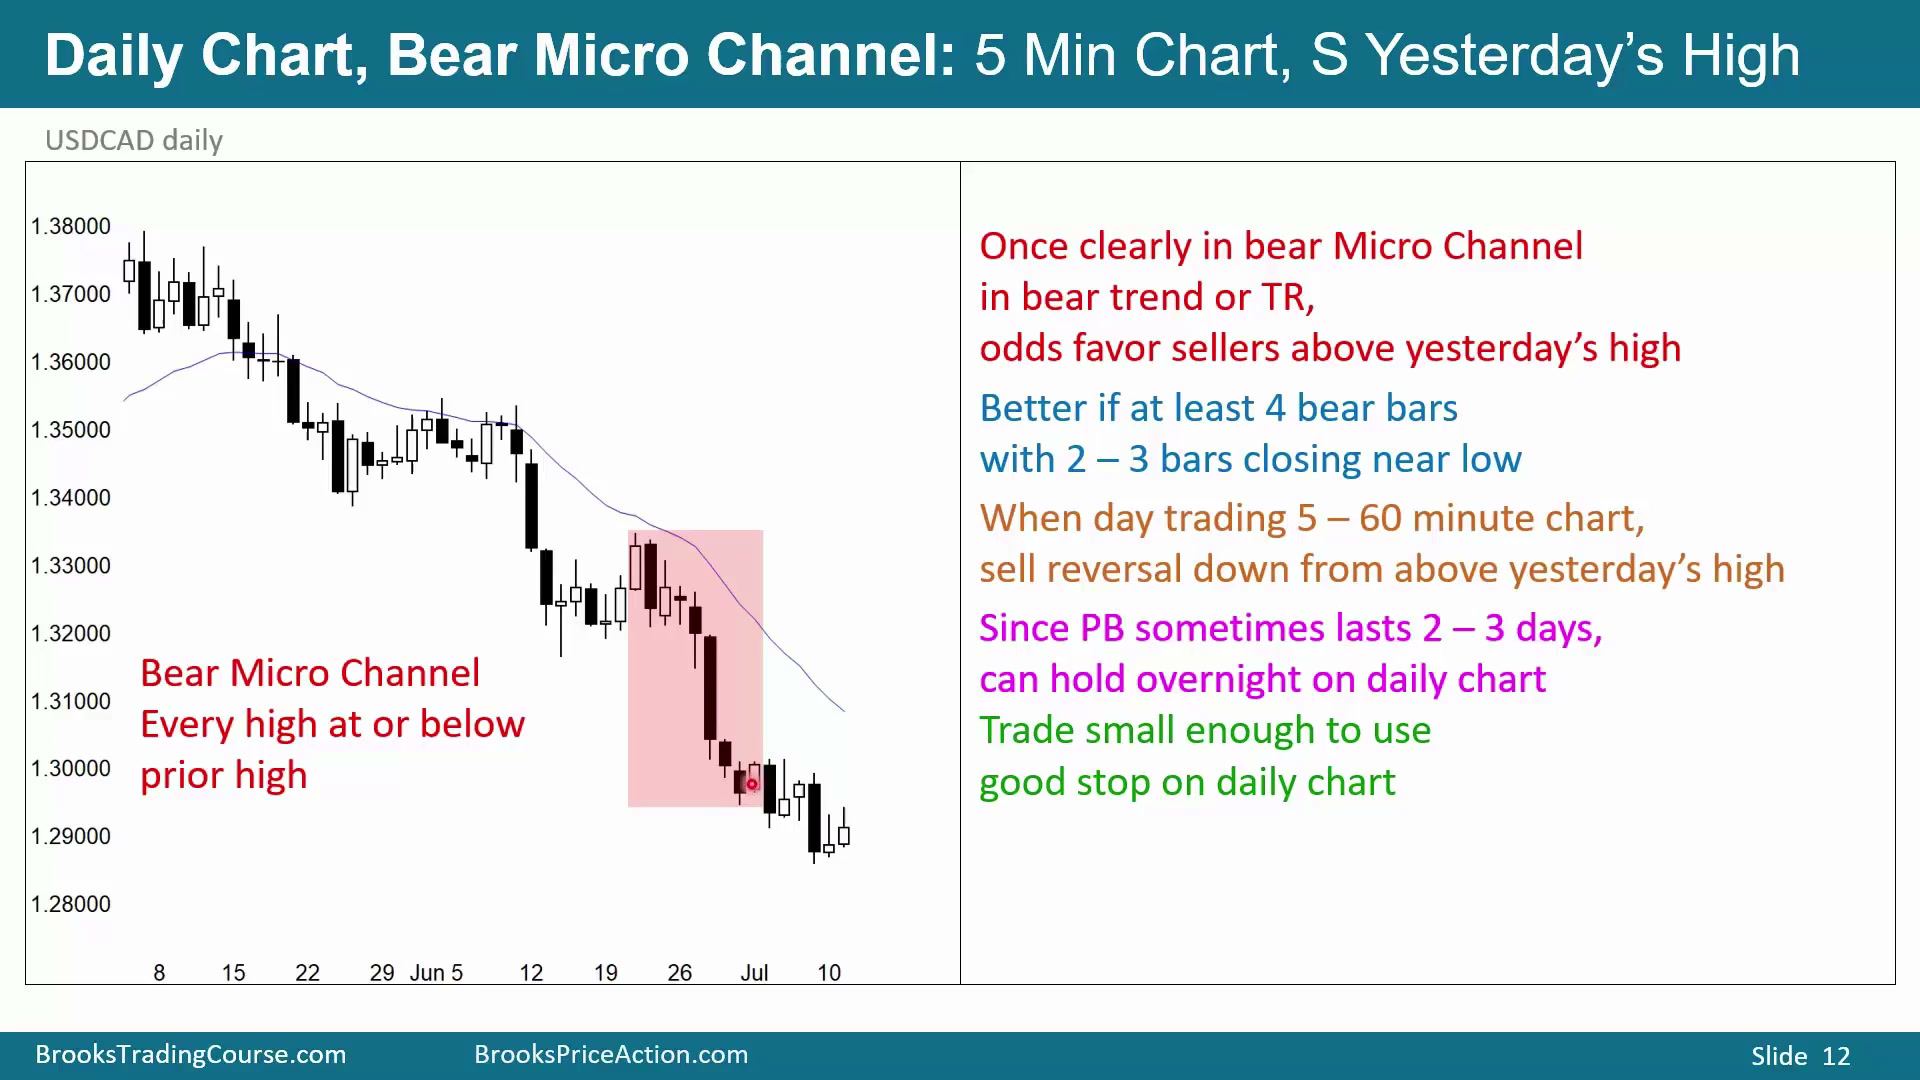
图中是美元兑加元日线,明显处于空头趋势。这里先有 4 根 K 线的 micro channel,后面有更大的 10 根 K 线 micro channel,从某个高点开始,到后面某根 K 线涨破前一根高点时结束。micro channel 期间,每个高点都在前一根高点或其下方。
当日线出现这种 bear micro channel 时,交易者第一次得到机会时会急于在昨日高点上方卖出。日内交易者只要看到日线是 bear micro channel,就应该在昨日高点附近卖出,或等待突破昨日高点后的向下反转卖出。无论交易 5 分钟、15 分钟还是 60 分钟图,只要市场涨到昨日高点上方,就要寻找向下反转。日线交易者很可能会在昨日高点上方卖出,因此空头趋势很可能恢复。
有时这种回调会持续几天;图中只有 1 天,价格短暂涨到昨日高点上方后卖出。交易者必须用足够小的仓位,以便设置合适止损。止损可以放得很高,但通常太远;第一次向上反转很可能只持续 1、2 或 3 天,而且不太会超过近期平均日波幅太多,因此可以使用更紧的止损。
昨日高点上方两次卖出形成空头日
Time: 17:23
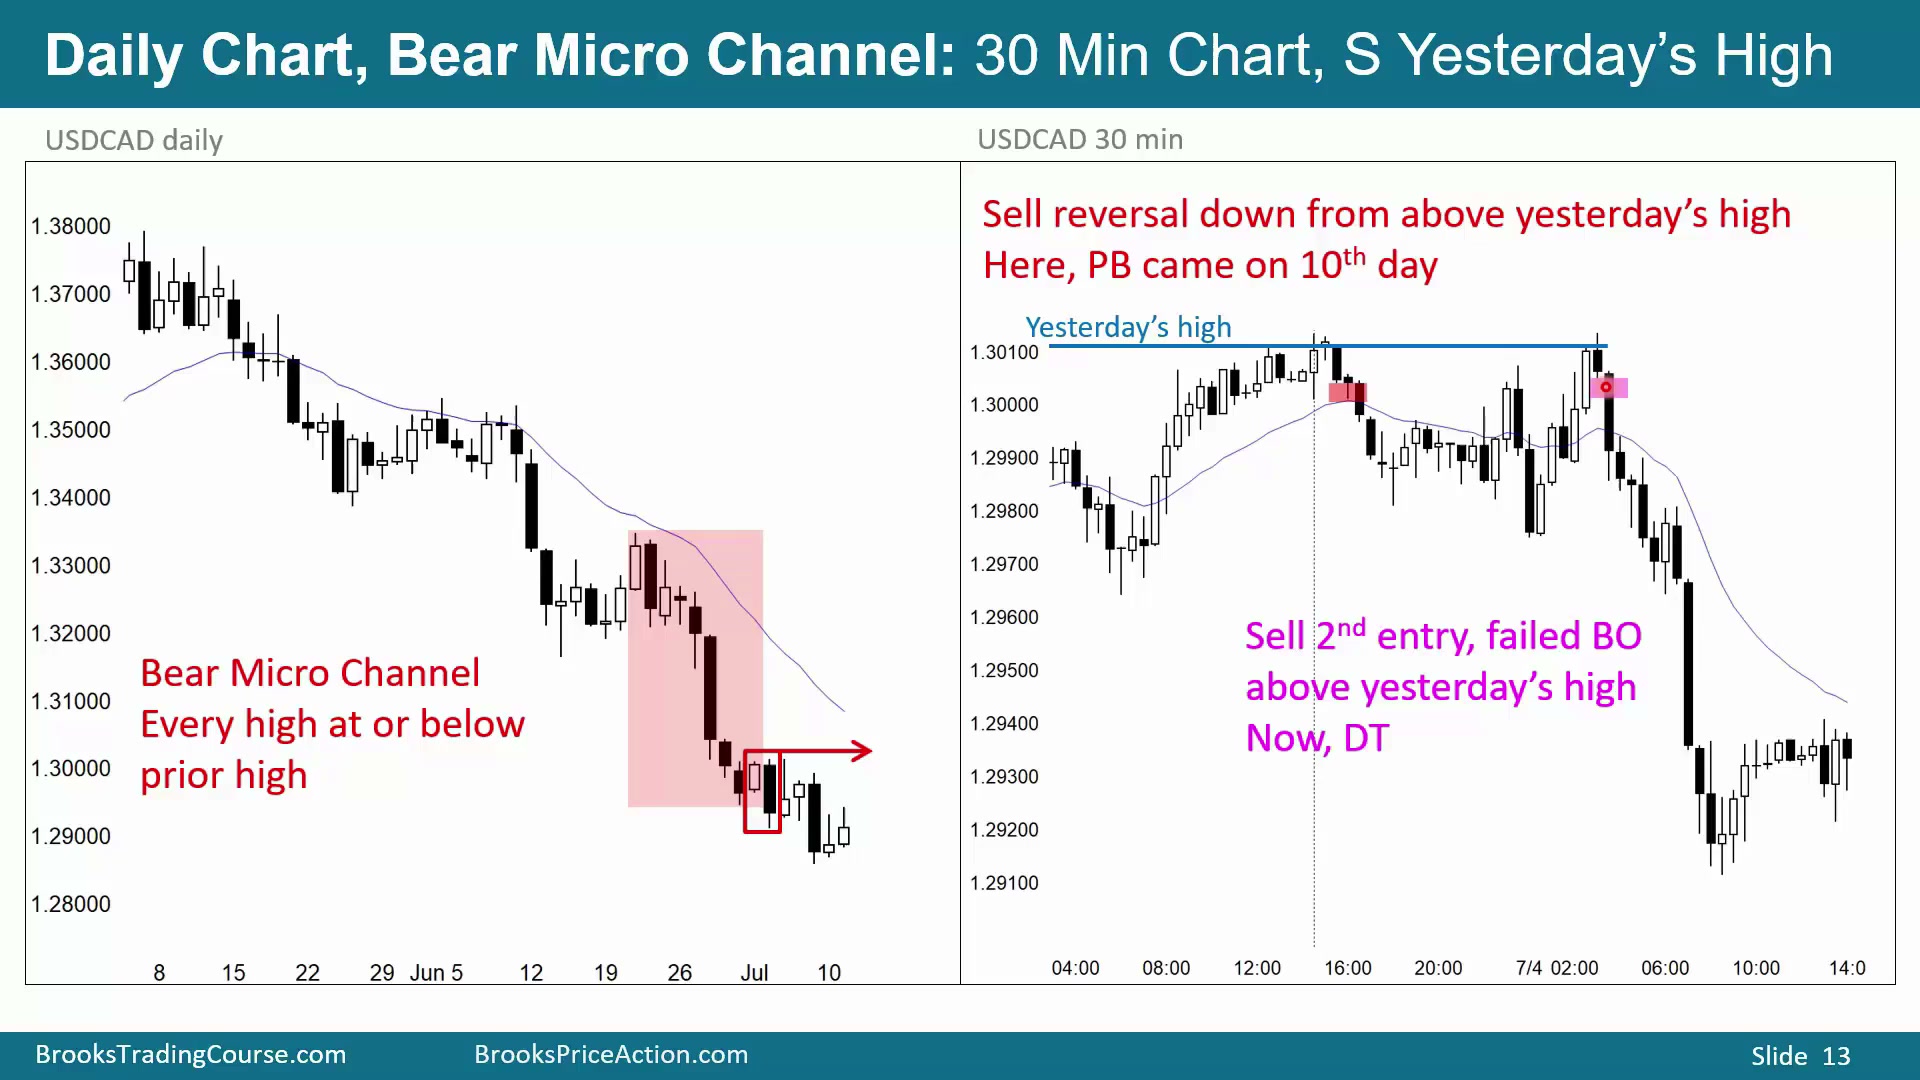
图中是前面日线空头日对应的日内图。市场涨到昨日高点上方时,交易者卖出;之后再次涨到昨日高点上方,交易者再次卖出,押注空头趋势恢复,结果当天成为空头趋势日。它需要 double top 才最终转为空头趋势日。
交易者寻找的是昨日高点上方的向下反转。图中空头 K 线显示昨日高点突破失败,是合理空头。如果第一次做空后在中途退出,市场再次反弹到昨日高点上方,又给了另一次卖出机会;后面出现一根好看的空头 K 线,收在低位,是合理的向下 swing 卖点。
日线交易区间顶部卖强多头 K 线
Time: 18:20
当更高周期图,例如日线,处于交易区间时,区间顶部附近的大多头趋势 K 线不是 Buy The Close,而是 Sell The Close 的候选背景。区间底部附近收在低位的大空头 K 线也不是追空理由,交易者应寻找向上反转买入。
日内交易者如果看到日线交易区间底部附近出现大空头 K 线,第二天应在低周期寻找向上反转做多。这个日内交易可能在之后 2 到 3 天内发展成 swing trade。
欧元兑日元交易区间的80%规则
Time: 18:50
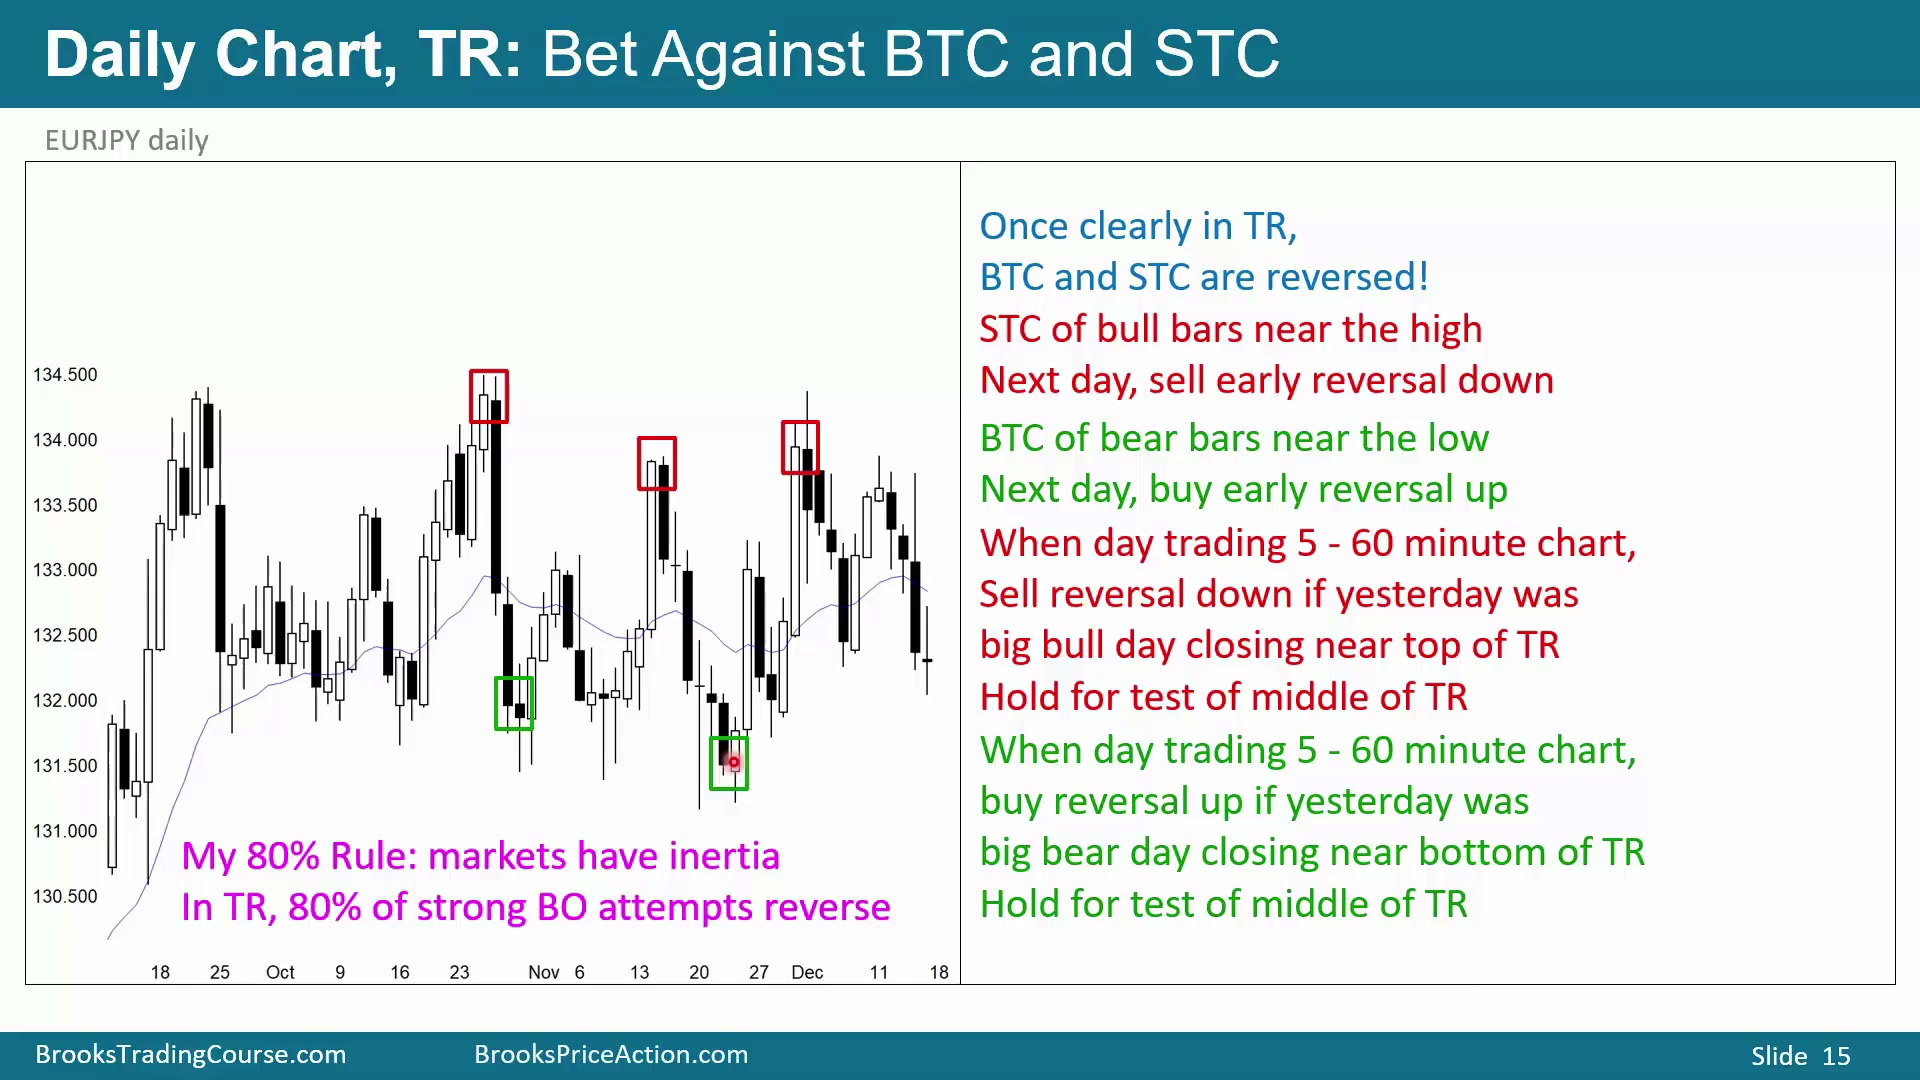
图中是欧元兑日元日线,明显处于交易区间。区间顶部有大多头 K 线,但后面跟进是反转;区间底部也有大空头 K 线,但后面不是 Sell The Close 空头趋势,而是反转。
这里要使用 80% 规则。市场有惯性,倾向继续做正在做的事。如果它处在交易区间,就要假设每次突破尝试有 80% 概率会反转。区间顶部附近,不应买入强多头收盘,而应寻找向下反转卖出;区间底部附近,不应卖出强空头 K 线,而应买入或寻找向上反转。
因此,底部寻找向上反转;顶部预期多头突破尝试失败并向下反转。日内交易者如果看到日线区间底部附近出现大空头 K 线,下一天应寻找向上反转;如果看到区间顶部附近出现大多头 K 线,下一天应寻找向下反转。买入后可以持有到测试交易区间中部;卖出后也可以持有到回测区间中部。
60分钟图上卖出日线顶部强多头日之后的反转
Time: 20:40
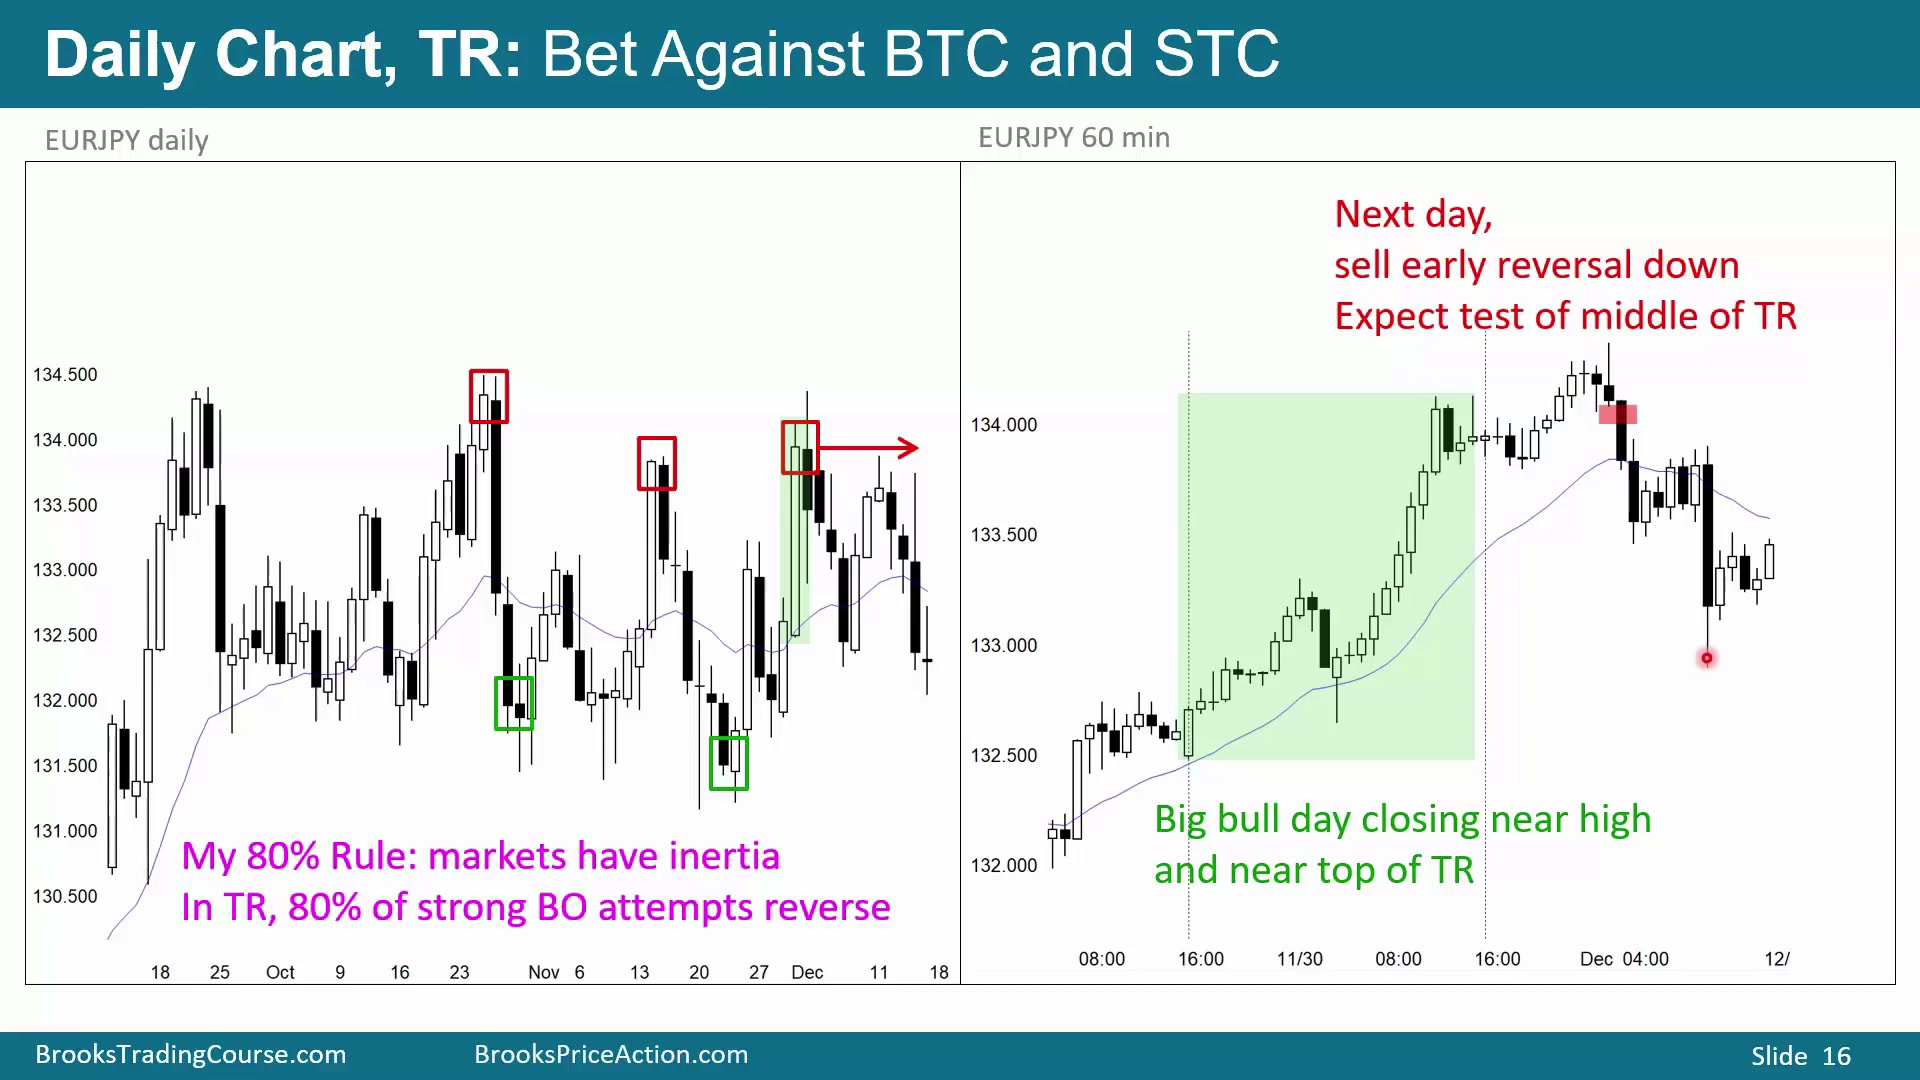
图中是前面日线交易区间的 60 分钟图。绿色标记的是日线上的大多头日及其后一天。后一天形成 micro double top:价格上、下,再上、下,并出现一根非常好看的空头 K 线,收在低位。
在这根空头 K 线低点下方用止损单卖出,寻找向下 swing,是合理交易。若只按日内 swing 处理,可以获利约 100 pips;如果继续持有几天,利润会更多。
60分钟图上买入日线区间底部失败突破
Time: 21:15
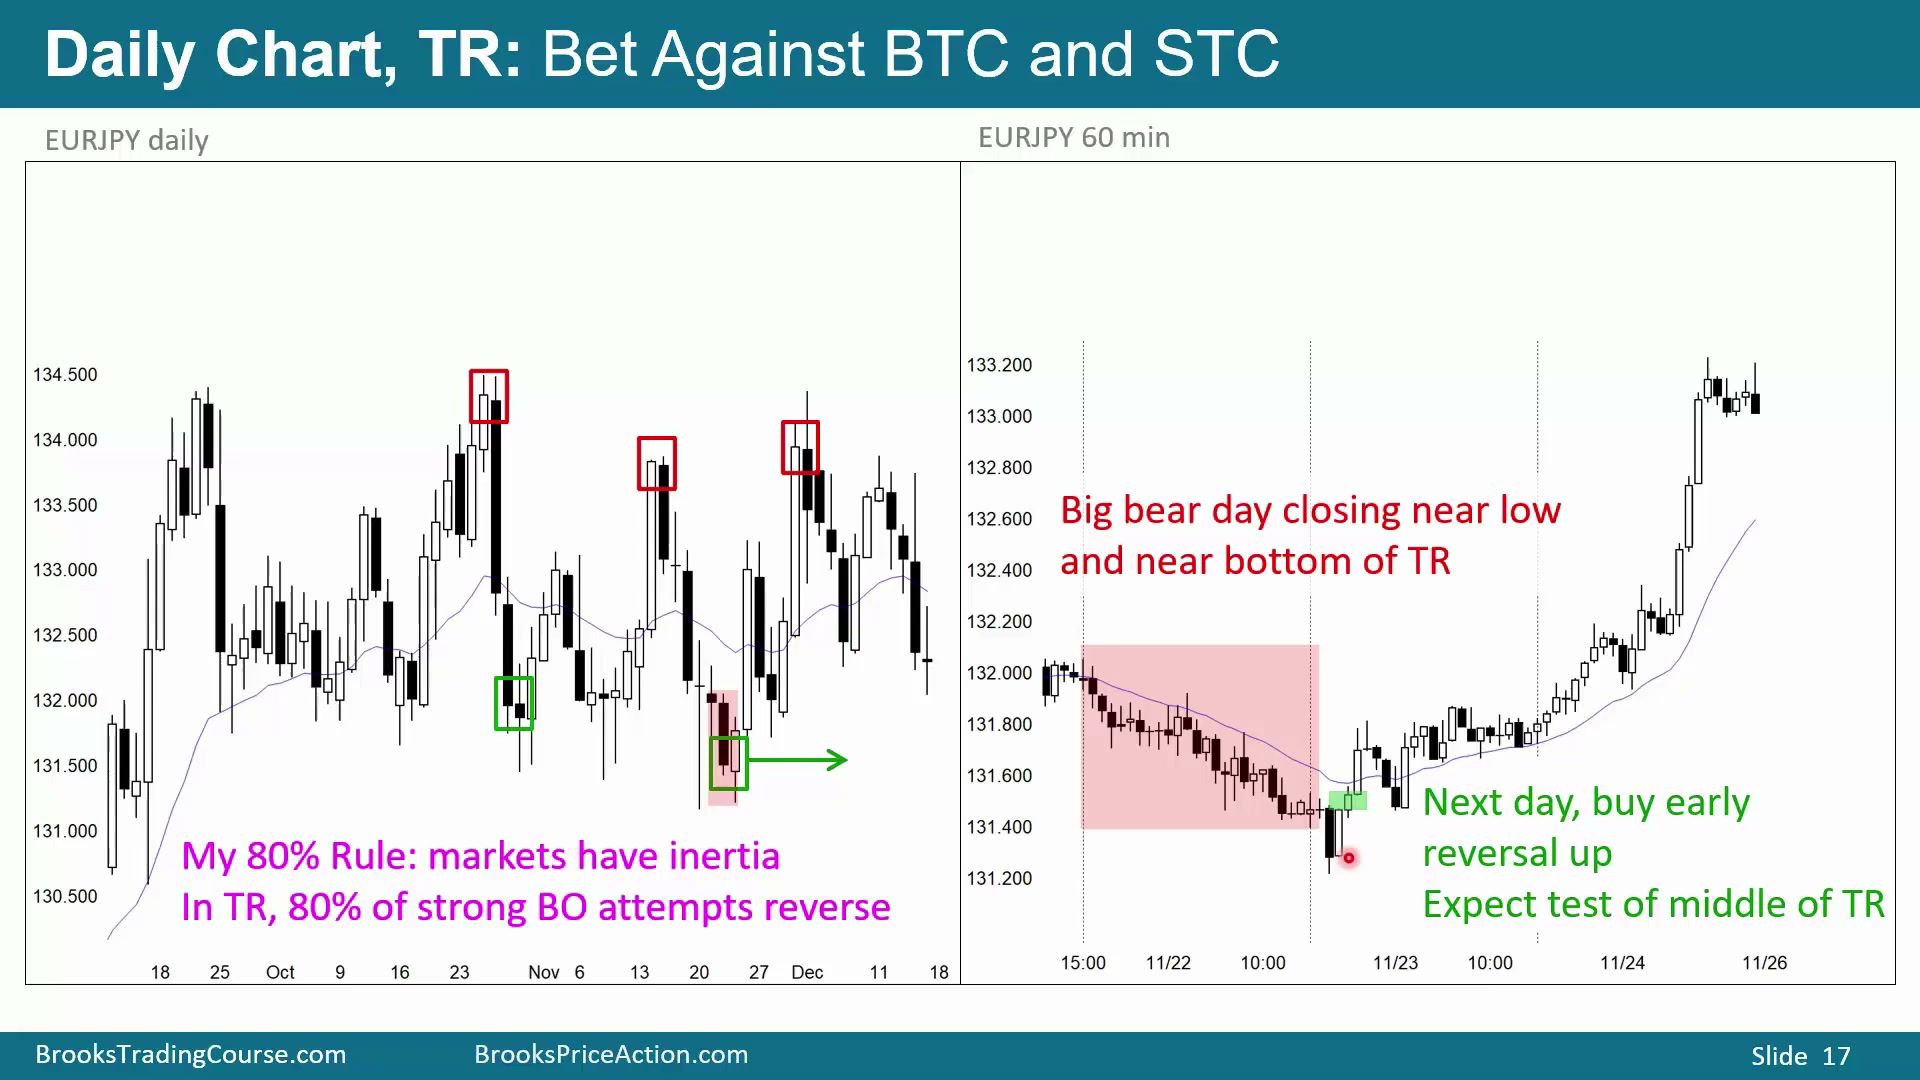
图中来到交易区间底部,并在日线上出现大空头 K 线,也就是红框中的那一天。切到 60 分钟图后,应假设空头突破尝试会失败,因此寻找向上反转买入。
如果交易 60 分钟图,这里出现了好的向上反转。多头 K 线收在高位,形成两根 K 线反转;同时这是交易区间底部买入区域中,对昨日低点的失败突破。因此在这根多头 K 线高点上方用止损单买入合理。
更高周期支撑阻力给低周期反转定位
Time: 21:55
日内交易者应经常查看更高周期的支撑和阻力,并在这些位置寻找低周期反转。这样做不是把低周期信号孤立使用,而是让更高周期的位置决定日内 swing 的方向和预期目标。
60分钟均线支撑处的5分钟买入
Time: 22:03
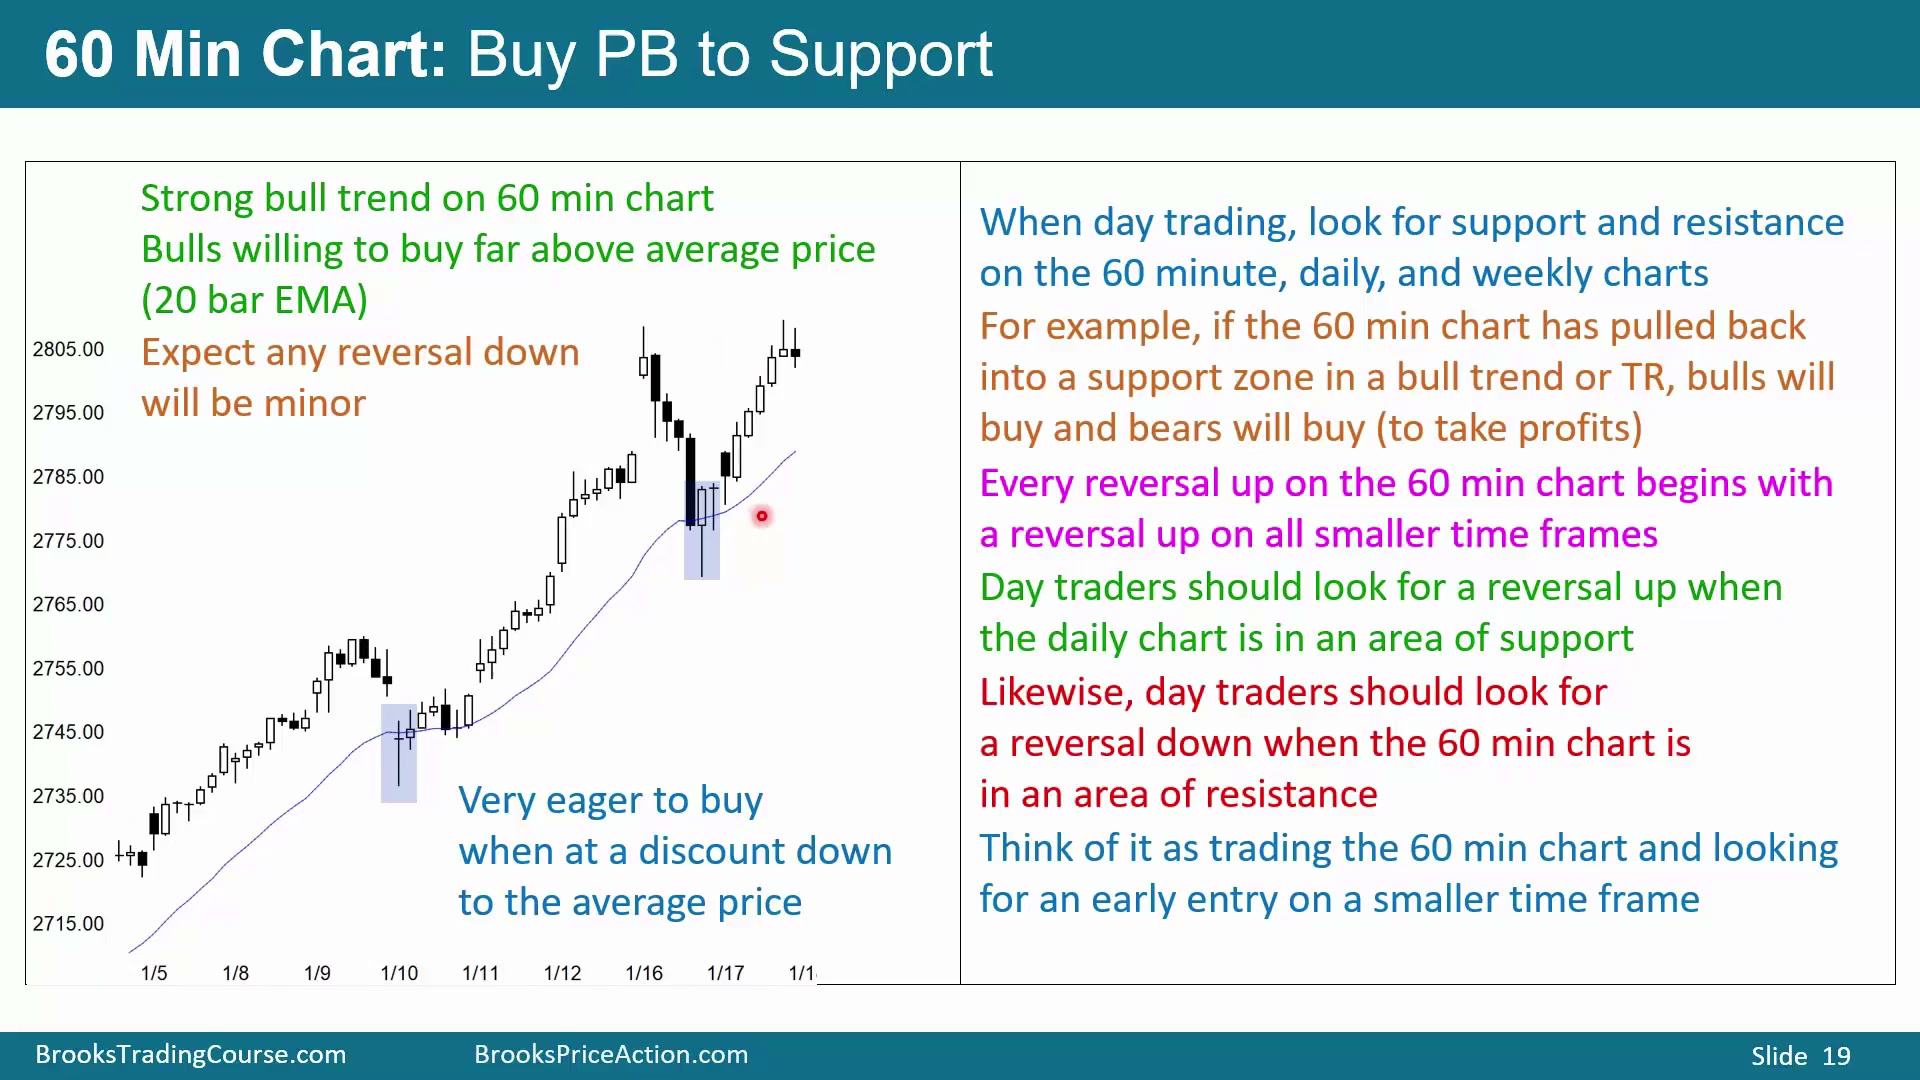
图中 60 分钟图处于强多头趋势,交易者此前多次在均线处买入。即使某次 5 分钟图抛售很强,它也可能只是 sell vacuum,快速测试 60 分钟均线支撑。日内交易者如果交易 5 分钟图,必须在 60 分钟均线附近寻找向上反转。
多头此前愿意在远高于平均价格的位置买入;当价格终于回到平均价格时,相当于打折,他们会积极买入,寻找多头趋势恢复。日线、周线、甚至月线上的支撑阻力也可以使用,只是那些高周期支撑测试出现得更少。
在支撑位和平均价格处,即使出现强抛售,交易者仍会寻找买入。空头会买回空单,多头会买入,押注多头趋势恢复。高周期上的每一次向上反转,都先从小周期向上反转开始。因此,如果交易 5 分钟图,并知道市场正在回调到 60 分钟均线,就要在 5 分钟图寻找向上反转买入。
这里是多头趋势。如果是空头趋势,交易者就会在任何反弹到阻力处时寻找卖出。用 5 分钟图交易、但依据 60 分钟图做决策时,本质上做的是 60 分钟交易,5 分钟图只是提供更早入场。
5分钟强空头日到达60分钟均线支撑
Time: 24:15
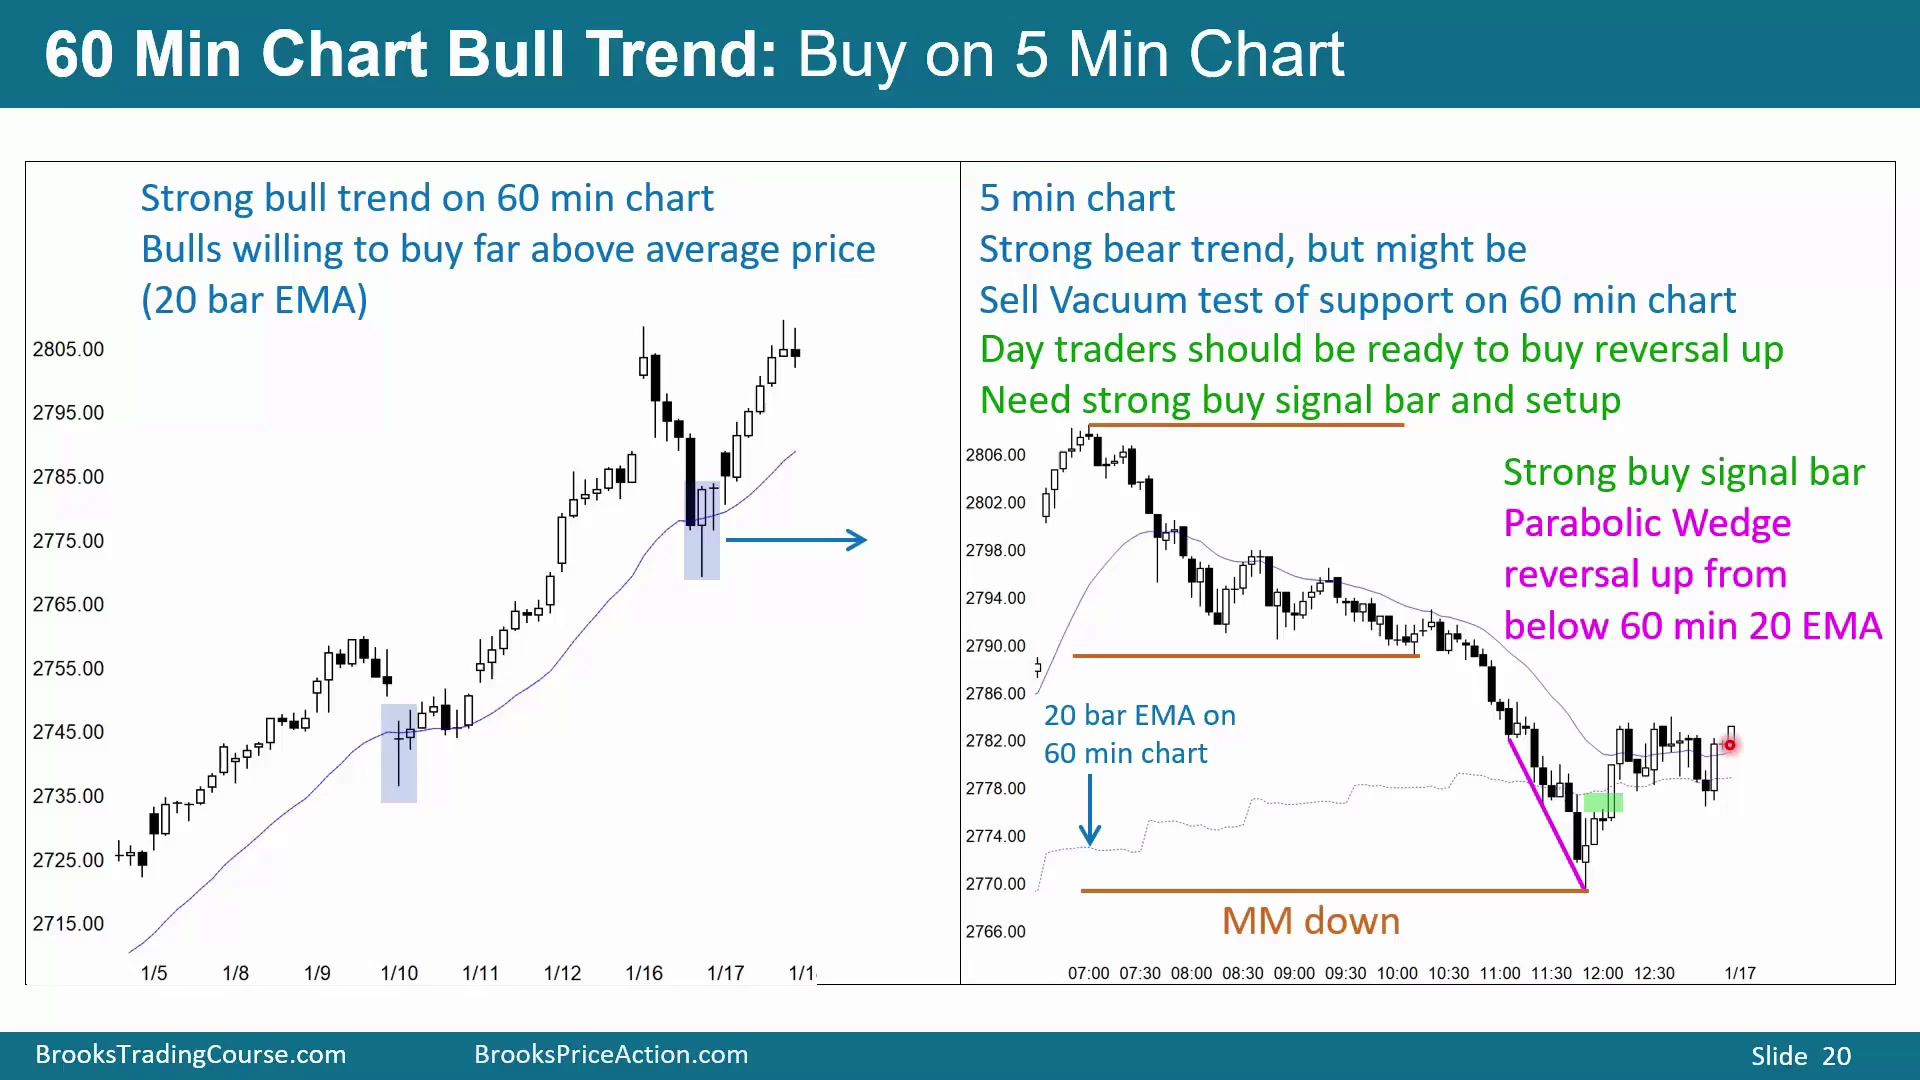
图中 60 分钟图出现强抛售,并在均线处向上反转。对应的 5 分钟图当天是强空头趋势,日内交易者在 5 分钟图上几乎整天都在卖出;但当价格跌破 60 分钟均线时,必须开始寻找向上反转买入。图中把 60 分钟均线画在 5 分钟图上,价格两次跌破这条线后向上反转。既然 60 分钟图处于强多头趋势,就知道均线处会有买方。即使 5 分钟图整天做空,到了 60 分钟均线也必须买回空单,甚至反手做多。
多头一开始试图形成 wedge bull flag,但市场向下突破,并按 measured move 下跌。5 分钟图仍是强空头趋势,所以即使来到 60 分钟均线支撑,也需要强买入设置才能逆 5 分钟趋势买入。图中有三根 K 线反转,先下后上,并出现收在高位的多头 K 线;还有一系列 sell climax,形成可能的 parabolic wedge bottom。市场此前尝试筑底失败并向下突破,跌幅正好接近、并实际达到从高点到底部尝试高度测量出的 exact measured move down。支撑、60 分钟均线和 parabolic wedge 同时出现,因此在好看的多头 K 线上方寻找买入合理。
买入后,价格在小空头 doji 突破多头 K 线高点时成交。这本质上是 60 分钟交易。如果愿意,可以持有到 60 分钟多头趋势恢复;如果只按 5 分钟交易,通常会在 5 分钟均线附近或接近收盘时退出,也可以保留一部分仓位,期待多头趋势恢复。
日线空头趋势中在50日均线阻力卖出
Time: 26:40
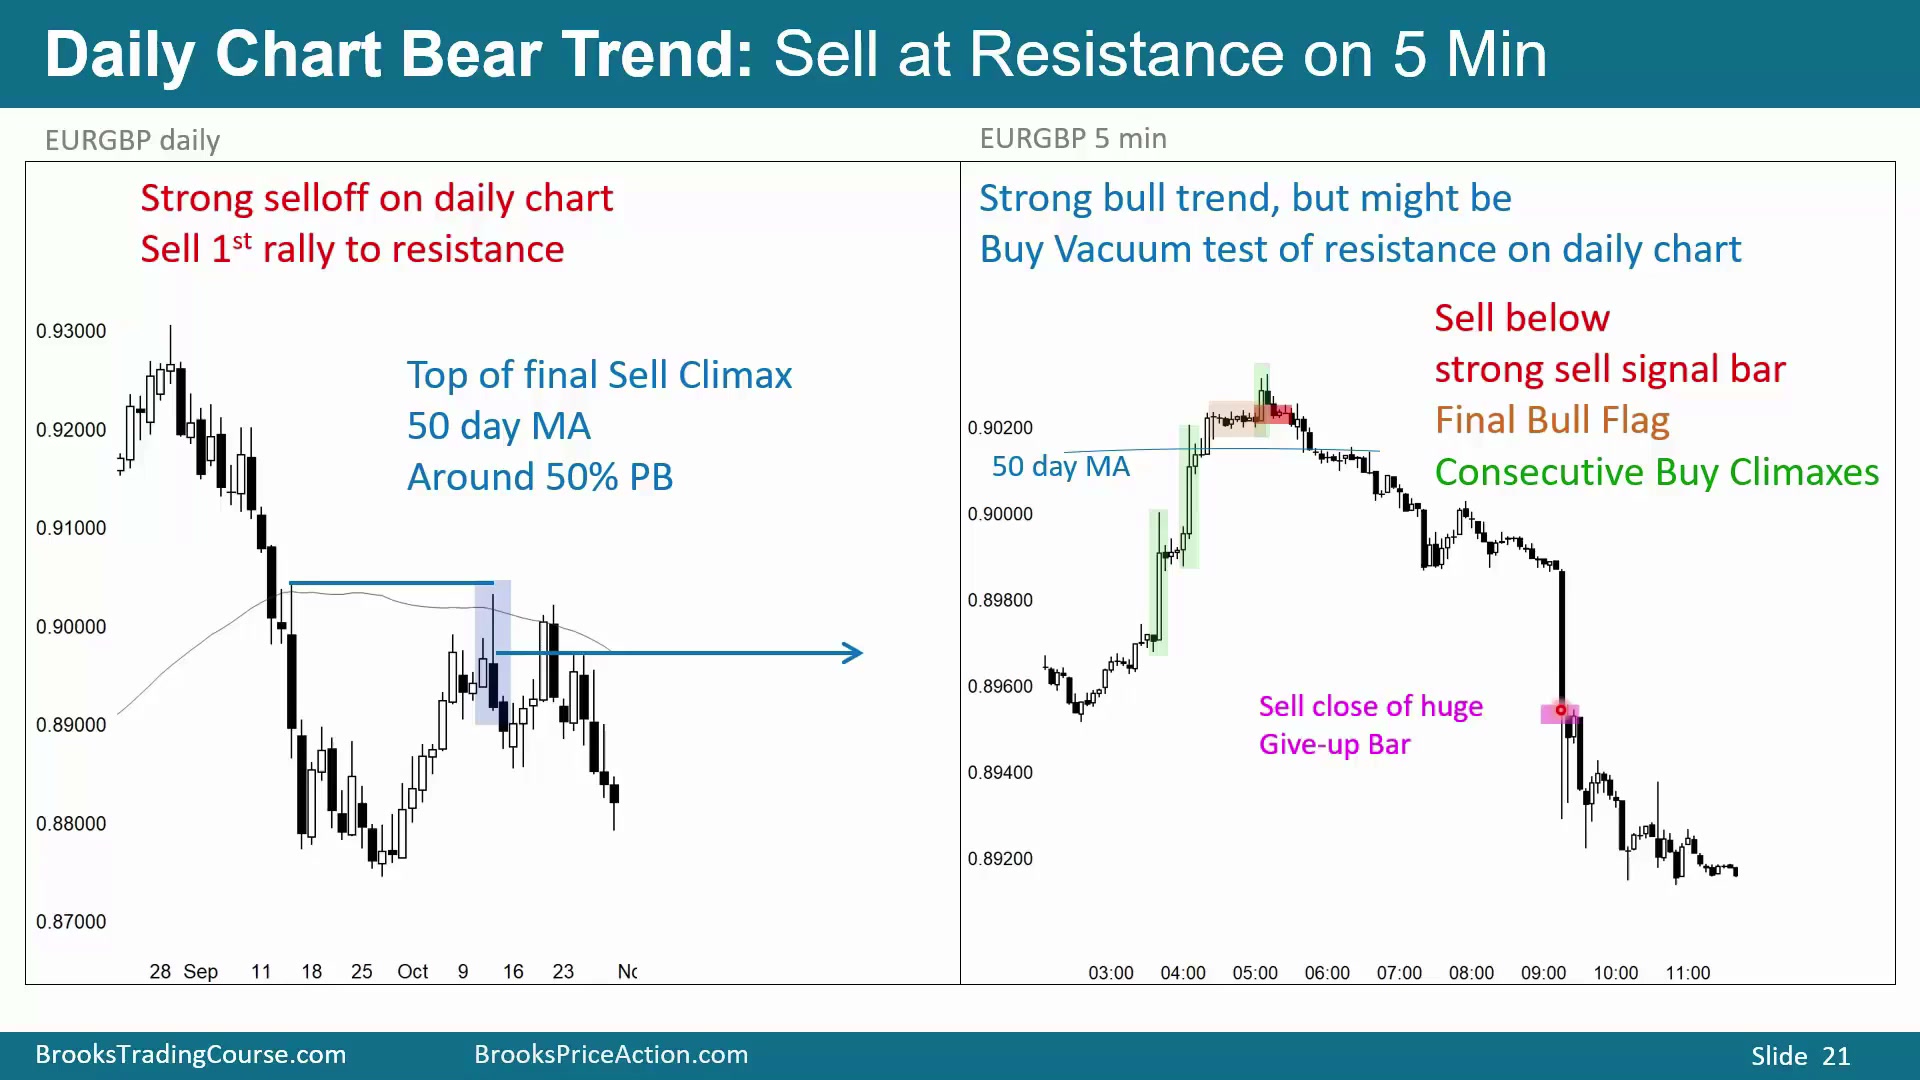
图中是欧元兑英镑日线,处于空头趋势。因此交易者会在阻力处卖出,例如 50 日均线、最近 sell climax 的高点测试,以及前面抛售约 50% 回调附近。日内交易者知道日线已经到阻力,就可以在 5 分钟图、60 分钟图或自己交易的低周期图上寻找向下反转卖出。
图中大空头日对应 5 分钟图。当天早盘强烈上涨,但只是 buy vacuum 测试阻力。图中把 50 日均线画在 5 分钟图上;它同时对应日线 50 日均线、sell climax 高点测试和约 50% 回调。交易者会在该阻力处寻找向下反转,尤其是在连续 buy climax 一、二、三、四之后;也可以看成 parabolic wedge top。随后多头趋势末端形成 trading range,可能是 final flag,并在 5 分钟图上出现非常好的卖出信号 K 线。在该空头 K 线低点下方向下反转卖出合理。
如果想要更高概率,可以等图中巨大空头 K 线远远跌破潜在牛旗。此时继续下跌概率高,可以卖出该空头收盘或跟进 K 线收盘。多头正在放弃,市场至少可能出现第二腿下跌,甚至更多。
高周期背景的日内应用总结
Time: 28:40
日线处于 Buy The Close 多头趋势时,当天常有小的早盘抛售,在日线 K 线底部形成下影线。5 分钟图日内交易者应寻找这个早盘抛售后的向上反转买入。日线处于 Sell The Close 空头趋势时则相反,早盘常有反弹失败并形成当日早期高点,日内交易者寻找向下反转卖出。
日线处于多头 micro channel 时,昨日低点下方很可能有买方;日内图跌破昨日低点后,应买入向上反转。日线处于空头 micro channel 时,昨日高点上方很可能有卖方;日内图突破昨日高点后,应卖出向下反转。
日线处于交易区间时,要假设区间顶部附近的大多头 K 线会失败,而不是转为 Buy The Close 多头趋势。交易者会卖出收盘,或在下一天寻找早盘向下反转卖出。区间底部附近的大空头 K 线同理,日内交易者下一天寻找早盘向上反转买入。最后,只要高周期图上有支撑或阻力,就可以在小周期图上寻找该位置的反转,把它作为日内 swing 交易的依据。